SlideShare a Scribd company logo
Asia Pacific Equity Research
                                                                                                                                     15 October 2012


The Asian View                                                                                  Sunil Garg AC
                                                                                                (852) 2800-8518
Top country and sector ideas                                                                    sunil.garg@jpmorgan.com
                                                                                                J.P. Morgan Securities (Asia Pacific) Limited

   Countries                                                  Page            Sector                                                                Page
   Strategy                                                   2              Consumer New                                                           15
   China                                                      5              Energy                                                                 16
   Hong Kong                                                  6              Financials                                                             17
   India                                                      7              Gaming and Leisure                                                     18
   Indonesia                                                  8              Healthcare                                                             19
   Malaysia                                                   9              Infrastructure                                                         20
   Singapore                                                  10             Insurance                                                              21
   South Korea                                                11             Internet / New Media                                                   22
   Taiwan                                                     12             Metals & Mining                                                        23
   Thailand                                                   13             Real Estate                                                            24
                                                                             SMID-Caps                                                              25
                                                                             Technology Hardware New                                                26
                                                                             Technology Upstream                                                    27
                                                                             Telecommunications                                                     28
                                                                             Transportation                                                         29
                                                                             Utilities & Power equipment                                            30
                                                                             Derivatives                                                            31


See the end pages of this presentation for analyst certification and important disclosures, including non-US analyst disclosures.
J.P. Morgan does and seeks to do business with companies covered in its research reports. As a result, investors should be aware that the firm may
have a conflict of interest that could affect the objectivity of this report. Investors should consider this report as only a single factor in making their
investment decision. In the United States, this information is available only to persons who have received the proper option risk disclosure documents.
                                                                                    1
Please contact your J.P. Morgan representative or visit http://www.optionsclearing.com/publications/risks/riskstoc.pdf.
Adrian MowatAC
                                                                                                                           (852) 2800-8599
                                                                                                             adrian.mowat@jpmorgan.com
                                                                                                J.P. Morgan Securities (Asia Pacific) Limited

Emerging markets and AP equity strategy
 Key Messages                                               Investment themes/issues
  2013 is a continuation of 2012 macro trends               Focus on earnings revisions…micro not macro
     Slow DM growth
                                                             EM Nifty Fifty: (JPGIENIF Index)
     Lower profits in China lead to lower capex and cost
        reduction to rebuild margin = lower GDP              China’s three inflection points
                                                                 Demographics
  Investors reluctantly buy equities
                                                                 2008/9 stimulus
     QE3: interest rates low until 2015
                                                                 Deflating housing bubble
     ECB and Fed actions reduce tail risks
                                                             OW Tech…an unusual seasonal lift
  Do not extrapolate previous QEs
     Money chases momentum                                  Margin expansion – falling PPI
        –   Credit and equities not commodities
                                                             Strong demand for EM fixed income
        –   DM equities plus EM growth
     Knee-jerk reaction: Rotation into underperformers      OW India and Turkey


 Country recommendations                                    Risks to our view + volatility

  Overweight:
                                                             China: Large stimulus
       Mexico, India, Turkey, Thailand and Philippines
                                                             QE: Leading to higher commodity and energy prices
     Technology, consumer discretionary

  Underweight:                                              Drivers of volatility
     China, Brazil, (Australia)                                 Euro fiscal crisis
     Materials                                                  US fiscal cliff
                                                                 China data


                                                            2
Heat-maps: Key sectors in country recommendations
                                                            OW: India, Turkey, Mexico, Thailand and Philippines
                                                                        UW: China, Brazil, (Australia)


     Emerging Markets Equity Strategy Heat Map
                                                                                                                                         Mexico tel.        Mexico
     China Others            China                                                          Brazil Financials                                                            Thailand
                                                         Taiwan IT                                                               Brazil Energy              Others
                             Energy
         China                                                                                                                  Brazil Materials
                                                                                       Brazil CS        Brazil Others                                     Mexico CS
        Telecom    China CS          Twn. Financials                                                                                      SA Telecom                     Indonesia
     China Fin. ex China CD                  Twn. Mater.                                 Korea                                 SA           SA CD
                               Twn. Others                                                                    Chile
        banks      China Ind.                                                           Materials                           Financials                      Russia      Philippines
                                                Korea
                 China Mater. India Energy                                                                                                 SA Others        Energy
                                              Financials                                          Korea IT                 SA Materials
                     India
     China Banks               India Others                                                                                                                              Malaysia
                  Financials                    Korea                                                                Turkey Fin.                            Russia
                                                                                       Korea CD         Korea Others                          CE3
                                       India IT                    Industrials                                       Turk. Others                           Others

    Source: J.P. Morgan Strategy.
    Note: Red Indicates UW, green OW and white Neutral. Smaller markets with weights < 0.5% of MSCI EM are not included.
    Area of the sector indicates weight in MSCI EM.

                                                                                      Overweight                             Underweight

     Asia Pacific ex-Japan Equity Strategy Heat Map
                                                                Korea Others                                                              HK Indust.
     Australia CS                                                                                Korea IT
                                                                                                                                           HK CD             HK
                                                                                                                                                                        Malaysia
     Aus. Indus                                                    Korea CD             Korea                                             HK Utilities    Financials
                              Australia Financials
       Australia                                                                      Financials             Taiwan         Taiwan IT
        Energy                                                      Korea               Korea              Financials                                        India
                                                                   Materials          Industrials           Taiwan                        India Others    Financials    Indonesia
        Australia
                                                                  China mat. China CS                      Materials                                     India Energy
         Others
                                                                  China CD China Indus.                                    Taiw. Others India IT
                                             China Banks                                                    China                                         Singapore      Thailand
                                                                  China Fin.  China                                                     Sing. Others
           Australia Materials                                                                              Energy         China Others                   Financials
                                                                  Ex banks   Telecom                                                    Sing. Indus                     Philippines
    Source: J.P. Morgan Strategy, MSCI, Datastream.
    Note: Red Indicates UW, green OW and white Neutral. Area of the sector indicates weight in MSCI APxJ.

                                                                                                       3
4


Countries
Sunil GargAC
                                                                                                                                                                 (852) 2800-8518
                                                                                                                                                      sunil.garg@jpmorgan.com

China
                                                                                                                                      J.P. Morgan Securities (Asia Pacific) Limited


 Valuation comps for our highest-conviction recommendations

                                                                            Mkt cap Rating Price             PT     P/E (x)      P/BV (x)        ROE (%)             DY (%)
  Company                                             BB               CMP (US$MM)         target       End date FY12E FY13E   FY12E FY13E     FY12E FY13E         FY12E FY13E
Top Picks
21Vianet Group Inc.                                  VNET US            12      409   OW    16.3    31-Dec-13 142.8     88.1    8.5     7.9       5.6       9.3       0.0       0.0
Baidu.com                                            BIDU US          111    30,182   OW    200     31-Dec-13 24.0      17.8    9.4     6.0      48.6      41.3       0.0       0.0
Beijing Capital International Airport                694 HK           5.26    1,275   OW     8.3    31-Dec-12 13.3      10.8    1.2     1.1       9.3      10.5       1.1       1.4
Beijing Enterprises                                  392 HK           49.1    7,205   OW      60    30-Jun-13 18.3      13.7    1.2     1.1       6.6       8.2       1.6       2.2
China Shenhua Energy - H                             1088 HK          31.3   13,722   OW      35    30-Jun-13 11.2      10.3    2.0     1.8      19.0      18.3       3.4       3.7
China Shipping Container Lines                       2866 HK          1.81      876   OW    2.85    31-Dec-13 -68.3     24.0    0.7     0.7      -1.0       2.7       0.0       0.0
China State Construction                             3311 HK          8.92    4,473   OW      13    31-Dec-13 15.2      11.0    3.1     2.6      21.5      26.1       1.9       2.7
China ZhengTong Auto                                 1728 HK          4.85    1,382   OW     5.5    30-Jun-13 13.4      10.5    1.2     1.1       9.8      11.1                 1.0
Country Garden                                       2007 HK          2.95    6,937   OW    3.55    30-Jun-13   7.5      6.6    1.2     1.0      17.4      16.7       5.2       5.9
Galaxy                                               27 HK              25   13,520   OW      31    31-Dec-12 14.8      12.7    4.9     3.6      39.9      32.8       0.0       0.0
Golden Eagle Retail                                  3308 HK          16.2    4,034   OW    19.5    30-Jun-13 20.7      18.2    4.9     4.4      25.4      25.4       2.4       2.7
ICBC - H                                             1398 HK          4.96   55,531   OW     5.8    31-Dec-12   6.3      6.4    1.3     1.1      21.3      18.3       5.1       5.0
Lenovo                                               992 HK           6.16    8,170   OW     8.1    31-Mar-13 17.0      13.9    3.1     3.5      22.1      25.8       2.3       3.1
Ping An Insurance Group - H                          2318 HK            61   24,627   OW      65    31-Dec-12 15.9      13.1    2.6     2.2      17.5      18.2       0.9       1.0
Sinopec Corp - H                                     386 HK           7.82   16,927   OW       9    31-Dec-12   7.6      6.9    1.0     0.9      14.6      14.4       3.1       3.4
The United Laboratories                              3933 HK          4.05      850   OW     4.5    31-Dec-12 21.3      12.0    1.2     1.2       5.6       9.9       1.7       3.2
Stocks to Avoid
Anta Sports Products Ltd.                            2020 HK          6.78 2,180      UW     3.6    30-Jun-13    9.5    14.2    2.0     1.9      21.9      13.9       6.5       4.3
Aluminum Corporation of China - H                    2600 HK          3.34 1,699      UW     2.7    30-Jun-13   -7.4   139.1    0.8     0.8      -9.3       0.6       0.0       0.0
China Merchants Holdings Int'l                       144 HK           23.6 7,579      UW      20    31-Dec-12   13.2    12.7    1.3     1.2       9.9       9.9       3.3       3.4
Glorious Property                                    845 HK           1.14 1,146      UW       1    31-Dec-12    5.2     5.3    0.4     0.4       8.0       7.4       0.0       0.0
New China Life Insurance Company Ltd - A             601336 CH          23 7,591      UW      25    31-Dec-12   23.4    15.3    2.1     1.8       9.3      12.7       1.8       0.7
PetroChina                                           857 HK           10.4 28,251     UW    8.75    31-Dec-12   10.2     9.9    1.4     1.3      14.6      13.9       4.4       4.6
Source: J.P. Morgan estimates, Bloomberg. Pricing date is 12 October 2012.


                                                                                                    5
Adrian MowatAC
                                                                                                                                                 (852) 2800-8599
                                                                                                                                   Adrian.mowat@jpmorgan.com

Hong Kong
                                                                                                                      J.P. Morgan Securities (Asia Pacific) Limited


  Overall market view: We stay cautious and expect a                  Hong Kong – Hang Seng Index12M-fwd P/E
    range-bound market in 2H12. Outlook for the economy
                                                                            x
    remains poor, with 2012 GDP growth forecast low at                 30
                                                                                                                                            Current=9.2x
    1.9% by JPMe. We think inflation is likely to fall further
                                                                       25
    on the back of the lower import prices and slower pace                                   +2 std dev
    of Rmb appreciation. Market is de-rating on poor                   20
    fundamentals, trading at 12m P/E of 9.2x.                                              +1 std dev

                                                                       15              long term avg=13.5x
  Sector calls: Focus on residential among properties,
    as we think current prices have factored in potential              10
    downside. We maintain our positions in casinos                                                      -1 std dev
    although we expect near-term pressure. Prefer                       5
                                                                            85 86 87 88 89 90 91 92 93 94 95 96 97 98 99 00 01 02 03 04 05 06 07 08 09 10 11 12
    Insurance over Banks; UW on utilities.
                                                                       Source: Bloomberg, J.P. Morgan.
  Drivers/catalysts/events: 1) China policy easing on
    soft economic data, 2) declining inflation rate, 3)       Stock views
    Recovery of property transactions, slower land sales,
    diminishing policy risk and record low mortgage rates                                                                                            P/E (x)
                                                                                                          BB Code    Rating       Price        PT FY12E FY13E
    are positive for the property sector, 4) expect new
                                                          Top Picks
    launch (Cotai Central II) in Macau in 3Q12.
                                                                 AIA                                      1299 HK    OW           29.25         31         19.2   15.5
  Key issues / risks: 1) Global economic uncertainty,           BOCHK                                    2388 HK    OW             24.1        27         12.6   12.9
    2) trade sector supply and demand can incrementally          Cheung Kong                              1 HK       OW           113.2       120          11.6   11.5
    swing both ways, 3) central office demand is under           Galaxy                                   27 HK      OW             25         31          14.8   12.7
    pressure as financial companies are downsizing and           Lifestyle                                1212 HK    OW           17.02        19          15.3   14.2
    relocating.                                                  Pacific Basin Shipping                   2343 HK    OW            3.88        4.5         -4.4   30.5
                                                                 Power Assets                             6 HK       OW           66.55        70          14.2   13.7
  View relative to region: Underweight.
                                                                 Source: Bloomberg, J.P. Morgan estimates.
                                                                 Note: Share prices and valuations are as of October 12, 2012.


                                                                        6
Bharat IyerAC
                                                                                                                                              (91-22) 6157-3600
                                                                                                                                   bharat.x.iyer@jpmorgan.com
                                                                                                                              J.P. Morgan India Private Limited
India

  At a 12-13x one-year forward P/E, Indian equities are             MSCI India – 12 M forward P/E trend
    trading at the lower end of the last decade’s trading
    range.

  But the economy’s potential growth rate has deteriorated
    markedly over the past two years.

  In the absence of structural reforms to address growth
    constraints, markets could remain cheap.

  Over the interim, investors may have to contend with
    market returns in line with earnings growth (estimated at
    about 10-12% over FY12-14E).

  Political window of opportunity to address policy
    concerns over the next two quarters.                         Source: MSCI, Bloomberg, IBES

  Portfolio Stance                                               Top Picks and Avoids
    Overweight private sector banks on expected policy
     stimuli.                                                                                                                                     P/E (x)
    Underweight consumption as rural growth momentum                                               BB Code        Rating       Price       PT FY12E FY13E
     moderates.                                                 Top Picks
    Stock-specific approach for global sectors, given the      ICICI Bank                          ICICIBC IN    OW         1044.75       1025    19.3      15.6
     uncertain environment.                                     TATA Consultancy Services           TCS IN        N          1298.45       1400    23.9      18.4
  Key risks                                                    IDFC                                IDFC IN       OW           151.05      150     14.6      13.0
    A sustained rise in global crude oil prices                Power Grid Corporation of India     PWGR IN       OW           119.95      120     18.4      15.3

    Policy environment remains directionless                   ITC                                 ITC IN        OW            283.5      260     33.9      29.1
                                                                Avoids
  We have an overweight rating on India in an Asia and         Jubilant Foodworks Ltd              JUBI IN       UW           1364.8      995     82.3      56.6
    Emerging Markets context.                                   Adani Power                         ADANI IN      UW            50.45       31 -291.3 -4086.5
                                                                Bank of India                       BOI IN        UW           301.95      250      6.5       6.9
                                                                Source: Bloomberg, J.P. Morgan estimates, prices as of October 12, 2012.

                                                                 7
Aditya Srinath, CFAAC
                                                                                                                                   (62-21) 5291-8573
                                                                                                                     aditya.s.srinath@jpmorgan.com
                                                                                                                 PT J.P. Morgan Securities Indonesia

Indonesia
                                                               MSCI Indonesia: 12M Forward P/E Abs & and Rel to MSCI APxJ
 J.P. Morgan weighting: Neutral – Relative to MSCI
   EM/APxJ

 Indonesia has reversed early year underperformance of
   Asia ex-Japan & EM

 Rotation to the fore until clarity on earnings emerges

 Investment positives

       Valuation pressures being deflated

       Oil declining – inflation risks contained

       Domestic growth to be relatively resilient
                                                               Source: MSCI, Bloomberg,

 Investment negatives

       Policy hazards                                         Key stocks
                                                                                                                                           P/E (x)
       The rupiah                                                                          BB Code        Rating Price              PT FY12E FY13E

       Risks to demand from commodity prices              Top Picks
                                                           Bank Rakyat Indonesia            BBRI IJ        OW          7500      8200     10.8     8.6
 Sector weightings: Banks OW, Industrials OW, Materials   Indocement                       INTP IJ        OW        21000      23000     17.8    15.3
   OW, Consumer Staples N & Utilities OW, Consumer Disc.   Perusahaan Gas Negara            PGAS IJ        OW          4375      4100     15.3    14.1
   UW, Energy UW, Telcos N                                 Avoids
                                                           United Tractors                  UNTR IJ        UW        19900      18000     12.9    11.6
 Off Index OW –Property (SMRA)
                                                           Indika Energy                    INDY IJ        N           1550      2000      0.0     0.0
 Reinstated BBRI as top pick along with INTP, PGAS
                                                           Source: Bloomberg, J.P. Morgan estimates, prices as of 12 October 2012.
 Avoids: UNTR, INDY


                                                           8
Hoy Kit MakAC
                                                                                                                                       (60-3) 2270-4728
                                                                                                                            hoykit.mak@jpmorgan.com

Malaysia                                                                                                        JPMorgan Securities (Malaysia) Sdn. Bhd.
                                                                                                                                               (18146-X)


  Malaysia’s defensiveness stands out amidst                   KLCI performance during 12th GE (2008)
    global uncertainties. Combination of large
                                                                 1550
    domestic funds presence and resilient
    economy/earnings drove MSCI Malaysia                         1450                                    -4%
    valuations to a 29% premium to APxJ (historical
    average of 13%).                                             1350                                               -5%
                                                                                                   -9%
                                                                                                                              -5%
  Key market driver/risk is the upcoming general                1250
    elections, not due until Apr 2013. Sept/Oct are
                                                                 1150
    probable/final windows to hold elections. Pullback
    (close to 10%) highly likely regardless, when                1050
    parliament is dissolved, as per 2008 outcome. We                Jan-08              Feb-08             Mar-08                 Apr-08           May-08

    are uncomfortable with the market’s 2012 P/E of          Source: CEIC. Bloomberg.
    16.5x, against a historical average of 15x,
    suggesting event risk is not priced in.
                                                             Stock views: Key top picks and avoids
  Tactical pre-elections call: We recommend that
                                                                                                                                                     P/E (x)
    investors stick with apolitical stocks with earnings
                                                                                         BB Code Rating                   Price            PT     FY12E FY13E
    growth prospects - AirAsia, Axiata, Sime Darby,
                                                           OW
    Dialog, and KPJ Healthcare.
                                                           AirAsia                      AIRA MK        OW                  3.05               4      5.5     14.1
  Post elections drivers: 1) Political stability =        Sime Darby                   SIME MK        OW                  9.72            11.3     13.9     13.0
    policy continuity (ETP gaining traction). 2) Strong    Dialog                       DLG MK         OW                  2.39             2.8     31.5     28.0
                                                           KPJ Healthcare               KPJ MK         OW                  6.13             6.6     23.6     19.2
    domestic-driven demand (on robust fixed capital
                                                           Axiata                       AXIATA MK      OW                  6.47             5.6     17.3     15.4
    formation) offsetting external demand drag. 3)         Avoids
    Improving earnings momentum. 4) Consensus              Hong Leong                   HLBK MK        UW                 13.92            11.5     13.9     14.9
    UW with EM funds 2.5% weight vs. neutral weight        British American Tobacco     ROTH MK        UW                 61.04            50.2     21.6     20.8
    of 3.7%; locals all cashed up. Rising free float       IOI Corporation              IOI MK         UW                  5.03             4.6     18.1     16.7
    positive.                                              Source: Bloomberg, J.P. Morgan estimates. Note: Share prices and valuations are as of 12 October 2012.

  Key risks: 1) BN loses even a simple majority. 2)
    Sharper-than-expected external sector slowdown.
                                                                 9
James R. Sullivan, CFAAC
                                                                                                                                                                 (65) 6882-2374
                                                                                                                                                james.r.sullivan@jpmorgan.com

Singapore
                                                                                                                                 J.P. Morgan Securities Singapore Private Limited


                                                                             Summary of market correlations across sectors
  Market to head lower? Singapore macro actuals have                                 1.00
   begun to miss estimates for the first time since Summer
   2011 (GDP, IP recently; Retail sales have been missing for                         0.90                        Difficult period for Fundamental stock picking,
   some time). 2) More importantly, the trend of actuals is now                                   stock specifics countered by high cross sector correlations - all trade as one
                                                                                      0.80
   below the trend of revisions, i.e., additional negative
   revisions are likely. Per the chart on the right below, the                        0.70
   market has now traded higher despite this revision risk. 3)
   Singapore market earnings revisions turned negative in mid-                        0.60
   August. 4) Technicals have now turned cautious, versus
                                                                                      0.50                       Positive period for fundamental stock picking
   their very bullish stance previously.
  Mitigating Factors: 1) EASI has moved into positive                                0.40
   territory, the median 6 -month return for the Singapore
                                                                                      0.30
   market post a move into positive territory is 10%. 2)
   Singapore inflation moderating (although this could actually                       0.20
   strengthen the slowdown argument). 3) Great stock-picking                             Feb-11         May-11        Aug-11       Nov-11        Feb-12       May-12        Aug-12
   environment, as cross-sector correlations are extremely low.              Source: J.P. Morgan estimates, Bloomberg
  Stock picks: Own outward-looking Singapore (NOL, SIA,
   KEP), avoid anything inward-looking save inflating assets                 Stock views
   (CAPL).
                                                                                                                                                                              P/E (x)
 Market (blue) rising while likely revisions (red) falling                                                                      BB Code        Rating Price             PT CY12E CY13E
 (sustainable)?                                                              Top Picks
  12                                                                  1800
                                                                             Neptune Orient Lines                              NOL SP         OW              1.1      1.35        467.5   18.5
  10
   8                                                                  1700   Singapore Airlines                                SIA SP         OW          10.47          13         26.9   18.3
   6
   4
                                                                      1600   Keppel Corporation                                KEP SP         OW          11.21        13.3         11.3   13.2
   2                                                              ?   1500   CapitaLand                                        CAPL SP        OW            3.16        3.4         13.5   11.7
   0
  ‐2                                                                  1400
                                                                             Avoids
  ‐4                                                                         China Minzhong Food Limited                       MINZ SP        UW          0.835         0.7          3.5    3.4
  ‐6                                                                  1300
                                                                             Source: Bloomberg, J.P. Morgan estimates.
                                                                             Note: Share prices and valuations are as of October 12, 2012.


                       IP Actual trend ‐ Forecast Trend    MXSG


 Source: J.P. Morgan estimates, Bloomberg.
                                                                             10
Scott YH SeoAC
                                                                                                                                                     (82-2) 758 5759
                                                                                                                                           scott.seo@jpmorgan.com
South Korea                                                                                                      J.P. Morgan Securities (Far East) Ltd, Seoul Branch


 Overall market view – Entering 2Q12 earnings          Korea – MSCI Korea 12M-fwd P/BV
                                                        x
   season, we recommend that investors focus
                                                            2.0
   more on the companies’ LT fundamentals                   1.8
   instead of short-term earnings volatility. Given         1.6
   undemanding market valuations (i.e., below -1            1.4

   STD of the historical average P/BV and P/E), we          1.2
                                                            1.0
   expect to see a ST rebound when the macro
                                                            0.8
   environment turns favorable (i.e., QE 3, China           0.6
   government’s economic boosting measures).                   Jan-05    Oct-05   Jul-06   Apr-07   Jan-08   Oct-08   Jul-09   Apr-10      Jan-11   Oct-11     Jul-1
                                                                          MSCI KOREA - 12MTH FWD P/BPS           Average        +1 stdev            -1 stdev
 Sector calls – In a recovery phase, we expect         Source: Datastream.
   IT and autos to continue to outperform the
                                                        Korea – Top picks/avoids
   market. Moving toward 2H12, we expect easing
                                                                                                                                                                  P/E (x)      P/B (x)
   regulatory pressure and probable boosting                                                          BB Code Rating                    Price            PT       FY12E        FY12E
   measures for domestic consumption to be a            Top picks
   catalyst for domestics.                              Doosan Heavy Industries                       034020 KS       OW            54100           71000              11.01     0.93
                                                        Kia Motors
                                                                                                      000270 KS       OW            68200 100000                        6.04     1.55
 Potential drivers/catalysts/events: 1)
                                                        Mando                                         060980 KS       OW           148500 220000                       10.27     1.64
   headline inflation managed within the BoK’s
   inflation target (3±1%), 2) more stable KRW          Lotte Shopping                                023530 KS       OW           340000 388000                       10.28     0.56
                                                        Orion
   movement (KRW to be less volatile than during                                                      001800 KS       OW         1018000 1020000                       34.39     5.16
                                                        Samsung Electronics
   GFC, in our view), 3) easing regulatory                                                            005930 KS       OW         1296000 1800000                        9.64     1.82
                                                        Samsung Life Insurance
   pressure, and 4) gradual recovery in residential                                                   032830 KS       OW            94900 140000                       18.06     0.98
   property market.                                     Shinhan Financial Group                       055550 KS       OW            37250           50000               6.77     0.81
                                                        Stocks to avoid
 Key issues / risks: Korea market is particularly      Honam Petrochem                               011170 KS       UW           240500 180000                        0.01     1.45
   vulnerable to macro volatilities due to its highly   S-Oil                                         010950 KS       UW            99600           70000              11.11     1.94
   cyclical/export-focused industry structure. For
   domestics, regulatory direction ahead of the         Source: Bloomberg, J.P. Morgan estimates. Note: Share prices and valuations are as of October 12, 2012.
   presidential election (Dec-12) should be a key
   concern.
                                                                        11
Nick LaiAC
                                                                                                                                                            (886-2) 2725-9864
                                                                                                                                                    nick.yc.lai@jpmorgan.com
Taiwan                                                                                                                                 J.P. Morgan Securities (Taiwan) Limited


 Sector calls
                                                                                          2012 YTD relative share price performance by sector
        Overweight: Tech (we prefer foundry, backend, NB
            ODM and avoid DRAM and display).                                             30%
                                                                                         20%
        Underweight: Consumer/discretionary, and Materials
                                                                                         10%
            (we are selective on SMCap stocks).
                                                                                           0%
        Neutral: Telco, Financials (we prefer banks over                                -10%
            brokers and insurance).                                                      -20%
                                                                                         -30%
 Market view


                                                                                                    Transportation
                                                                                                 Elec. Distribution


                                                                                                 Plastic&Chemical
                                                                                                  Elec&Machinery
                                                                                                         Computer


                                                                                                          Chemical
                                                                                                     Components


                                                                                                       Info service


                                                                                                 Glass&Porcelain
                                                                                                  Communication
                                                                                                     Construction

                                                                                                            Biotech


                                                                                                           Textiles
                                                                                                         Machinery


                                                                                                           Cement


                                                                                                 Elec. Appliances


                                                                                                            Depart.
                                                                                                        Electronics
                                                                                                              Food


                                                                                                              Steel
                                                                                                               Auto


                                                                                                          Semicon
                                                                                                       Other elect.


                                                                                                         Financials
                                                                                                           Tourism


                                                                                                            Energy
                                                                                                            Rubber


                                                                                                            Plastic
                                                                                                         Opto elec.
                                                                                                            Others


                                                                                                             Paper
        J.P. Morgan is neutral on Taiwan in its regional
            portfolio; we foresee the market trading sideways or
            being range-bound at~7,000-7,600 in 2H12. Macro
            developments will be key to sentiment and
                                                                                         Source: Bloomberg, *Performance is based on the closing price on 25th June 2012
            performance, especially in tech .


 Top Five Large-Cap Picks
                             BB Code      Rating       Price      Mkt Cap      P/E (x)                P/BV (x)                  ROE (%)              DY (%)
                                                                 (US$ MM)   FY12E      FY13E        FY12E      FY13E          FY12E     FY13E          FY12E
 TSMC                        2330 TT      OW            86.3       76,380    14.2         13.0          3.1          2.8        23.3         22.6          3.5
 ASE                         2311 TT      OW           21.95        5,691    11.0          8.4          1.3          1.2        12.4         14.9          3.0
 Quanta Computer             2382 TT      OW            69.3        9,101     9.8          8.0          2.0          1.8        21.7         23.6          6.2
 Far EasTone Telecom         4904 TT      OW            74.2        8,257    21.2         17.3          3.2          3.2        15.5         18.6          5.2
 Chinatrust                  2891 TT      OW            16.8        7,124    10.8         10.2          1.2          1.2        11.4         11.7          3.8
 Source: Bloomberg, J.P. Morgan estimates.
 Note: Share prices and valuations are as of October 12, 2012.


                                                                                    12
Sriyan PieterszAC
                                                                                                                                                                   (662) 684 2670

Thailand                                                                                                                                           sriyan.pietersz@jpmorgan.com
                                                                                                                                            JPMorgan Securities (Thailand) Limited
                                                                                                       Thailand 12M fwd P/E
                                                                                                         x             Current 12-month forward P/E (SET Index) = 11.8x
   We believe Thai equities will provide another half year of                                          20
    outperformance, given their ability to orient toward both domestic                                  18                                                         +2 stdev = 16.3x
                                                                                                        16
    themes and global growth re-acceleration.                                                                                                                    +1 stdev = 13.6x
                                                                                                        14
                                                                                                        12
   Key drivers: (+) domestic growth outlook, (+) positive earnings                                     10
                                                                                                                                                                 Average = 10.8x

    revisions on Financials, (-) external growth/risk aversion, (+)                                      8                                                          -1 stdev = 8.1x

    accommodative policy, (+) sustained investment cycle; (-) politics                                   6
                                                                                                                                                                    -2 stdev = 5.4x
                                                                                                         4
    and policy risk factors.                                                                                 02 03 04 05 06 07 08 09 10 11 12
                                                                                                         Source: J.P. Morgan estimates and calculations.
   Potential catalysts: monthly bank loan growth data, 2H12 earnings
    upgrades, political developments, global growth data.                                              JPMQ Global Revisions Landscape
                                                                                                                                                      As At 21-Aug-2012

   Valuations are back at 10-year average P/E.                                                                     Region
                                                                                                                                      Net Revs
                                                                                                                                        FY2
                                                                                                                                                     Net Revs
                                                                                                                                                       FY1
                                                                                                                                                                 EMOM
                                                                                                                                                                3MTHFY1
                                                                                                                                                                                EMOM
                                                                                                                                                                               3MTHFY2
                                                                                                       MSCI All World                        -21%         -14%         -3%            -3%
   Key issues/risks: 1) significant acceleration in inflation; 2) political                           ASIAPAC Ex JP                         -28%         -26%         -4%            -4%
    risk; 3) cash calls.                                                                               ASIAPAC                               -29%         -27%         -4%            -3%
                                                                                                       China                                 -47%         -47%         -4%            -5%
   Sector weightings: We are overweight on Banks and Property,                                        Hong Kong                             -26%          9%          -2%            -3%
                                                                                                       Korea                                 -31%         -42%         -6%            -3%
    neutral on Materials (Petrochemicals), and underweight on                                          Malaysia                               -6%         -5%          -1%            0%
    Telecoms, Consumer and Energy.                                                                     Singapore                             -20%         -8%           2%            -2%
                                                                                                       Taiw an                               -45%         -44%         -8%            -7%
   Top picks are KBANK, SCB, SCC, LH, IVL, and BTS.                                                   Indonesia                              5%          -2%          -2%            -2%
                                                                                                       Philipines                            33%          19%           0%            0%
                                                                                                       Thailand                              -18%         -22%         -3%            -3%

                                                                                                        Source: J.P. Morgan

                                                                                                             Mkt   P/E (x)    P/B (x)     Yield (%)
 Stock picks                                          BB Code             Rating   Price         PT Cap (US$MM) FY12E FY13E FY12E FY13E FY12E FY13E
Top picks
Kasikornbank                                          KBANK TB            OW         180         220         14,028          12.4    10.7           2.4      2.0         2.0           2.2
Siam Commercial Bank                                  SCB TB              OW       168.5         200         18,620          13.5    11.4           2.6      2.2         2.5           2.9
Siam Cement                                           SCC TB              OW         357         400         13,945          16.3    14.7           2.8      2.5         3.1           3.4
Land & Houses                                         LH TB               OW          8.6          9          2,820          17.2    17.4           2.9      2.8         5.0           4.9
Indorama Ventures                                     IVL TB              OW        27.5          41          4,329          11.8     7.4           1.8      1.5         2.5           4.1
BTS Group Holdings                                    BTS TB              OW        5.75         7.6          1,865          26.5    39.6           1.5      1.3         5.2           1.9
Tisco Financial Group                                 TISCO TB            N         45.5          49          1,078           8.8     7.9           1.8      1.6         4.9           5.5
Stocks to avoids
Thai Oil                                              TOP TB          UW           64.25          53           4,286         13.8    14.0           1.6      1.5         5.2           5.3
Big C Supercenter                                     BIGC TB         UW           192.5         190           5,193         25.4    21.2           4.9      4.2         1.2           1.4
Source: Bloomberg, J.P. Morgan estimates, prices as of 12 October 2012.                     13
14


 Sectors
Ebru Sener KurumluAC
                                                                                                                                           (852) 2800-8521
                                                                                                                               ebru.sener@jpmorgan.com
                                                                                                                J.P. Morgan Securities (Asia Pacific) Limited

Consumer
  2013 outlook. We are of the view that a                Comparison of Chinese sportswear retailers' and other retailers' SSSG

   significant recovery in discretionary sales in             20.0%
                                                              18.0%
   2013 is unlikely, so get ready to embrace longer-          16.0%
                                                              14.0%
   term single-digit or low-double digit SSSG in the          12.0%
                                                                                                                                  10.6%

   space.                                                     10.0%                                     10.0%
                                                               8.0%                                                                                      0.0%
                                                               6.0%             4.8%
  Recent update: Retailers indicate a lackluster              4.0%                                                               7.8%                   7.8%
                                                                                                         5.5%
   3Q so far, and we believe 3Q SSSG is likely to              2.0%             3.8%
                                                               0.0%
   come in slightly below 2Q’s. We rebase our                                   2009                     2010                     2011                   1H12

   2013 estimates and cut our 2013 earnings                                                                 Volume     Pricing

   estimates for retailers by 5% on average.                   Source: J.P. Morgan estimates, Company data. Includes data from Parkson, Golden Eagle, Belle, Trinity,
                                                               Daphne, and Ports Design.


  Top Picks: We remain positive on select                    Stock views
   retailers from a long-term perspective but do not                                                                                                        P/E (x)
   expect an immediate re-rating catalyst to arrive                                      BB Code             Rating              Price          PT      FY12E           FY13E
   in 2012 in the form of a strong SSSG pick-up.              OW
                                                              Golden Eagle               3308 HK            OW                   16.18         19.5         20.7         18.2
   Among retailers, Golden Eagle and Trinity are              Trinity                    891 HK             OW                    5.19          6.5         16.6         14.6
   our top picks, but with a longer-term focus as 2H          Chow Tai Fook              1929 HK            OW                    9.89          12          15.6         14.0
                                                              China Foods                506 HK             OW                    8.34          9.2         23.6         19.0
   is likely to be lackluster. We also like CTF, Sa Sa        China Mengniu              2319 HK            OW                   22.55          28          20.0         16.0
   and Giordano. Among staples we have OW on                  UW
                                                              Hengan                     1044 HK            UW                    73.8          61          25.3         21.1
   China Foods and Mengniu on the back of                     China Yurun                1068 HK            UW                    5.74          4.6         20.7          8.7
   product mix upgrades.                                      Tsingtao – A               600600 CH          UW                   33.12          26          24.1         20.7
                                                              Tsingtao Brewery - H       168 HK             UW                   44.55          32          26.3         22.7
                                                              Parkson                    3368 HK            UW                    6.85          5.6         14.6         13.4
                                                              Anta                       2020 HK            UW                    6.78          3.6          9.5         14.2
                                                              Li Ning                    2331 HK            UW                    4.83          3.3        -71.5         16.7
                                                              Xtep                       1368 HK            UW                    3.19          2.2          6.4          9.5

                                                              Source: Company data, J.P. Morgan estimates. Prices are as of October 12, 2012
                                                         15
Brynjar Eirik Bustnes, CFAAC
                                                                                                                                                    (852) 2800-8578

Energy                                                                                                                             brynjar.e.bustnes@jpmorgan.com
                                                                                                                         J.P. Morgan Securities (Asia Pacific) Limited

    We believe risk to demand is now greater than supply risk
     with EU/US economic issues to be resolved. Political risk to    China, India, Japan, US and EU5 demand weakening (kBOPD)
     oil supply has subsided with the “worst” case now in the
     market. Resolution in Libya brought on light crude, pushing
     down oil prices and refining margins. Iran is the main wild
     card, threatening supply cuts or suffering EU sanctions. We
     believe lost crude from Syria, Yemen and Sudan is also
     priced in, partially offset by US liquids.
    Supplies from Saudi remain high, making up for less Iranian
     crude. Iraqi production is also increasing, along with North                                                                          Y/Y change

     Sea. Angola should ramp up with Canadian oil sands and           GRM strong last year on Libya/Japan EQ
     shale oil in the US at least adding to mid US supplies.
                                                                     90%                                                                                                               10
     Overall demand growth in Asia is trending down, with OECD
                                                                     88%                                                                                                               8
     in general not growing al all. China doesn’t need diesel
                                                                     86%                                                                                                               6
     imports (power trouble not happening) and coming out of         84%                                                                                                               4
     maintenance and adding new capacity (1.0 mn BOPD in             82%                                                                                                               2
     2012 along with India) should add more products in the          80%                                                                                                               0


                                                                            2001

                                                                                   2002

                                                                                          2003

                                                                                                 2004

                                                                                                        2005

                                                                                                                  2006

                                                                                                                         2007

                                                                                                                                   2008

                                                                                                                                          2009

                                                                                                                                                   2010

                                                                                                                                                          2011 E

                                                                                                                                                                    2012 E

                                                                                                                                                                              2013 E
     regional export market.
                                                                                                        Utilization             GRM (US$/bbl - RHS)
    Based on the above, we see flat to weaker oil prices and
     weaker refining margins in 2012. Petrochemicals has been        Source: J.P. Morgan estimates, Bloomberg, PAJ
     badly hit by Chinese tightening and is unlikely to rebound      Stock views
     until 1H2013 at the earliest .                                                                                                                                     P/E (x)
                                                                                                               BB Code           Rating          Price             PT FY11A FY12E
    We think Sinopec offers the best value. China BlueChem is
                                                                     OW
     also not overpriced, in our view, while small-cap MIE offers
                                                                     PTT Public Company                        PTT TB            OW            315    430                     8.5       9.0
     good value along with Inpex – but are asset plays. We think
                                                                     Inpex Corporation                         1605 JT           OW         466500 750000                    10.5      10.6
     SK Inno is the cheapest refiner in the region, but diesel
                                                                     Sinopec Corp - H                          386 HK            OW           7.82      9                     7.6       7.6
     spread reversal could be a negative for SKI as well.
                                                                     China Oilfield Services Limited           2883 HK           OW          14.28     13                    13.0      11.0
    We see downside to CNOOC along with PetroChina due to           UW
     deteriorating fundamentals and valuations. We think S-Oil in    PetroChina                                857 HK            UW              10.38  8.75                 11.7      10.2
     Korea still prices in high expectations in both refining and    Reliance Industries Ltd                   RIL IN            UW              818.9   675                 12.7      13.6
     PX., while we think RIL has virtually no growth and trades at   CNOOC                                     883 HK            UW              15.88    13                  8.2       9.5
     a high valuation, and we see SK Innovation as fairly priced     S-Oil Corp                                010950 KS         UW              99600 70000                  9.6      11.1
     at the high end and more defensive in a falling-margin          Source: J.P. Morgan estimates, Bloomberg; Table priced as of October 12, 2012
     environment.                                                      16
Josh KlaczekAC
                                                                                                                                                             (852) 2800-8534
                                                                                                                                                josh.klaczek@jpmorgan.com

Financials
                                                                                                                                  J.P. Morgan Securities (Asia Pacific) Limited


 In 1Q, we saw loan growth begin to decelerate         Loan/Deposit Ratios: Large Increase Since 2008, Still Well <100%
   across the region, with weaker credit growth a
                                                                               20    19
   particular focus in China. For now, falling
   interbank rates & relatively conservative                                   15         14

   leverage gives us a more constructive view on                                               9


                                                          Chg since 2008 (%)
                                                                               10
                                                                                                    6
   asset quality – increasingly in China as well                                                         4
                                                                                5                             3      2       2
                                                                                                                                      0               -26
 Key country calls : OW on Philippines &                                       0
                                                                                                                                          -16   -19

   Thailand, turning positive on China banks; UW
                                                                                -5
   on Indonesia, Australia. Watch USD funding
   stress in ASEAN on external issues.                                         -10
                                                                                     TH   HK   SG   PH   ID   CH     MY      IN   TW      AU    US    KR
                                                                 Mar-12              95   68   88   65   82   68     77      73   84      128   81    102
 Reasons to be constructive: 1) inflation
                                                               Source: BIS
   falling, policymakers have more “bullets” than
   the West, 2) LDRs have risen but interbank
                                                        Stock views
   markets show no signs of panic/stress, 3)
                                                                                                                                                                   P/E (x)
   valuations are now 7-9x P/E across the region
                                                                                                                   BB Code Rating               Price        PT FY12E FY13E
 Key risks: Higher provisions are the most             Top Picks

   important risk to the region, although we think      Metropolitan Bank                                          MBT PM         OW            90.85       100    13.2   10.9
   more immediate downgrades are likely to result       China Minsheng Banking - H                                 1988 HK        N              6.65       7.25    5.1    5.5
   from NIM compression as policy-makers ease           HSBC Holdings plc                                          5 HK           OW             74.2        83    11.7    9.9
   liquidity & credit demand begins to wane.            Avoids
                                                        Sinopac Financial Holdings                                 2890 TT        N              11.6        10    12.3   12.3
 With credit quality being a continued focus, our      TMB Bank Public Company Limited                            TMB TB         UW             1.79        1.3   13.3   15.9
   portfolio remains anchored in positions in higher-   Bank Central Asia (BCA)                                    BBCA IJ        UW            8150        7000   18.3   14.9
   quality & defensive franchises – such as ICBC,
                                                        Source: Bloomberg, J.P. Morgan estimates.
   BOCHK, HSBC, HDFCB, SCB – as well as a mix           Note: Share prices and valuations are as of October 12, 2012.
   of “growth” stories like Minsheng & Yes Bank.


                                                                                     17
Kenneth Fong , CFAAC
                                                                                                                                                                         (852) 2800-8597
                                                                                                                                                         kenneth.kc.fong@jpmorgan.com

Gaming and Leisure
                                                                                                                                              J.P. Morgan Securities (Asia Pacific) Limited


                                                               Macau names rolling forward EBITDA multiple
  Key theme: The sector may see some near-term
    pressure on the back of a tougher comparison ahead            EV/EBITDA (x)
                                                                  16
    (especially in July and August) and elevated analyst          15
    expectations (Street’s revenue growth expectation for         14
    2012 is 20-25% vs. actual delivered 26% ytd). We              13
                                                                  12
    advise investors to lock in some profit now as we see         11
    opportunities for investors to gradually accumulate           10
                                                                   9
    over the next few months. We expect the sector to re-          8
    rate again in late 3Q, when a gradually improving              7


                                                                             Mar-10

                                                                                      May-10


                                                                                                                                     Mar-11

                                                                                                                                                  May-11


                                                                                                                                                                                                  Mar-12

                                                                                                                                                                                                           May-12
                                                                    Jan-10


                                                                                               Jul-10

                                                                                                          Sep-10

                                                                                                                   Nov-10

                                                                                                                            Jan-11


                                                                                                                                                           Jul-11

                                                                                                                                                                    Sep-11

                                                                                                                                                                              Nov-11

                                                                                                                                                                                       Jan-12
    China economy stimulates VIP headline revenue
    growth again and Sands Cotai Central phase II opens.
                                                                                                        1-yr Rolling forward EBITDA mutiple                                            Mean

  Key driver: We expect gaming revenue to grow 24%             Source: J.P. Morgan. Bloomberg consensus estimates

    in 2012 and 18% in 2013.
                                                             Stock views
  Key risk: Slower-than-expected China economic                                                                                                                                                              P/E (x)
    growth as Macau is a leveraged China internal                                                                     BB Code Rating                                Price                   PT             FY12E FY13E
    consumption play.                                        OW
                                                             Galaxy Entertainment Group                               27 HK                   OW                             25                  31                 14.8   12.7
  Stock picks: In the short term, we like SJM for its       MGM China Holdings Ltd                                   2282 HK                 OW                        13.4                    18.0                10.2   10.5
    defensiveness, in the medium term we like Galaxy for Sands China Ltd                                              1928 HK                 OW                     27.65                       30                 25.3   15.2
    earnings upgrades, and Sands China for its longer-
                                                         SJM Holdings Limited                                         880 HK                  OW                        16.5                     21                 12.9   10.9
    term mass market story.
                                                             Wynn Macau Ltd                                           1128 HK                 OW                        20.2                    25.8                15.5   13.4
                                                             Neutral
                                                             Melco International Development                          200 HK                  N                         6.75                     8.9                11.6   11.3
                                                             Source: Bloomberg, J.P. Morgan estimates. Priced as at 12 October 2012.


                                                                    18
Sean WuAC
                                                                                                                                                                              (852) 2800-8538
                                                                                                                                                                     sean.wu@jpmorgan.com

Healthcare
                                                                                                                                                   J.P. Morgan Securities (Asia Pacific) Limited


   Key investment points:
                                                           Low spending as a part of GDP means considerable room for
         The worst is likely over for the drug sector
                                                           growth
         Pricing pressure rising for medical
                                                           - Expected healthcare spending as % of GDP to go up to 10% by 2020E
          consumable but should be manageable
         Fundamentals of the healthcare industry stay      1,900.0
                                                                                                                             Healthcare Spending      % of GDP             Y/Y Growth
                                                                                                                                                                                                                                                                   1,980.0 35%


          strong - remain positive in the longer term       1,700.0
                                                                                                                                                                                                                                                             1,611.9
                                                                                                                                                                                                                                                                          30%


                                                            1,500.0                                                                                                                                                                                    1,453.5            25%


   Key drivers: 1) new healthcare reform                   1,300.0
                                                                                                                                                                                                                                                 1,157.4
                                                                                                                                                                                                                                                                          20%


                   12th
     initiatives, 2)   five-year plan fostering             1,100.0


                                                                                                                                                                                                                                 866.0
                                                                                                                                                                                                                                         984.3                            15%

                                                              900.0

     industry consolidation, and 3) potential                 700.0                                                                                                                                              658.4
                                                                                                                                                                                                                         759.0
                                                                                                                                                                                                                                                                          10%

                                                                                                                                                                                                         579.0

     corrections to Anhui EDL tendering                       500.0
                                                                                                                                                                         367.9
                                                                                                                                                                                 404.8
                                                                                                                                                                                         458.7
                                                                                                                                                                                                 502.6                                                                    5%

                                                                                                                                                                 319.7
                                                              300.0                                                                                                                                                                                                       0%
                                                                      1980 1981 1982 1983 1984 1985 1986 1987 1988 1989 1990 1991 1992 1993 1994 1995 1996 1997 1998 1999 2000 2001 2002 2003 2004 2005 2006 2007 2008 2009 2010


   Key issues / risks: 1) Further price cuts, 2)
                                                            Source: China Statistics Bureau.
     Adoption of DRG reimbursement, and 3)
     channel markup rule change

   OW on The United Laboratoeis – a high-beta
     play with commodity prices recovering.
                                                         Stock views
                                                                                                                                                                                                              P/E (x)
   OW on Sino Biopharm– the best and most                                                                        BB Code Rating                                     Price                               PT FY12E FY13E
                                                         OW
     balanced product portfolio and pipeline, in
                                                         Sino Biopharmaceutical                                  1177 HK                    OW                             2.91                          3.6                     19.5                      16.5
     our view
                                                         The United Laboratories                                 3933 HK                    OW                             4.05                          4.5                     21.3                      12.0
                                                         UW
   UW on China Shineway: 1) strong exposure
                                                         China Shineway                                          2877 HK                    UW                             10.9                          12                      10.1                            9.2
     to EDL; 2) adverse effects of TCM injections
                                                         Source: J.P. Morgan estimates. Prices are as of 12 October 2012


                                                         19
Karen Li, CFAAC
                                                                                                                                            (852) 2800-8589

Infrastructure                                                                                                                   karen.yy.li@jpmorgan.com
                                                                                                                 J.P. Morgan Securities (Asia Pacific) Limited


Investment thesis:                                       Key issues / risks:
 Infra capex: Key beneficiaries of increasing govn't     For infra operators in China, the key challenge is on the
   capex in China may be in two sectors: transport            margin front as cost inflation continues despite softening
   infra and social housing. We expect rail capex to          top-line volume growth (if any) and inability of tariff
   recover from end-2Q’12, to benefit names                   adjustments.
   including CRG, CRCC, CCCC, CSR, CSC, HOLI,             For E&C sector in Asia region, the key concern is
   IJM, WIKA.                                                 whether inflation would return to haunt, resulting in
 Machinery: Though valuation seems cheap, we                 sooner-than-expected ending of current stimulus
   remain concerned about cash flow and receivable            measures of policy easing.
   collection; hence Neutral on Zoomlion, Lonking
   and Sany Heavy.                                        Key calls: 
 Port operators have rebounded substantially                                                                                          P/E             Next Yr
   YTD. We like HPH Trust for yield and Adani
                                                         Company Name                  BB Code      Rating Price     PT FY2012E FY2013E EPS Y/Y
   Ports for growth.
                                                         Hutchinson Port Trust           HPHT SP    OW       0.79     1     25.3    21.0     7.1
 Tollroads, we believe, are defensive plays with        CMHI                             144 HK    UW       23.6    20     13.2    12.7  -21.1
   solid cash generation, healthy balance sheet and      CCCC                            1800 HK    OW       6.71    11      6.5     6.0     5.6
   decent yield. Operators are likely to benefit from    CRCC                            1186 HK    OW       7.49   8.5      8.6     7.3   11.4
   lifting of policy overhang at end-May as the sector   CRG                              390 HK    OW       3.68   4.1      8.8     7.9     8.0
   clean-up work comes to an end. Most Chinese           CSR Corp Ltd.                   1766 HK    OW       5.66   9.3     13.2    10.2     7.5
   names are good yield plays, in our view.              Hollysys Automation             HOLI US    OW     10.331    13     10.1     9.2   35.8
 Airports: Beijing Capital Airport's growth             Zhejiang Expressway              576 HK    OW       5.54   7.1     11.4    12.3    -4.9
   potential has been long overlooked while concerns     Beijing Capital Int'l Airport    694 HK    OW       5.26   8.3     13.3    10.8   25.1
   may be overblown on the construction of the 2nd       WCT                             WCT MK     OW       2.72   3.1     12.0    10.3   12.7
   airport in Beijing. We also believe MAHB looks        IJM Corporation                  IJM MK    OW       5.06   5.8     16.6    13.9   19.0
   interesting as KLIA II will be operational in         Wijaya Karya                    WIKA IJ    N       1330 1290       19.1    14.1   21.9
   2012/2013.                                            Samsung Engineering            028050 KS   OW    170000 260000     10.8     9.9   22.9
 Stock picks in China: BCIA, CSR, CCCC, CRG,            GS E&C                         006360 KS   N      70000 80000      10.0     9.5  -15.7
   CRCC Hollysys, Hutch Ports, Zhejiang Exy, and         Adani Ports                  ADSEZ IN OW             125.4       160        24.0       17.7       13.9
   selected machinery names. Outside China, our top      Source: Bloomberg, J.P. Morgan estimates.
   picks in the region include: IJM, Wijaya Karya,       Note: Share prices and valuations are as of October 12, 2012.
   Adani Ports, Samsung E&C and GS E&C.
                                                                   20
Jpm top country and sector ideas 121015

More Related Content

Viewers also liked

Tarea tutorial 2
Tarea tutorial 2Tarea tutorial 2
Tarea tutorial 2DALYN110776
 
qualcomm annual reports 1999
qualcomm annual reports 1999qualcomm annual reports 1999
qualcomm annual reports 1999finance43
 
Unit2 the body
Unit2 the bodyUnit2 the body
Unit2 the bodyHULSB
 
Erfolg Ausgabe 04/2010 vom 7.05.2010
Erfolg Ausgabe 04/2010 vom 7.05.2010Erfolg Ausgabe 04/2010 vom 7.05.2010
Erfolg Ausgabe 04/2010 vom 7.05.2010Netzwerk-Verlag
 
Beyond buzz the next generation of word-of-mouth marketing
Beyond buzz the next generation of word-of-mouth marketingBeyond buzz the next generation of word-of-mouth marketing
Beyond buzz the next generation of word-of-mouth marketingMegaTrends
 
Escucha la radio
Escucha la radioEscucha la radio
Escucha la radioRosyross
 
Foro3 G1 Documento Padres De Familia
Foro3 G1 Documento Padres De FamiliaForo3 G1 Documento Padres De Familia
Foro3 G1 Documento Padres De FamiliaMarco AP
 
Shakti Bhog's TV series with maximum viewership
Shakti Bhog's TV series with maximum viewershipShakti Bhog's TV series with maximum viewership
Shakti Bhog's TV series with maximum viewershipThe BharatPutra
 
Preparativos Para El Primer Dia De Guarderia
Preparativos Para El Primer Dia De Guarderia quaintenthusias03
 
Alice charles conference_the_potential_of_landbanking_28.04
Alice charles conference_the_potential_of_landbanking_28.04Alice charles conference_the_potential_of_landbanking_28.04
Alice charles conference_the_potential_of_landbanking_28.04Alice Charles
 
La transgresión del cretácico inferior en el margen andino (perú y ecuador) d...
La transgresión del cretácico inferior en el margen andino (perú y ecuador) d...La transgresión del cretácico inferior en el margen andino (perú y ecuador) d...
La transgresión del cretácico inferior en el margen andino (perú y ecuador) d...ChrisTian Romero
 
JDK Tools For Performance Diagnostics
JDK Tools For Performance DiagnosticsJDK Tools For Performance Diagnostics
JDK Tools For Performance DiagnosticsBaruch Sadogursky
 
20 consigli su come creare testi leggibili
20 consigli su come creare testi leggibili20 consigli su come creare testi leggibili
20 consigli su come creare testi leggibiliAlessandro Scuratti
 
7 holocausto farmaceútico-edu sanchez-orviz
7 holocausto farmaceútico-edu sanchez-orviz7 holocausto farmaceútico-edu sanchez-orviz
7 holocausto farmaceútico-edu sanchez-orvizRebeca Gil
 
Catalog led corn bulbs - enkonn
Catalog   led corn bulbs - enkonnCatalog   led corn bulbs - enkonn
Catalog led corn bulbs - enkonnsales enkonn
 
IstItuto Italiano dei Plastici - Sistemi di Gestione Energia
IstItuto Italiano dei Plastici - Sistemi di Gestione EnergiaIstItuto Italiano dei Plastici - Sistemi di Gestione Energia
IstItuto Italiano dei Plastici - Sistemi di Gestione EnergiaCTQ Spa
 

Viewers also liked (20)

Tarea tutorial 2
Tarea tutorial 2Tarea tutorial 2
Tarea tutorial 2
 
qualcomm annual reports 1999
qualcomm annual reports 1999qualcomm annual reports 1999
qualcomm annual reports 1999
 
Unit2 the body
Unit2 the bodyUnit2 the body
Unit2 the body
 
Erfolg Ausgabe 04/2010 vom 7.05.2010
Erfolg Ausgabe 04/2010 vom 7.05.2010Erfolg Ausgabe 04/2010 vom 7.05.2010
Erfolg Ausgabe 04/2010 vom 7.05.2010
 
Beyond buzz the next generation of word-of-mouth marketing
Beyond buzz the next generation of word-of-mouth marketingBeyond buzz the next generation of word-of-mouth marketing
Beyond buzz the next generation of word-of-mouth marketing
 
2013 03-lbf cv deck
2013 03-lbf cv deck2013 03-lbf cv deck
2013 03-lbf cv deck
 
Escucha la radio
Escucha la radioEscucha la radio
Escucha la radio
 
Foro3 G1 Documento Padres De Familia
Foro3 G1 Documento Padres De FamiliaForo3 G1 Documento Padres De Familia
Foro3 G1 Documento Padres De Familia
 
Shakti Bhog's TV series with maximum viewership
Shakti Bhog's TV series with maximum viewershipShakti Bhog's TV series with maximum viewership
Shakti Bhog's TV series with maximum viewership
 
Preparativos Para El Primer Dia De Guarderia
 
Alice charles conference_the_potential_of_landbanking_28.04
Alice charles conference_the_potential_of_landbanking_28.04Alice charles conference_the_potential_of_landbanking_28.04
Alice charles conference_the_potential_of_landbanking_28.04
 
Alitara interim management
Alitara interim managementAlitara interim management
Alitara interim management
 
Los videojuegos.
Los videojuegos.Los videojuegos.
Los videojuegos.
 
La transgresión del cretácico inferior en el margen andino (perú y ecuador) d...
La transgresión del cretácico inferior en el margen andino (perú y ecuador) d...La transgresión del cretácico inferior en el margen andino (perú y ecuador) d...
La transgresión del cretácico inferior en el margen andino (perú y ecuador) d...
 
JDK Tools For Performance Diagnostics
JDK Tools For Performance DiagnosticsJDK Tools For Performance Diagnostics
JDK Tools For Performance Diagnostics
 
20 consigli su come creare testi leggibili
20 consigli su come creare testi leggibili20 consigli su come creare testi leggibili
20 consigli su come creare testi leggibili
 
Bases y temario coremat 2012 sicuani
Bases y  temario coremat 2012 sicuaniBases y  temario coremat 2012 sicuani
Bases y temario coremat 2012 sicuani
 
7 holocausto farmaceútico-edu sanchez-orviz
7 holocausto farmaceútico-edu sanchez-orviz7 holocausto farmaceútico-edu sanchez-orviz
7 holocausto farmaceútico-edu sanchez-orviz
 
Catalog led corn bulbs - enkonn
Catalog   led corn bulbs - enkonnCatalog   led corn bulbs - enkonn
Catalog led corn bulbs - enkonn
 
IstItuto Italiano dei Plastici - Sistemi di Gestione Energia
IstItuto Italiano dei Plastici - Sistemi di Gestione EnergiaIstItuto Italiano dei Plastici - Sistemi di Gestione Energia
IstItuto Italiano dei Plastici - Sistemi di Gestione Energia
 

Similar to Jpm top country and sector ideas 121015

Angel Securities - 4 QFY2010 Result Preview
Angel Securities - 4 QFY2010 Result PreviewAngel Securities - 4 QFY2010 Result Preview
Angel Securities - 4 QFY2010 Result PreviewAngel Broking
 
GE Global Innovation Barometer 2013 – India Report
GE Global Innovation Barometer 2013 – India ReportGE Global Innovation Barometer 2013 – India Report
GE Global Innovation Barometer 2013 – India ReportGE_India
 
Putting Together the Pieces - A Guide to S&OP Technology Selection- 20 AUGUST...
Putting Together the Pieces - A Guide to S&OP Technology Selection- 20 AUGUST...Putting Together the Pieces - A Guide to S&OP Technology Selection- 20 AUGUST...
Putting Together the Pieces - A Guide to S&OP Technology Selection- 20 AUGUST...Lora Cecere
 
Misti2012 infotech new engines of growth rajen
Misti2012 infotech new engines of growth rajenMisti2012 infotech new engines of growth rajen
Misti2012 infotech new engines of growth rajenEsue Ishak
 
3M Company at Barclays Capital Industrial Select Conference
3M Company at Barclays Capital Industrial Select Conference3M Company at Barclays Capital Industrial Select Conference
3M Company at Barclays Capital Industrial Select Conferencefinance10
 
Heavy Reading - Mobile Operator Perspectives: Monetization Optimization and V...
Heavy Reading - Mobile Operator Perspectives: Monetization Optimization and V...Heavy Reading - Mobile Operator Perspectives: Monetization Optimization and V...
Heavy Reading - Mobile Operator Perspectives: Monetization Optimization and V...Cisco Service Provider
 
An evaluation report dr malik khalid mehmood ph_d
An evaluation report   dr malik khalid mehmood ph_dAn evaluation report   dr malik khalid mehmood ph_d
An evaluation report dr malik khalid mehmood ph_dMalik Khalid Mehmood
 
SU Student Investment Fund - Fall 2010
SU Student Investment Fund - Fall 2010SU Student Investment Fund - Fall 2010
SU Student Investment Fund - Fall 2010fb18077
 
Doing business in_post_conflict_and_fragile_states___challenges_and_risks____...
Doing business in_post_conflict_and_fragile_states___challenges_and_risks____...Doing business in_post_conflict_and_fragile_states___challenges_and_risks____...
Doing business in_post_conflict_and_fragile_states___challenges_and_risks____...Malik Khalid Mehmood
 
(OTCBB:MIMV) Analytical Profile
(OTCBB:MIMV) Analytical Profile(OTCBB:MIMV) Analytical Profile
(OTCBB:MIMV) Analytical ProfileThe WSR Group
 
Airtel - Marketing Insights
Airtel - Marketing InsightsAirtel - Marketing Insights
Airtel - Marketing InsightsKaran Jaidka
 
GE-barometer IVA 19 mars
GE-barometer IVA 19 marsGE-barometer IVA 19 mars
GE-barometer IVA 19 marsbyLaurel
 
Talent Attraction Barometer
Talent Attraction BarometerTalent Attraction Barometer
Talent Attraction BarometerUniversum Global
 
GSNO.10
GSNO.10GSNO.10
GSNO.10jdh7
 
European Plastic Packaging Report
European Plastic Packaging ReportEuropean Plastic Packaging Report
European Plastic Packaging Reportandrepp1701uk
 
CapGemini, Panalpina & Oracle on 'The Hidden Opportunities of Economic Crisis...
CapGemini, Panalpina & Oracle on 'The Hidden Opportunities of Economic Crisis...CapGemini, Panalpina & Oracle on 'The Hidden Opportunities of Economic Crisis...
CapGemini, Panalpina & Oracle on 'The Hidden Opportunities of Economic Crisis...eyefortransport
 
citigroup January 17, 2002 - Fourth Quarter Financial Supplement
citigroup January 17, 2002 - Fourth Quarter  Financial Supplementcitigroup January 17, 2002 - Fourth Quarter  Financial Supplement
citigroup January 17, 2002 - Fourth Quarter Financial SupplementQuarterlyEarningsReports
 

Similar to Jpm top country and sector ideas 121015 (20)

Business Plan
Business Plan  Business Plan
Business Plan
 
Angel Securities - 4 QFY2010 Result Preview
Angel Securities - 4 QFY2010 Result PreviewAngel Securities - 4 QFY2010 Result Preview
Angel Securities - 4 QFY2010 Result Preview
 
CVTeam Presentation
CVTeam PresentationCVTeam Presentation
CVTeam Presentation
 
GE Global Innovation Barometer 2013 – India Report
GE Global Innovation Barometer 2013 – India ReportGE Global Innovation Barometer 2013 – India Report
GE Global Innovation Barometer 2013 – India Report
 
Putting Together the Pieces - A Guide to S&OP Technology Selection- 20 AUGUST...
Putting Together the Pieces - A Guide to S&OP Technology Selection- 20 AUGUST...Putting Together the Pieces - A Guide to S&OP Technology Selection- 20 AUGUST...
Putting Together the Pieces - A Guide to S&OP Technology Selection- 20 AUGUST...
 
Misti2012 infotech new engines of growth rajen
Misti2012 infotech new engines of growth rajenMisti2012 infotech new engines of growth rajen
Misti2012 infotech new engines of growth rajen
 
3M Company at Barclays Capital Industrial Select Conference
3M Company at Barclays Capital Industrial Select Conference3M Company at Barclays Capital Industrial Select Conference
3M Company at Barclays Capital Industrial Select Conference
 
Heavy Reading - Mobile Operator Perspectives: Monetization Optimization and V...
Heavy Reading - Mobile Operator Perspectives: Monetization Optimization and V...Heavy Reading - Mobile Operator Perspectives: Monetization Optimization and V...
Heavy Reading - Mobile Operator Perspectives: Monetization Optimization and V...
 
An evaluation report dr malik khalid mehmood ph_d
An evaluation report   dr malik khalid mehmood ph_dAn evaluation report   dr malik khalid mehmood ph_d
An evaluation report dr malik khalid mehmood ph_d
 
SU Student Investment Fund - Fall 2010
SU Student Investment Fund - Fall 2010SU Student Investment Fund - Fall 2010
SU Student Investment Fund - Fall 2010
 
Doing business in_post_conflict_and_fragile_states___challenges_and_risks____...
Doing business in_post_conflict_and_fragile_states___challenges_and_risks____...Doing business in_post_conflict_and_fragile_states___challenges_and_risks____...
Doing business in_post_conflict_and_fragile_states___challenges_and_risks____...
 
(OTCBB:MIMV) Analytical Profile
(OTCBB:MIMV) Analytical Profile(OTCBB:MIMV) Analytical Profile
(OTCBB:MIMV) Analytical Profile
 
Airtel - Marketing Insights
Airtel - Marketing InsightsAirtel - Marketing Insights
Airtel - Marketing Insights
 
GE-barometer IVA 19 mars
GE-barometer IVA 19 marsGE-barometer IVA 19 mars
GE-barometer IVA 19 mars
 
Talent Attraction Barometer
Talent Attraction BarometerTalent Attraction Barometer
Talent Attraction Barometer
 
GSNO.10
GSNO.10GSNO.10
GSNO.10
 
European Plastic Packaging Report
European Plastic Packaging ReportEuropean Plastic Packaging Report
European Plastic Packaging Report
 
Hult MBA Class Profile 2011
Hult MBA Class Profile 2011Hult MBA Class Profile 2011
Hult MBA Class Profile 2011
 
CapGemini, Panalpina & Oracle on 'The Hidden Opportunities of Economic Crisis...
CapGemini, Panalpina & Oracle on 'The Hidden Opportunities of Economic Crisis...CapGemini, Panalpina & Oracle on 'The Hidden Opportunities of Economic Crisis...
CapGemini, Panalpina & Oracle on 'The Hidden Opportunities of Economic Crisis...
 
citigroup January 17, 2002 - Fourth Quarter Financial Supplement
citigroup January 17, 2002 - Fourth Quarter  Financial Supplementcitigroup January 17, 2002 - Fourth Quarter  Financial Supplement
citigroup January 17, 2002 - Fourth Quarter Financial Supplement
 

More from Sergii Kurbatov

Bloomberg Commodity Index: January 2018 Report
Bloomberg Commodity Index: January 2018 ReportBloomberg Commodity Index: January 2018 Report
Bloomberg Commodity Index: January 2018 ReportSergii Kurbatov
 
ProAgro Conference: Методы анализа рынков аграрной продукции (укр)
ProAgro Conference: Методы анализа рынков аграрной продукции (укр)ProAgro Conference: Методы анализа рынков аграрной продукции (укр)
ProAgro Conference: Методы анализа рынков аграрной продукции (укр)Sergii Kurbatov
 
Credit suisse-global-wealth-report-2014
Credit suisse-global-wealth-report-2014Credit suisse-global-wealth-report-2014
Credit suisse-global-wealth-report-2014Sergii Kurbatov
 
Ukraine IMF review_sept_2014
Ukraine IMF review_sept_2014Ukraine IMF review_sept_2014
Ukraine IMF review_sept_2014Sergii Kurbatov
 
Food and-agribusiness-survey-2014-118237
Food and-agribusiness-survey-2014-118237Food and-agribusiness-survey-2014-118237
Food and-agribusiness-survey-2014-118237Sergii Kurbatov
 
собеседник+ №1. 100 книг, которые должен прочитать каждый
собеседник+ №1. 100 книг, которые должен прочитать каждыйсобеседник+ №1. 100 книг, которые должен прочитать каждый
собеседник+ №1. 100 книг, которые должен прочитать каждыйSergii Kurbatov
 
Forecast 2013 alfa capital
Forecast 2013 alfa capitalForecast 2013 alfa capital
Forecast 2013 alfa capitalSergii Kurbatov
 
2012 the outlook for energy - a view to 2040
2012 the outlook for energy  - a view to 20402012 the outlook for energy  - a view to 2040
2012 the outlook for energy - a view to 2040Sergii Kurbatov
 
Monthly agricultural review october 2012
Monthly agricultural review october 2012Monthly agricultural review october 2012
Monthly agricultural review october 2012Sergii Kurbatov
 
grain market report 29 11-2012
grain market report 29 11-2012grain market report 29 11-2012
grain market report 29 11-2012Sergii Kurbatov
 
IMF Ukraine country report 27-11-2012
IMF Ukraine country report 27-11-2012IMF Ukraine country report 27-11-2012
IMF Ukraine country report 27-11-2012Sergii Kurbatov
 
Special report china_trade
Special report china_tradeSpecial report china_trade
Special report china_tradeSergii Kurbatov
 
The Financial Development Report 2012
The Financial Development Report 2012The Financial Development Report 2012
The Financial Development Report 2012Sergii Kurbatov
 
2012 2030 energy_outlook_booklet
2012 2030 energy_outlook_booklet2012 2030 energy_outlook_booklet
2012 2030 energy_outlook_bookletSergii Kurbatov
 
Db investigator strategy 121017
Db investigator strategy 121017Db investigator strategy 121017
Db investigator strategy 121017Sergii Kurbatov
 
Db investigator strategy 121017
Db investigator strategy 121017Db investigator strategy 121017
Db investigator strategy 121017Sergii Kurbatov
 

More from Sergii Kurbatov (20)

Bloomberg Commodity Index: January 2018 Report
Bloomberg Commodity Index: January 2018 ReportBloomberg Commodity Index: January 2018 Report
Bloomberg Commodity Index: January 2018 Report
 
ProAgro Conference: Методы анализа рынков аграрной продукции (укр)
ProAgro Conference: Методы анализа рынков аграрной продукции (укр)ProAgro Conference: Методы анализа рынков аграрной продукции (укр)
ProAgro Conference: Методы анализа рынков аграрной продукции (укр)
 
Credit suisse-global-wealth-report-2014
Credit suisse-global-wealth-report-2014Credit suisse-global-wealth-report-2014
Credit suisse-global-wealth-report-2014
 
Ukraine IMF review_sept_2014
Ukraine IMF review_sept_2014Ukraine IMF review_sept_2014
Ukraine IMF review_sept_2014
 
Food and-agribusiness-survey-2014-118237
Food and-agribusiness-survey-2014-118237Food and-agribusiness-survey-2014-118237
Food and-agribusiness-survey-2014-118237
 
собеседник+ №1. 100 книг, которые должен прочитать каждый
собеседник+ №1. 100 книг, которые должен прочитать каждыйсобеседник+ №1. 100 книг, которые должен прочитать каждый
собеседник+ №1. 100 книг, которые должен прочитать каждый
 
Evraz
EvrazEvraz
Evraz
 
Forecast 2013 alfa capital
Forecast 2013 alfa capitalForecast 2013 alfa capital
Forecast 2013 alfa capital
 
2012 the outlook for energy - a view to 2040
2012 the outlook for energy  - a view to 20402012 the outlook for energy  - a view to 2040
2012 the outlook for energy - a view to 2040
 
Monthly agricultural review october 2012
Monthly agricultural review october 2012Monthly agricultural review october 2012
Monthly agricultural review october 2012
 
grain market report 29 11-2012
grain market report 29 11-2012grain market report 29 11-2012
grain market report 29 11-2012
 
IMF Ukraine country report 27-11-2012
IMF Ukraine country report 27-11-2012IMF Ukraine country report 27-11-2012
IMF Ukraine country report 27-11-2012
 
Special report china_trade
Special report china_tradeSpecial report china_trade
Special report china_trade
 
Global outlook q1 2013
Global outlook q1 2013Global outlook q1 2013
Global outlook q1 2013
 
The Financial Development Report 2012
The Financial Development Report 2012The Financial Development Report 2012
The Financial Development Report 2012
 
2012 2030 energy_outlook_booklet
2012 2030 energy_outlook_booklet2012 2030 energy_outlook_booklet
2012 2030 energy_outlook_booklet
 
Db investigator strategy 121017
Db investigator strategy 121017Db investigator strategy 121017
Db investigator strategy 121017
 
Jpm china view 121018
Jpm china view 121018Jpm china view 121018
Jpm china view 121018
 
Db investigator strategy 121017
Db investigator strategy 121017Db investigator strategy 121017
Db investigator strategy 121017
 
Jpm china view 121018
Jpm china view 121018Jpm china view 121018
Jpm china view 121018
 

Jpm top country and sector ideas 121015

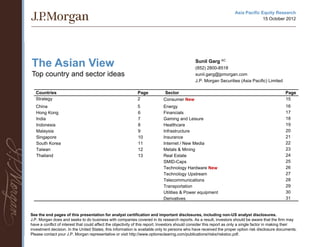
  • 1. Asia Pacific Equity Research 15 October 2012 The Asian View Sunil Garg AC (852) 2800-8518 Top country and sector ideas sunil.garg@jpmorgan.com J.P. Morgan Securities (Asia Pacific) Limited Countries Page Sector Page Strategy 2 Consumer New 15 China 5 Energy 16 Hong Kong 6 Financials 17 India 7 Gaming and Leisure 18 Indonesia 8 Healthcare 19 Malaysia 9 Infrastructure 20 Singapore 10 Insurance 21 South Korea 11 Internet / New Media 22 Taiwan 12 Metals & Mining 23 Thailand 13 Real Estate 24 SMID-Caps 25 Technology Hardware New 26 Technology Upstream 27 Telecommunications 28 Transportation 29 Utilities & Power equipment 30 Derivatives 31 See the end pages of this presentation for analyst certification and important disclosures, including non-US analyst disclosures. J.P. Morgan does and seeks to do business with companies covered in its research reports. As a result, investors should be aware that the firm may have a conflict of interest that could affect the objectivity of this report. Investors should consider this report as only a single factor in making their investment decision. In the United States, this information is available only to persons who have received the proper option risk disclosure documents. 1 Please contact your J.P. Morgan representative or visit http://www.optionsclearing.com/publications/risks/riskstoc.pdf.
  • 2. Adrian MowatAC (852) 2800-8599 adrian.mowat@jpmorgan.com J.P. Morgan Securities (Asia Pacific) Limited Emerging markets and AP equity strategy Key Messages Investment themes/issues  2013 is a continuation of 2012 macro trends  Focus on earnings revisions…micro not macro  Slow DM growth  EM Nifty Fifty: (JPGIENIF Index)  Lower profits in China lead to lower capex and cost reduction to rebuild margin = lower GDP  China’s three inflection points  Demographics  Investors reluctantly buy equities  2008/9 stimulus  QE3: interest rates low until 2015  Deflating housing bubble  ECB and Fed actions reduce tail risks  OW Tech…an unusual seasonal lift  Do not extrapolate previous QEs  Money chases momentum  Margin expansion – falling PPI – Credit and equities not commodities  Strong demand for EM fixed income – DM equities plus EM growth  Knee-jerk reaction: Rotation into underperformers  OW India and Turkey Country recommendations Risks to our view + volatility  Overweight:  China: Large stimulus  Mexico, India, Turkey, Thailand and Philippines  QE: Leading to higher commodity and energy prices  Technology, consumer discretionary  Underweight:  Drivers of volatility  China, Brazil, (Australia)  Euro fiscal crisis  Materials  US fiscal cliff  China data 2
  • 3. Heat-maps: Key sectors in country recommendations OW: India, Turkey, Mexico, Thailand and Philippines UW: China, Brazil, (Australia) Emerging Markets Equity Strategy Heat Map Mexico tel. Mexico China Others China Brazil Financials Thailand Taiwan IT Brazil Energy Others Energy China Brazil Materials Brazil CS Brazil Others Mexico CS Telecom China CS Twn. Financials SA Telecom Indonesia China Fin. ex China CD Twn. Mater. Korea SA SA CD Twn. Others Chile banks China Ind. Materials Financials Russia Philippines Korea China Mater. India Energy SA Others Energy Financials Korea IT SA Materials India China Banks India Others Malaysia Financials Korea Turkey Fin. Russia Korea CD Korea Others CE3 India IT Industrials Turk. Others Others Source: J.P. Morgan Strategy. Note: Red Indicates UW, green OW and white Neutral. Smaller markets with weights < 0.5% of MSCI EM are not included. Area of the sector indicates weight in MSCI EM. Overweight Underweight Asia Pacific ex-Japan Equity Strategy Heat Map Korea Others HK Indust. Australia CS Korea IT HK CD HK Malaysia Aus. Indus Korea CD Korea HK Utilities Financials Australia Financials Australia Financials Taiwan Taiwan IT Energy Korea Korea Financials India Materials Industrials Taiwan India Others Financials Indonesia Australia China mat. China CS Materials India Energy Others China CD China Indus. Taiw. Others India IT China Banks China Singapore Thailand China Fin. China Sing. Others Australia Materials Energy China Others Financials Ex banks Telecom Sing. Indus Philippines Source: J.P. Morgan Strategy, MSCI, Datastream. Note: Red Indicates UW, green OW and white Neutral. Area of the sector indicates weight in MSCI APxJ. 3
  • 5. Sunil GargAC (852) 2800-8518 sunil.garg@jpmorgan.com China J.P. Morgan Securities (Asia Pacific) Limited Valuation comps for our highest-conviction recommendations Mkt cap Rating Price PT P/E (x) P/BV (x) ROE (%) DY (%) Company BB CMP (US$MM) target End date FY12E FY13E FY12E FY13E FY12E FY13E FY12E FY13E Top Picks 21Vianet Group Inc. VNET US 12 409 OW 16.3 31-Dec-13 142.8 88.1 8.5 7.9 5.6 9.3 0.0 0.0 Baidu.com BIDU US 111 30,182 OW 200 31-Dec-13 24.0 17.8 9.4 6.0 48.6 41.3 0.0 0.0 Beijing Capital International Airport 694 HK 5.26 1,275 OW 8.3 31-Dec-12 13.3 10.8 1.2 1.1 9.3 10.5 1.1 1.4 Beijing Enterprises 392 HK 49.1 7,205 OW 60 30-Jun-13 18.3 13.7 1.2 1.1 6.6 8.2 1.6 2.2 China Shenhua Energy - H 1088 HK 31.3 13,722 OW 35 30-Jun-13 11.2 10.3 2.0 1.8 19.0 18.3 3.4 3.7 China Shipping Container Lines 2866 HK 1.81 876 OW 2.85 31-Dec-13 -68.3 24.0 0.7 0.7 -1.0 2.7 0.0 0.0 China State Construction 3311 HK 8.92 4,473 OW 13 31-Dec-13 15.2 11.0 3.1 2.6 21.5 26.1 1.9 2.7 China ZhengTong Auto 1728 HK 4.85 1,382 OW 5.5 30-Jun-13 13.4 10.5 1.2 1.1 9.8 11.1 1.0 Country Garden 2007 HK 2.95 6,937 OW 3.55 30-Jun-13 7.5 6.6 1.2 1.0 17.4 16.7 5.2 5.9 Galaxy 27 HK 25 13,520 OW 31 31-Dec-12 14.8 12.7 4.9 3.6 39.9 32.8 0.0 0.0 Golden Eagle Retail 3308 HK 16.2 4,034 OW 19.5 30-Jun-13 20.7 18.2 4.9 4.4 25.4 25.4 2.4 2.7 ICBC - H 1398 HK 4.96 55,531 OW 5.8 31-Dec-12 6.3 6.4 1.3 1.1 21.3 18.3 5.1 5.0 Lenovo 992 HK 6.16 8,170 OW 8.1 31-Mar-13 17.0 13.9 3.1 3.5 22.1 25.8 2.3 3.1 Ping An Insurance Group - H 2318 HK 61 24,627 OW 65 31-Dec-12 15.9 13.1 2.6 2.2 17.5 18.2 0.9 1.0 Sinopec Corp - H 386 HK 7.82 16,927 OW 9 31-Dec-12 7.6 6.9 1.0 0.9 14.6 14.4 3.1 3.4 The United Laboratories 3933 HK 4.05 850 OW 4.5 31-Dec-12 21.3 12.0 1.2 1.2 5.6 9.9 1.7 3.2 Stocks to Avoid Anta Sports Products Ltd. 2020 HK 6.78 2,180 UW 3.6 30-Jun-13 9.5 14.2 2.0 1.9 21.9 13.9 6.5 4.3 Aluminum Corporation of China - H 2600 HK 3.34 1,699 UW 2.7 30-Jun-13 -7.4 139.1 0.8 0.8 -9.3 0.6 0.0 0.0 China Merchants Holdings Int'l 144 HK 23.6 7,579 UW 20 31-Dec-12 13.2 12.7 1.3 1.2 9.9 9.9 3.3 3.4 Glorious Property 845 HK 1.14 1,146 UW 1 31-Dec-12 5.2 5.3 0.4 0.4 8.0 7.4 0.0 0.0 New China Life Insurance Company Ltd - A 601336 CH 23 7,591 UW 25 31-Dec-12 23.4 15.3 2.1 1.8 9.3 12.7 1.8 0.7 PetroChina 857 HK 10.4 28,251 UW 8.75 31-Dec-12 10.2 9.9 1.4 1.3 14.6 13.9 4.4 4.6 Source: J.P. Morgan estimates, Bloomberg. Pricing date is 12 October 2012. 5
  • 6. Adrian MowatAC (852) 2800-8599 Adrian.mowat@jpmorgan.com Hong Kong J.P. Morgan Securities (Asia Pacific) Limited  Overall market view: We stay cautious and expect a Hong Kong – Hang Seng Index12M-fwd P/E range-bound market in 2H12. Outlook for the economy x remains poor, with 2012 GDP growth forecast low at 30 Current=9.2x 1.9% by JPMe. We think inflation is likely to fall further 25 on the back of the lower import prices and slower pace +2 std dev of Rmb appreciation. Market is de-rating on poor 20 fundamentals, trading at 12m P/E of 9.2x. +1 std dev 15 long term avg=13.5x  Sector calls: Focus on residential among properties, as we think current prices have factored in potential 10 downside. We maintain our positions in casinos -1 std dev although we expect near-term pressure. Prefer 5 85 86 87 88 89 90 91 92 93 94 95 96 97 98 99 00 01 02 03 04 05 06 07 08 09 10 11 12 Insurance over Banks; UW on utilities. Source: Bloomberg, J.P. Morgan.  Drivers/catalysts/events: 1) China policy easing on soft economic data, 2) declining inflation rate, 3) Stock views Recovery of property transactions, slower land sales, diminishing policy risk and record low mortgage rates P/E (x) BB Code Rating Price PT FY12E FY13E are positive for the property sector, 4) expect new Top Picks launch (Cotai Central II) in Macau in 3Q12. AIA 1299 HK OW 29.25 31 19.2 15.5  Key issues / risks: 1) Global economic uncertainty, BOCHK 2388 HK OW 24.1 27 12.6 12.9 2) trade sector supply and demand can incrementally Cheung Kong 1 HK OW 113.2 120 11.6 11.5 swing both ways, 3) central office demand is under Galaxy 27 HK OW 25 31 14.8 12.7 pressure as financial companies are downsizing and Lifestyle 1212 HK OW 17.02 19 15.3 14.2 relocating. Pacific Basin Shipping 2343 HK OW 3.88 4.5 -4.4 30.5 Power Assets 6 HK OW 66.55 70 14.2 13.7  View relative to region: Underweight. Source: Bloomberg, J.P. Morgan estimates. Note: Share prices and valuations are as of October 12, 2012. 6
  • 7. Bharat IyerAC (91-22) 6157-3600 bharat.x.iyer@jpmorgan.com J.P. Morgan India Private Limited India  At a 12-13x one-year forward P/E, Indian equities are MSCI India – 12 M forward P/E trend trading at the lower end of the last decade’s trading range.  But the economy’s potential growth rate has deteriorated markedly over the past two years.  In the absence of structural reforms to address growth constraints, markets could remain cheap.  Over the interim, investors may have to contend with market returns in line with earnings growth (estimated at about 10-12% over FY12-14E).  Political window of opportunity to address policy concerns over the next two quarters. Source: MSCI, Bloomberg, IBES  Portfolio Stance Top Picks and Avoids  Overweight private sector banks on expected policy stimuli. P/E (x)  Underweight consumption as rural growth momentum BB Code Rating Price PT FY12E FY13E moderates. Top Picks  Stock-specific approach for global sectors, given the ICICI Bank ICICIBC IN OW 1044.75 1025 19.3 15.6 uncertain environment. TATA Consultancy Services TCS IN N 1298.45 1400 23.9 18.4  Key risks IDFC IDFC IN OW 151.05 150 14.6 13.0  A sustained rise in global crude oil prices Power Grid Corporation of India PWGR IN OW 119.95 120 18.4 15.3  Policy environment remains directionless ITC ITC IN OW 283.5 260 33.9 29.1 Avoids  We have an overweight rating on India in an Asia and Jubilant Foodworks Ltd JUBI IN UW 1364.8 995 82.3 56.6 Emerging Markets context. Adani Power ADANI IN UW 50.45 31 -291.3 -4086.5 Bank of India BOI IN UW 301.95 250 6.5 6.9 Source: Bloomberg, J.P. Morgan estimates, prices as of October 12, 2012. 7
  • 8. Aditya Srinath, CFAAC (62-21) 5291-8573 aditya.s.srinath@jpmorgan.com PT J.P. Morgan Securities Indonesia Indonesia MSCI Indonesia: 12M Forward P/E Abs & and Rel to MSCI APxJ  J.P. Morgan weighting: Neutral – Relative to MSCI EM/APxJ  Indonesia has reversed early year underperformance of Asia ex-Japan & EM  Rotation to the fore until clarity on earnings emerges  Investment positives  Valuation pressures being deflated  Oil declining – inflation risks contained  Domestic growth to be relatively resilient Source: MSCI, Bloomberg,  Investment negatives  Policy hazards Key stocks P/E (x)  The rupiah BB Code Rating Price PT FY12E FY13E  Risks to demand from commodity prices Top Picks Bank Rakyat Indonesia BBRI IJ OW 7500 8200 10.8 8.6  Sector weightings: Banks OW, Industrials OW, Materials Indocement INTP IJ OW 21000 23000 17.8 15.3 OW, Consumer Staples N & Utilities OW, Consumer Disc. Perusahaan Gas Negara PGAS IJ OW 4375 4100 15.3 14.1 UW, Energy UW, Telcos N Avoids United Tractors UNTR IJ UW 19900 18000 12.9 11.6  Off Index OW –Property (SMRA) Indika Energy INDY IJ N 1550 2000 0.0 0.0  Reinstated BBRI as top pick along with INTP, PGAS Source: Bloomberg, J.P. Morgan estimates, prices as of 12 October 2012.  Avoids: UNTR, INDY 8
  • 9. Hoy Kit MakAC (60-3) 2270-4728 hoykit.mak@jpmorgan.com Malaysia JPMorgan Securities (Malaysia) Sdn. Bhd. (18146-X)  Malaysia’s defensiveness stands out amidst KLCI performance during 12th GE (2008) global uncertainties. Combination of large 1550 domestic funds presence and resilient economy/earnings drove MSCI Malaysia 1450 -4% valuations to a 29% premium to APxJ (historical average of 13%). 1350 -5% -9% -5%  Key market driver/risk is the upcoming general 1250 elections, not due until Apr 2013. Sept/Oct are 1150 probable/final windows to hold elections. Pullback (close to 10%) highly likely regardless, when 1050 parliament is dissolved, as per 2008 outcome. We Jan-08 Feb-08 Mar-08 Apr-08 May-08 are uncomfortable with the market’s 2012 P/E of Source: CEIC. Bloomberg. 16.5x, against a historical average of 15x, suggesting event risk is not priced in. Stock views: Key top picks and avoids  Tactical pre-elections call: We recommend that P/E (x) investors stick with apolitical stocks with earnings BB Code Rating Price PT FY12E FY13E growth prospects - AirAsia, Axiata, Sime Darby, OW Dialog, and KPJ Healthcare. AirAsia AIRA MK OW 3.05 4 5.5 14.1  Post elections drivers: 1) Political stability = Sime Darby SIME MK OW 9.72 11.3 13.9 13.0 policy continuity (ETP gaining traction). 2) Strong Dialog DLG MK OW 2.39 2.8 31.5 28.0 KPJ Healthcare KPJ MK OW 6.13 6.6 23.6 19.2 domestic-driven demand (on robust fixed capital Axiata AXIATA MK OW 6.47 5.6 17.3 15.4 formation) offsetting external demand drag. 3) Avoids Improving earnings momentum. 4) Consensus Hong Leong HLBK MK UW 13.92 11.5 13.9 14.9 UW with EM funds 2.5% weight vs. neutral weight British American Tobacco ROTH MK UW 61.04 50.2 21.6 20.8 of 3.7%; locals all cashed up. Rising free float IOI Corporation IOI MK UW 5.03 4.6 18.1 16.7 positive. Source: Bloomberg, J.P. Morgan estimates. Note: Share prices and valuations are as of 12 October 2012.  Key risks: 1) BN loses even a simple majority. 2) Sharper-than-expected external sector slowdown. 9
  • 10. James R. Sullivan, CFAAC (65) 6882-2374 james.r.sullivan@jpmorgan.com Singapore J.P. Morgan Securities Singapore Private Limited Summary of market correlations across sectors  Market to head lower? Singapore macro actuals have 1.00 begun to miss estimates for the first time since Summer 2011 (GDP, IP recently; Retail sales have been missing for 0.90 Difficult period for Fundamental stock picking, some time). 2) More importantly, the trend of actuals is now stock specifics countered by high cross sector correlations - all trade as one 0.80 below the trend of revisions, i.e., additional negative revisions are likely. Per the chart on the right below, the 0.70 market has now traded higher despite this revision risk. 3) Singapore market earnings revisions turned negative in mid- 0.60 August. 4) Technicals have now turned cautious, versus 0.50 Positive period for fundamental stock picking their very bullish stance previously.  Mitigating Factors: 1) EASI has moved into positive 0.40 territory, the median 6 -month return for the Singapore 0.30 market post a move into positive territory is 10%. 2) Singapore inflation moderating (although this could actually 0.20 strengthen the slowdown argument). 3) Great stock-picking Feb-11 May-11 Aug-11 Nov-11 Feb-12 May-12 Aug-12 environment, as cross-sector correlations are extremely low. Source: J.P. Morgan estimates, Bloomberg  Stock picks: Own outward-looking Singapore (NOL, SIA, KEP), avoid anything inward-looking save inflating assets Stock views (CAPL). P/E (x) Market (blue) rising while likely revisions (red) falling BB Code Rating Price PT CY12E CY13E (sustainable)? Top Picks 12 1800 Neptune Orient Lines NOL SP OW 1.1 1.35 467.5 18.5 10 8 1700 Singapore Airlines SIA SP OW 10.47 13 26.9 18.3 6 4 1600 Keppel Corporation KEP SP OW 11.21 13.3 11.3 13.2 2 ? 1500 CapitaLand CAPL SP OW 3.16 3.4 13.5 11.7 0 ‐2 1400 Avoids ‐4 China Minzhong Food Limited MINZ SP UW 0.835 0.7 3.5 3.4 ‐6 1300 Source: Bloomberg, J.P. Morgan estimates. Note: Share prices and valuations are as of October 12, 2012. IP Actual trend ‐ Forecast Trend  MXSG Source: J.P. Morgan estimates, Bloomberg. 10
  • 11. Scott YH SeoAC (82-2) 758 5759 scott.seo@jpmorgan.com South Korea J.P. Morgan Securities (Far East) Ltd, Seoul Branch  Overall market view – Entering 2Q12 earnings Korea – MSCI Korea 12M-fwd P/BV x season, we recommend that investors focus 2.0 more on the companies’ LT fundamentals 1.8 instead of short-term earnings volatility. Given 1.6 undemanding market valuations (i.e., below -1 1.4 STD of the historical average P/BV and P/E), we 1.2 1.0 expect to see a ST rebound when the macro 0.8 environment turns favorable (i.e., QE 3, China 0.6 government’s economic boosting measures). Jan-05 Oct-05 Jul-06 Apr-07 Jan-08 Oct-08 Jul-09 Apr-10 Jan-11 Oct-11 Jul-1 MSCI KOREA - 12MTH FWD P/BPS Average +1 stdev -1 stdev  Sector calls – In a recovery phase, we expect Source: Datastream. IT and autos to continue to outperform the Korea – Top picks/avoids market. Moving toward 2H12, we expect easing P/E (x) P/B (x) regulatory pressure and probable boosting BB Code Rating Price PT FY12E FY12E measures for domestic consumption to be a Top picks catalyst for domestics. Doosan Heavy Industries 034020 KS OW 54100 71000 11.01 0.93 Kia Motors 000270 KS OW 68200 100000 6.04 1.55  Potential drivers/catalysts/events: 1) Mando 060980 KS OW 148500 220000 10.27 1.64 headline inflation managed within the BoK’s inflation target (3±1%), 2) more stable KRW Lotte Shopping 023530 KS OW 340000 388000 10.28 0.56 Orion movement (KRW to be less volatile than during 001800 KS OW 1018000 1020000 34.39 5.16 Samsung Electronics GFC, in our view), 3) easing regulatory 005930 KS OW 1296000 1800000 9.64 1.82 Samsung Life Insurance pressure, and 4) gradual recovery in residential 032830 KS OW 94900 140000 18.06 0.98 property market. Shinhan Financial Group 055550 KS OW 37250 50000 6.77 0.81 Stocks to avoid  Key issues / risks: Korea market is particularly Honam Petrochem 011170 KS UW 240500 180000 0.01 1.45 vulnerable to macro volatilities due to its highly S-Oil 010950 KS UW 99600 70000 11.11 1.94 cyclical/export-focused industry structure. For domestics, regulatory direction ahead of the Source: Bloomberg, J.P. Morgan estimates. Note: Share prices and valuations are as of October 12, 2012. presidential election (Dec-12) should be a key concern. 11
  • 12. Nick LaiAC (886-2) 2725-9864 nick.yc.lai@jpmorgan.com Taiwan J.P. Morgan Securities (Taiwan) Limited  Sector calls 2012 YTD relative share price performance by sector  Overweight: Tech (we prefer foundry, backend, NB ODM and avoid DRAM and display). 30% 20%  Underweight: Consumer/discretionary, and Materials 10% (we are selective on SMCap stocks). 0%  Neutral: Telco, Financials (we prefer banks over -10% brokers and insurance). -20% -30%  Market view Transportation Elec. Distribution Plastic&Chemical Elec&Machinery Computer Chemical Components Info service Glass&Porcelain Communication Construction Biotech Textiles Machinery Cement Elec. Appliances Depart. Electronics Food Steel Auto Semicon Other elect. Financials Tourism Energy Rubber Plastic Opto elec. Others Paper  J.P. Morgan is neutral on Taiwan in its regional portfolio; we foresee the market trading sideways or being range-bound at~7,000-7,600 in 2H12. Macro developments will be key to sentiment and Source: Bloomberg, *Performance is based on the closing price on 25th June 2012 performance, especially in tech . Top Five Large-Cap Picks BB Code Rating Price Mkt Cap P/E (x) P/BV (x) ROE (%) DY (%) (US$ MM) FY12E FY13E FY12E FY13E FY12E FY13E FY12E TSMC 2330 TT OW 86.3 76,380 14.2 13.0 3.1 2.8 23.3 22.6 3.5 ASE 2311 TT OW 21.95 5,691 11.0 8.4 1.3 1.2 12.4 14.9 3.0 Quanta Computer 2382 TT OW 69.3 9,101 9.8 8.0 2.0 1.8 21.7 23.6 6.2 Far EasTone Telecom 4904 TT OW 74.2 8,257 21.2 17.3 3.2 3.2 15.5 18.6 5.2 Chinatrust 2891 TT OW 16.8 7,124 10.8 10.2 1.2 1.2 11.4 11.7 3.8 Source: Bloomberg, J.P. Morgan estimates. Note: Share prices and valuations are as of October 12, 2012. 12
  • 13. Sriyan PieterszAC (662) 684 2670 Thailand sriyan.pietersz@jpmorgan.com JPMorgan Securities (Thailand) Limited Thailand 12M fwd P/E x Current 12-month forward P/E (SET Index) = 11.8x  We believe Thai equities will provide another half year of 20 outperformance, given their ability to orient toward both domestic 18 +2 stdev = 16.3x 16 themes and global growth re-acceleration. +1 stdev = 13.6x 14 12  Key drivers: (+) domestic growth outlook, (+) positive earnings 10 Average = 10.8x revisions on Financials, (-) external growth/risk aversion, (+) 8 -1 stdev = 8.1x accommodative policy, (+) sustained investment cycle; (-) politics 6 -2 stdev = 5.4x 4 and policy risk factors. 02 03 04 05 06 07 08 09 10 11 12 Source: J.P. Morgan estimates and calculations.  Potential catalysts: monthly bank loan growth data, 2H12 earnings upgrades, political developments, global growth data. JPMQ Global Revisions Landscape As At 21-Aug-2012  Valuations are back at 10-year average P/E. Region Net Revs FY2 Net Revs FY1 EMOM 3MTHFY1 EMOM 3MTHFY2 MSCI All World -21% -14% -3% -3%  Key issues/risks: 1) significant acceleration in inflation; 2) political ASIAPAC Ex JP -28% -26% -4% -4% risk; 3) cash calls. ASIAPAC -29% -27% -4% -3% China -47% -47% -4% -5%  Sector weightings: We are overweight on Banks and Property, Hong Kong -26% 9% -2% -3% Korea -31% -42% -6% -3% neutral on Materials (Petrochemicals), and underweight on Malaysia -6% -5% -1% 0% Telecoms, Consumer and Energy. Singapore -20% -8% 2% -2% Taiw an -45% -44% -8% -7%  Top picks are KBANK, SCB, SCC, LH, IVL, and BTS. Indonesia 5% -2% -2% -2% Philipines 33% 19% 0% 0% Thailand -18% -22% -3% -3% Source: J.P. Morgan Mkt P/E (x) P/B (x) Yield (%) Stock picks BB Code Rating Price PT Cap (US$MM) FY12E FY13E FY12E FY13E FY12E FY13E Top picks Kasikornbank KBANK TB OW 180 220 14,028 12.4 10.7 2.4 2.0 2.0 2.2 Siam Commercial Bank SCB TB OW 168.5 200 18,620 13.5 11.4 2.6 2.2 2.5 2.9 Siam Cement SCC TB OW 357 400 13,945 16.3 14.7 2.8 2.5 3.1 3.4 Land & Houses LH TB OW 8.6 9 2,820 17.2 17.4 2.9 2.8 5.0 4.9 Indorama Ventures IVL TB OW 27.5 41 4,329 11.8 7.4 1.8 1.5 2.5 4.1 BTS Group Holdings BTS TB OW 5.75 7.6 1,865 26.5 39.6 1.5 1.3 5.2 1.9 Tisco Financial Group TISCO TB N 45.5 49 1,078 8.8 7.9 1.8 1.6 4.9 5.5 Stocks to avoids Thai Oil TOP TB UW 64.25 53 4,286 13.8 14.0 1.6 1.5 5.2 5.3 Big C Supercenter BIGC TB UW 192.5 190 5,193 25.4 21.2 4.9 4.2 1.2 1.4 Source: Bloomberg, J.P. Morgan estimates, prices as of 12 October 2012. 13
  • 15. Ebru Sener KurumluAC (852) 2800-8521 ebru.sener@jpmorgan.com J.P. Morgan Securities (Asia Pacific) Limited Consumer  2013 outlook. We are of the view that a Comparison of Chinese sportswear retailers' and other retailers' SSSG significant recovery in discretionary sales in 20.0% 18.0% 2013 is unlikely, so get ready to embrace longer- 16.0% 14.0% term single-digit or low-double digit SSSG in the 12.0% 10.6% space. 10.0% 10.0% 8.0% 0.0% 6.0% 4.8%  Recent update: Retailers indicate a lackluster 4.0% 7.8% 7.8% 5.5% 3Q so far, and we believe 3Q SSSG is likely to 2.0% 3.8% 0.0% come in slightly below 2Q’s. We rebase our 2009 2010 2011 1H12 2013 estimates and cut our 2013 earnings Volume Pricing estimates for retailers by 5% on average. Source: J.P. Morgan estimates, Company data. Includes data from Parkson, Golden Eagle, Belle, Trinity, Daphne, and Ports Design.  Top Picks: We remain positive on select Stock views retailers from a long-term perspective but do not P/E (x) expect an immediate re-rating catalyst to arrive BB Code Rating Price PT FY12E FY13E in 2012 in the form of a strong SSSG pick-up. OW Golden Eagle 3308 HK OW 16.18 19.5 20.7 18.2 Among retailers, Golden Eagle and Trinity are Trinity 891 HK OW 5.19 6.5 16.6 14.6 our top picks, but with a longer-term focus as 2H Chow Tai Fook 1929 HK OW 9.89 12 15.6 14.0 China Foods 506 HK OW 8.34 9.2 23.6 19.0 is likely to be lackluster. We also like CTF, Sa Sa China Mengniu 2319 HK OW 22.55 28 20.0 16.0 and Giordano. Among staples we have OW on UW Hengan 1044 HK UW 73.8 61 25.3 21.1 China Foods and Mengniu on the back of China Yurun 1068 HK UW 5.74 4.6 20.7 8.7 product mix upgrades. Tsingtao – A 600600 CH UW 33.12 26 24.1 20.7 Tsingtao Brewery - H 168 HK UW 44.55 32 26.3 22.7 Parkson 3368 HK UW 6.85 5.6 14.6 13.4 Anta 2020 HK UW 6.78 3.6 9.5 14.2 Li Ning 2331 HK UW 4.83 3.3 -71.5 16.7 Xtep 1368 HK UW 3.19 2.2 6.4 9.5 Source: Company data, J.P. Morgan estimates. Prices are as of October 12, 2012 15
  • 16. Brynjar Eirik Bustnes, CFAAC (852) 2800-8578 Energy brynjar.e.bustnes@jpmorgan.com J.P. Morgan Securities (Asia Pacific) Limited  We believe risk to demand is now greater than supply risk with EU/US economic issues to be resolved. Political risk to China, India, Japan, US and EU5 demand weakening (kBOPD) oil supply has subsided with the “worst” case now in the market. Resolution in Libya brought on light crude, pushing down oil prices and refining margins. Iran is the main wild card, threatening supply cuts or suffering EU sanctions. We believe lost crude from Syria, Yemen and Sudan is also priced in, partially offset by US liquids.  Supplies from Saudi remain high, making up for less Iranian crude. Iraqi production is also increasing, along with North Y/Y change Sea. Angola should ramp up with Canadian oil sands and GRM strong last year on Libya/Japan EQ shale oil in the US at least adding to mid US supplies. 90% 10 Overall demand growth in Asia is trending down, with OECD 88% 8 in general not growing al all. China doesn’t need diesel 86% 6 imports (power trouble not happening) and coming out of 84% 4 maintenance and adding new capacity (1.0 mn BOPD in 82% 2 2012 along with India) should add more products in the 80% 0 2001 2002 2003 2004 2005 2006 2007 2008 2009 2010 2011 E 2012 E 2013 E regional export market. Utilization GRM (US$/bbl - RHS)  Based on the above, we see flat to weaker oil prices and weaker refining margins in 2012. Petrochemicals has been Source: J.P. Morgan estimates, Bloomberg, PAJ badly hit by Chinese tightening and is unlikely to rebound Stock views until 1H2013 at the earliest . P/E (x) BB Code Rating Price PT FY11A FY12E  We think Sinopec offers the best value. China BlueChem is OW also not overpriced, in our view, while small-cap MIE offers PTT Public Company PTT TB OW 315 430 8.5 9.0 good value along with Inpex – but are asset plays. We think Inpex Corporation 1605 JT OW 466500 750000 10.5 10.6 SK Inno is the cheapest refiner in the region, but diesel Sinopec Corp - H 386 HK OW 7.82 9 7.6 7.6 spread reversal could be a negative for SKI as well. China Oilfield Services Limited 2883 HK OW 14.28 13 13.0 11.0  We see downside to CNOOC along with PetroChina due to UW deteriorating fundamentals and valuations. We think S-Oil in PetroChina 857 HK UW 10.38 8.75 11.7 10.2 Korea still prices in high expectations in both refining and Reliance Industries Ltd RIL IN UW 818.9 675 12.7 13.6 PX., while we think RIL has virtually no growth and trades at CNOOC 883 HK UW 15.88 13 8.2 9.5 a high valuation, and we see SK Innovation as fairly priced S-Oil Corp 010950 KS UW 99600 70000 9.6 11.1 at the high end and more defensive in a falling-margin Source: J.P. Morgan estimates, Bloomberg; Table priced as of October 12, 2012 environment. 16
  • 17. Josh KlaczekAC (852) 2800-8534 josh.klaczek@jpmorgan.com Financials J.P. Morgan Securities (Asia Pacific) Limited  In 1Q, we saw loan growth begin to decelerate Loan/Deposit Ratios: Large Increase Since 2008, Still Well <100% across the region, with weaker credit growth a 20 19 particular focus in China. For now, falling interbank rates & relatively conservative 15 14 leverage gives us a more constructive view on 9 Chg since 2008 (%) 10 6 asset quality – increasingly in China as well 4 5 3 2 2 0 -26  Key country calls : OW on Philippines & 0 -16 -19 Thailand, turning positive on China banks; UW -5 on Indonesia, Australia. Watch USD funding stress in ASEAN on external issues. -10 TH HK SG PH ID CH MY IN TW AU US KR Mar-12 95 68 88 65 82 68 77 73 84 128 81 102  Reasons to be constructive: 1) inflation Source: BIS falling, policymakers have more “bullets” than the West, 2) LDRs have risen but interbank Stock views markets show no signs of panic/stress, 3) P/E (x) valuations are now 7-9x P/E across the region BB Code Rating Price PT FY12E FY13E  Key risks: Higher provisions are the most Top Picks important risk to the region, although we think Metropolitan Bank MBT PM OW 90.85 100 13.2 10.9 more immediate downgrades are likely to result China Minsheng Banking - H 1988 HK N 6.65 7.25 5.1 5.5 from NIM compression as policy-makers ease HSBC Holdings plc 5 HK OW 74.2 83 11.7 9.9 liquidity & credit demand begins to wane. Avoids Sinopac Financial Holdings 2890 TT N 11.6 10 12.3 12.3  With credit quality being a continued focus, our TMB Bank Public Company Limited TMB TB UW 1.79 1.3 13.3 15.9 portfolio remains anchored in positions in higher- Bank Central Asia (BCA) BBCA IJ UW 8150 7000 18.3 14.9 quality & defensive franchises – such as ICBC, Source: Bloomberg, J.P. Morgan estimates. BOCHK, HSBC, HDFCB, SCB – as well as a mix Note: Share prices and valuations are as of October 12, 2012. of “growth” stories like Minsheng & Yes Bank. 17
  • 18. Kenneth Fong , CFAAC (852) 2800-8597 kenneth.kc.fong@jpmorgan.com Gaming and Leisure J.P. Morgan Securities (Asia Pacific) Limited Macau names rolling forward EBITDA multiple  Key theme: The sector may see some near-term pressure on the back of a tougher comparison ahead EV/EBITDA (x) 16 (especially in July and August) and elevated analyst 15 expectations (Street’s revenue growth expectation for 14 2012 is 20-25% vs. actual delivered 26% ytd). We 13 12 advise investors to lock in some profit now as we see 11 opportunities for investors to gradually accumulate 10 9 over the next few months. We expect the sector to re- 8 rate again in late 3Q, when a gradually improving 7 Mar-10 May-10 Mar-11 May-11 Mar-12 May-12 Jan-10 Jul-10 Sep-10 Nov-10 Jan-11 Jul-11 Sep-11 Nov-11 Jan-12 China economy stimulates VIP headline revenue growth again and Sands Cotai Central phase II opens. 1-yr Rolling forward EBITDA mutiple Mean  Key driver: We expect gaming revenue to grow 24% Source: J.P. Morgan. Bloomberg consensus estimates in 2012 and 18% in 2013. Stock views  Key risk: Slower-than-expected China economic P/E (x) growth as Macau is a leveraged China internal BB Code Rating Price PT FY12E FY13E consumption play. OW Galaxy Entertainment Group 27 HK OW 25 31 14.8 12.7  Stock picks: In the short term, we like SJM for its MGM China Holdings Ltd 2282 HK OW 13.4 18.0 10.2 10.5 defensiveness, in the medium term we like Galaxy for Sands China Ltd 1928 HK OW 27.65 30 25.3 15.2 earnings upgrades, and Sands China for its longer- SJM Holdings Limited 880 HK OW 16.5 21 12.9 10.9 term mass market story. Wynn Macau Ltd 1128 HK OW 20.2 25.8 15.5 13.4 Neutral Melco International Development 200 HK N 6.75 8.9 11.6 11.3 Source: Bloomberg, J.P. Morgan estimates. Priced as at 12 October 2012. 18
  • 19. Sean WuAC (852) 2800-8538 sean.wu@jpmorgan.com Healthcare J.P. Morgan Securities (Asia Pacific) Limited  Key investment points: Low spending as a part of GDP means considerable room for  The worst is likely over for the drug sector growth  Pricing pressure rising for medical - Expected healthcare spending as % of GDP to go up to 10% by 2020E consumable but should be manageable  Fundamentals of the healthcare industry stay 1,900.0 Healthcare Spending % of GDP Y/Y Growth 1,980.0 35% strong - remain positive in the longer term 1,700.0 1,611.9 30% 1,500.0 1,453.5 25%  Key drivers: 1) new healthcare reform 1,300.0 1,157.4 20% 12th initiatives, 2) five-year plan fostering 1,100.0 866.0 984.3 15% 900.0 industry consolidation, and 3) potential 700.0 658.4 759.0 10% 579.0 corrections to Anhui EDL tendering 500.0 367.9 404.8 458.7 502.6 5% 319.7 300.0 0% 1980 1981 1982 1983 1984 1985 1986 1987 1988 1989 1990 1991 1992 1993 1994 1995 1996 1997 1998 1999 2000 2001 2002 2003 2004 2005 2006 2007 2008 2009 2010  Key issues / risks: 1) Further price cuts, 2) Source: China Statistics Bureau. Adoption of DRG reimbursement, and 3) channel markup rule change  OW on The United Laboratoeis – a high-beta play with commodity prices recovering. Stock views P/E (x)  OW on Sino Biopharm– the best and most BB Code Rating Price PT FY12E FY13E OW balanced product portfolio and pipeline, in Sino Biopharmaceutical 1177 HK OW 2.91 3.6 19.5 16.5 our view The United Laboratories 3933 HK OW 4.05 4.5 21.3 12.0 UW  UW on China Shineway: 1) strong exposure China Shineway 2877 HK UW 10.9 12 10.1 9.2 to EDL; 2) adverse effects of TCM injections Source: J.P. Morgan estimates. Prices are as of 12 October 2012 19
  • 20. Karen Li, CFAAC (852) 2800-8589 Infrastructure karen.yy.li@jpmorgan.com J.P. Morgan Securities (Asia Pacific) Limited Investment thesis: Key issues / risks:  Infra capex: Key beneficiaries of increasing govn't  For infra operators in China, the key challenge is on the capex in China may be in two sectors: transport margin front as cost inflation continues despite softening infra and social housing. We expect rail capex to top-line volume growth (if any) and inability of tariff recover from end-2Q’12, to benefit names adjustments. including CRG, CRCC, CCCC, CSR, CSC, HOLI,  For E&C sector in Asia region, the key concern is IJM, WIKA. whether inflation would return to haunt, resulting in  Machinery: Though valuation seems cheap, we sooner-than-expected ending of current stimulus remain concerned about cash flow and receivable measures of policy easing. collection; hence Neutral on Zoomlion, Lonking and Sany Heavy. Key calls:   Port operators have rebounded substantially P/E Next Yr YTD. We like HPH Trust for yield and Adani Company Name BB Code Rating Price PT FY2012E FY2013E EPS Y/Y Ports for growth. Hutchinson Port Trust HPHT SP OW 0.79 1 25.3 21.0 7.1  Tollroads, we believe, are defensive plays with CMHI 144 HK UW 23.6 20 13.2 12.7 -21.1 solid cash generation, healthy balance sheet and CCCC 1800 HK OW 6.71 11 6.5 6.0 5.6 decent yield. Operators are likely to benefit from CRCC 1186 HK OW 7.49 8.5 8.6 7.3 11.4 lifting of policy overhang at end-May as the sector CRG 390 HK OW 3.68 4.1 8.8 7.9 8.0 clean-up work comes to an end. Most Chinese CSR Corp Ltd. 1766 HK OW 5.66 9.3 13.2 10.2 7.5 names are good yield plays, in our view. Hollysys Automation HOLI US OW 10.331 13 10.1 9.2 35.8  Airports: Beijing Capital Airport's growth Zhejiang Expressway 576 HK OW 5.54 7.1 11.4 12.3 -4.9 potential has been long overlooked while concerns Beijing Capital Int'l Airport 694 HK OW 5.26 8.3 13.3 10.8 25.1 may be overblown on the construction of the 2nd WCT WCT MK OW 2.72 3.1 12.0 10.3 12.7 airport in Beijing. We also believe MAHB looks IJM Corporation IJM MK OW 5.06 5.8 16.6 13.9 19.0 interesting as KLIA II will be operational in Wijaya Karya WIKA IJ N 1330 1290 19.1 14.1 21.9 2012/2013. Samsung Engineering 028050 KS OW 170000 260000 10.8 9.9 22.9  Stock picks in China: BCIA, CSR, CCCC, CRG, GS E&C 006360 KS N 70000 80000 10.0 9.5 -15.7 CRCC Hollysys, Hutch Ports, Zhejiang Exy, and Adani Ports ADSEZ IN OW 125.4 160 24.0 17.7 13.9 selected machinery names. Outside China, our top Source: Bloomberg, J.P. Morgan estimates. picks in the region include: IJM, Wijaya Karya, Note: Share prices and valuations are as of October 12, 2012. Adani Ports, Samsung E&C and GS E&C. 20