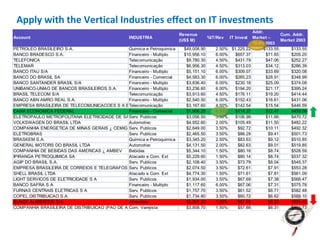
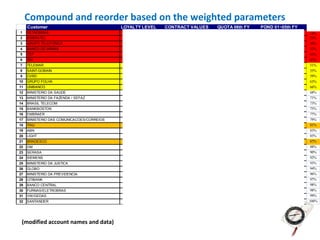
SlideShare a Scribd company logo
1 of 28
Beyond São Paulo and Mexico city: How Do You Segment Your
               Market Opportunities and Design Your Coverage
Model?

André Echeverria
LA Marketing VP
The 1 Billion U$ questions:

  Which markets must we concentrate on?
Which are the most efficient coverage models?
How do we find, develop and fit my Partners in?

       How many accounts to serve?
      Which are those target accounts?
             Where are them?
1 Sub-Continent, 28 Countries

500M+ people, 4 major languages

              MEX          C&CA

     mexico                            porto rico

                               NOLA
                                                     brasilia


              bogota
                                        BRA

                                                     sao paulo

                                SOLA
              Lima

                                                     rio janeiro


                    santiago          buenos aires
Country Profiles or Fortune 500-type Rankings
                 …not enough
…at least…
…not enough UNIQUE!
LA Markets Maturity Level Analysis

                                                                  China
                                                                                   Size of bubble = 2010 IT
                                                                           India
                                                                  Russia           spending value (US$M)
IT spending 2009-2010 Growth


                                                2010 IT spending as a % of GDP
        Source: IDC Latin America IT Spending Patterns, Q4 2010
     © 2010 IDC
Latin America IT Spending by Industry

                                                                              Free trade between LA countries
                                                                      Local investment to equalize Asian product levels
                         Consumption reactivation                       Commodities exporters leading the recovery
                     Retail growth / New retails entering
% Growth 2009/2010


                                                                                                                  6.3%
                                                                                                                 growth


                                                                                               Tourism reactivation
                                                                                             Outsourcing growth in the
                                                                                            local and off-shore markets


                       Relative Size of IT Spending, 2010

    Source: IDC Latin America Vertical Markets Spending Patterns, 1H 2009

   © 2010 IDC
Latin America Product Segments Maturity


© 2010 IDC
Building your Racing Plan:
Segmenting Market Opportunities
A key concept: the Addressable Market definition

o Available market where your portfolio of products and
  services offer concrete potential, not likelihood, to
  address customers needs
o What would your business value be if you had 100%
  market share in all areas where your products/services
  provide a solution?
o Key to Accounts Segmentation and SOW (Account Share
  of Wallet) calculations
o Standardized on IDC data: BlackBook Taxonomy (industry
  definitions) and WW Vertical Market definitions (product
  segments)
o But... You have to make your own assumptions
Addressable Market Calculator (TM)
Input:          IDC IT Data                                       Input:
          2001 <- Year                             IT Market        Addressable   Addressable Market        1-Year                                Original Estimates
         Brazil <- Market                        (No DataCom)          Market                               Growth    Brazil      Mexico      Argentin  Chile    Colombia Venezuel PuertoR
         13780 <- Total IT Market Value (U$ M)            12567      Assumption      %           $            %

               Services
          4.4% IT Consulting                              4.8%         15%            0.7%           90.9    15.7%     30%            20%      50%      25%       0%        0%      0%
          9.6% Operations Management                     10.5%                                               14.3%                                                          0%      0%
          2.8% Training and Education                     3.1%         15%            0.5%         57.9      13.1%     20%            10%      40%      30%       40%       20%     20%
          9.3% Support Services                          10.2%         8%             0.8%        102.5      10.7%     15%            15%      10%      10%       40%       20%     20%
          9.9% Implementation                            10.9%         5%             0.5%         68.2      13.9%     10%            5%                10%       0%        0%      0%
         36.0% Services Total                            39.5%                        2.5%        319.6      13.4%
                                                                        6%                                               12%          9%          9%       10%         9%      8%     11%
               Packaged Software
          3.3% System Infrastructure                      3.6%         10%            0.4%           45.5    11.5%     20%            10%      20%      25%       20%       20%     20%
          5.7% Application Tools                          6.3%         5%             0.3%           39.3     8.7%     10%                     10%      5%        10%       10%     10%
          4.2% Application Solutions                      4.6%                                               16.9%
         13.2% Packaged Software Total                   14.5%                           0.7%        84.7    12.4%
                                                                        5%                                                   9%       4%       10%          6%         9%     11%     11%
               Hardware
               Systems
          2.2% High-End Servers                           2.4%          75%           1.8%        227.4      -1.6%    100%        100%         100%     100%     100%       100%    100%
          1.9% Mid-Range Servers                          2.1%         100%           2.1%        261.8       2.9%    100%        100%         100%     100%     100%       100%    100%
          1.2% Low-End Non-Intel Servers                  1.3%          40%           0.5%         66.1       5.4%    100%         50%         100%     100%     100%       100%    100%
          1.8% Low-End Intel Servers                      2.0%          10%           0.2%                   10.5%     20%         20%          20%               30%        20%     10%
         24.4% Personal Computers                        26.8%                                               11.4%                 1%
          0.7% Traditional Workstations                   0.8%         60%            0.5%         57.9       1.8%    100%        100%         100%     100%     100%       100%    100%
         32.2% Systems Total                             35.3%                        5.1%        613.2       9.9%

               Peripherals and Add-Ons
          4.0% Add-On Storage Devices                     4.4%         60%            2.6%        330.7      16.8%    100%            80%               100%     100%       100%    100%
          4.0% Desktop Printers                           4.4%                                                5.4%
          0.8% Other Printers                             0.9%                                                5.2%
          1.0% Other Add-Nos                              1.1%                                                8.0%                             100%
          9.8% Peripherals Total                         10.7%                           2.6%     330.7       9.1%
                                                                       17%                                               25%          16%      15%         15%      24%       17%     12%

          8.8% Data Communications                        0.0%                                               24.6%
                                                                                                                        Market Evolution
         50.8% Hardware Total                            46.1%                        7.7%        943.9       12.1%
                                                                                                                      100%
         13.2% Package Software Total                    14.5%                        0.7%         84.7       12.4%
         36.0% Services Total                            39.5%                        2.5%        319.6       13.4%   90%
                                                                                                                      80%

                                                                                  10.9% 1348.2 13.2%                  70%

                                                                                  Address       U$ M          %       60%
                                                                                                                      50%
                                                                                                                      40%
                                                                                                                      30%
                                                                                                                      20%
                                                                                                                      10%
                                                                                                                       0%
                                                                                                                               2002    2007
Apply with the Vertical Industries effect on IT investments
                                                                                                           Addr.
                                                                       Revenue                                          Cum. Addr.
Account                                         INDUSTRIA                            %IT/Rev   IT Invest   Market –
                                                                       (US$ M)                                          Market 2003
                                                                                                           10.9% 2003
PETROLEO BRASILEIRO S.A.                      Quimica e Petroquimica    $49,008.90      2.50% $1,225.22         $133.55     $133.55
BANCO BRADESCO S.A.                           Financeiro - Multiplo     $10,956.10      6.00%   $657.37          $71.65     $205.20
TELEFONICA                                    Telecomunicação            $9,780.30      4.50%   $431.79          $47.06     $252.27
TELEMAR                                       Telecomunicação            $6,956.30      4.50%   $313.03          $34.12     $286.39
BANCO ITAU S/A                                Financeiro - Multiplo      $5,151.10      6.00%   $309.07          $33.69     $320.08
BANCO DO BRASIL SA                            Financeiro - Comercial     $4,583.30      6.00%   $265.23          $28.91     $348.99
BANCO SANTANDER BRASIL S/A                    Financeiro - Multiplo      $3,836.40      6.00%   $230.18          $25.09     $374.08
UNIBANCO-UNIAO DE BANCOS BRASILEIROS S.A.     Financeiro - Multiplo      $3,236.60      6.00%   $194.20          $21.17     $395.24
BRASIL TELECOM S/A                            Telecomunicação            $3,913.60      4.50%   $176.11          $19.20     $414.44
BANCO ABN AMRO REAL S.A.                      Financeiro - Multiplo      $2,540.50      6.00%   $152.43          $16.61     $431.06
EMPRESA BRASILEIRA DE TELECOMUNICACOES S A EMBRATE
                                              Telecomunicação            $3,167.60      4.50%   $142.54          $15.54     $446.59
CAIXA ECONOMICA FEDERAL                       Financeiro - Comercial     $1,906.20      6.00%   $114.37          $12.47     $459.06
ELETROPAULO METROPOLITANA ELETRICIDADE DE SAO PAUL
                                              Serv. Publicos             $3,056.50      3.50%   $106.98          $11.66     $470.72
VOLKSWAGEN DO BRASIL LTDA                     Automotivo                 $4,952.60      2.00%   $105.49          $11.50     $482.22
COMPANHIA ENERGETICA DE MINAS GERAIS ¿ CEMIG Serv. Publicos              $2,649.00      3.50%    $92.72          $10.11     $492.32
ELETROBRAS                                    Serv. Publicos             $2,465.50      3.50%    $86.29           $9.41     $501.73
BRASKEM S.A.                                  Quimica e Petroquimica     $3,345.20      2.50%    $83.63           $9.12     $510.85
GENERAL MOTORS DO BRASIL LTDA                 Automotivo                 $4,131.50      2.00%    $82.63           $9.01     $519.85
COMPANHIA DE BEBIDAS DAS AMERICAS ¿ AMBEV     Bebidas                    $5,344.10      1.50%    $80.16           $8.74     $528.59
IPIRANGA PETROQUIMICA SA                      Atacado e Com. Ext         $5,229.60      1.50%    $80.14           $8.74     $537.32
AGIP DO BRASIL S.A.                           Serv. Publicos             $2,108.40      3.50%    $73.79           $8.04     $545.37
EMPRESA BRASILEIRA DE CORREIOS E TELEGRAFOS Serv. Publicos               $2,074.50      3.50%    $72.61           $7.91     $553.28
SHELL BRASIL LTDA                             Atacado e Com. Ext         $4,774.30      1.50%    $71.61           $7.81     $561.09
LIGHT SERVICOS DE ELETRICIDADE S A            Serv. Publicos             $1,934.00      3.50%    $67.69           $7.38     $568.47
BANCO SAFRA S A                               Financeiro - Multiplo      $1,117.60      6.00%    $67.06           $7.31     $575.78
FURNAS CENTRAIS ELETRICAS S A                 Serv. Publicos             $1,757.70      3.50%    $61.52           $6.71     $582.48
COPEL DISTRIBUICAO S.A.                       Serv. Publicos             $1,734.80      3.50%    $60.72           $6.62     $589.10
BUNGE ALIMENTOS S/A                           Alimentos                  $5,591.30      1.50%    $57.99           $6.32     $595.42
COMPANHIA BRASILEIRA DE DISTRIBUICAO (PAO DE ACUCA Varejista
                                              Com.                       $3,858.70      1.50%    $57.88           $6.31     $601.73
Refining your Model:
Customer Loyalty does make a difference
What if we concentrate our coverage resources?


How should we compare Key Accounts opportunity levels?
On a mid to long term strategy!

•   Revenue historical series (weighted)
•   Future contract values
•   Share of Wallet x competition analysis
•   Services Attach rates
•   Customer Satisfaction index
•   Opt-in Programs members
•   Number of reference Executives
•   Customer Lifetime Value TM

• …and avoid the “Mermaid” Accounts
Analyze your Customer Loyalty levels

                   Customer Lifetime ValueTM


                    model, Dr. Peter Wilton
                                               Business
   Attitudinal                                 Partner
   Loyalty

Behavioural
Loyalty

                                               Client

                                               Customer
  Prospect
Compound and reorder based on the weighted parameters
     Customer                               LOYALTY LEVEL   CONTRACT VALUES   QUOTA 06th FY   POND 01~05th FY
1    PETROBRAS                                    4              19.0%            19.0%            23.0%         14%
2    EMBRATEL                                     3              13.8%            10.5%            5.9%          23%
3    GRUPO TELEFONICA                             2               9.9%            13.5%            10.7%         30%
4    BANCO DO BRASIL                              4               5.7%            8.4%             7.5%          37%
5    CEF                                          4               6.2%            5.2%             7.3%          43%
6    TIM                                          2               3.9%            5.2%             7.1%          47%
7    TELEMAR                                      2               4.1%            4.6%             7.4%          51%
8    SAINT-GOBAIN                                 4               4.4%            0.5%             1.0%          55%
9    CVRD                                         3               2.8%            3.9%             3.6%          59%
10   GRUPO FOLHA                                  3               2.3%            1.3%             6.9%          63%
11   UNIBANCO                                     2               3.9%            3.3%             0.8%          66%
12   MINISTERIO DA SAUDE                          2               3.3%            0.0%             1.4%          68%
13   MINISTERIO DA FAZENDA / SEFAZ                2               1.8%            1.3%             2.3%          71%
14   BRASIL TELECOM                               2               1.1%            2.4%             2.2%          73%
15   BANKBOSTON                                   2               2.8%            0.4%             0.8%          75%
16   EMBRAER                                      2               2.4%            1.0%             0.8%          77%
17   MINISTERIO DAS COMUNICACOES/CORREIOS         2               1.2%            2.6%             0.1%          79%
18   ITAU                                         1               2.4%            2.6%             0.6%          81%
19   ABN                                          1               2.9%            1.3%             1.1%          83%
20   LIGHT                                        2               1.0%            0.7%             1.2%          85%
21   BRADESCO                                     1               0.9%            4.7%             0.5%          87%
22   GM                                           2               0.5%            0.7%             1.9%          88%
23   SERASA                                       2               0.7%            0.7%             1.0%          90%
24   SIEMENS                                      2               0.2%            0.7%             2.1%          92%
25   MINISTERIO DA JUSTICA                        2               0.0%            0.0%             0.7%          93%
26   GLOBO                                        1               1.3%            0.7%             1.3%          94%
27   MINISTERIO DA PREVIDENCIA                    2               0.0%            0.0%             0.0%          96%
28   CITIBANK                                     1               0.5%            1.3%             0.4%          97%
29   BANCO CENTRAL                                1               0.2%            1.6%             0.0%          98%
30   FURNAS/ELETROBRAS                            1               0.5%            0.7%             0.2%          98%
31   VW/GEDAS                                     1               0.1%            1.0%             0.2%          99%
32   SANTANDER                                    1               0.0%            0.4%             0.2%         100%


 (modified account names and data)
The courageous decision: from 30 Direct Coverage Accounts…


●
 Petrobras                    ●
                                Telefonica      ●
                                                  Caixa Econom Federal
●
 CVRD                         ●
                                Bradesco        ●
                                                  Banco do Brasil
●
 Telemar
                              ●
                                Itau            ●
                                                  Banco Central
●
 TIM
                              ●
                                Unibanco        ●
                                                  Min. of Fin/Sefaz/Serpro
●
 Embratel
                              ●
                                GM      Telco   ●
                                                  Min. of Just/TJs
●
 Light                        ●
                                VW/Gedas        ●
                                                  Min. of Comun/Correios
●
 Globo                        ●
                                Embraer         ●
                                                  Min. of Social Security
●
 Furnas                       ●
                                Saint Gobain    ●
                                                  Brasil Telecom
                              ●
                                BankBoston
                              ●
                                ABN
                              ●
                                Santander
                              ●
                                Citibank
                              ●
                                Serasa
                              ●
                                UOL/Folha
                              ●
                                Siemens


    (modified account names and data)
The courageous decision: to 13 Direct Coverage Accounts only


●
 Petrobras                    ●
                                Telefonica     ●
                                                 Caixa Econom Federal
●
 TIM
                              ●
                                Unibanco       ●
                                                 Banco do Brasil
●
 Embratel                     ●
                                Saint Gobain
●
 CVRD                         ●
                                UOL/Folha
●
 Telemar
                              ●
                                Bradesco
                              ●
                                Itau


    (modified account names and data)
Adjusting Accounts x Partners Coverage Model

         Account Management                 AMM
         Relational Sales Process    13
         Client driven
                                     17    P-AMM


    Territory Management
    Transactional Sales Process
     Opportunity driven             400      EMM


 Channel Management
Transactional Sales Process
 Product driven
                                    Open     CDP
Sharing and Selling the Opportunity to your Partners


          Actual Revenue Addressable Mkt Share of Opportunity New Addressable Mkt
Account        76%          U$ 660M               17%              U$ 430M
Territory       7%          U$ 315M               3%               U$ 650M
Channel        17%
Geographic Coverage Models


                        2%


                                                 6%
                             11%
                                      8%


  U$ 650M                      15%
                                     27%
                                           18%

  opportunity
                               8%
Finding your right Partners


o Take advantage of your regional executives knowledge
o Existent partners from your pre-entry or pre-acquisition
o Leverage local markets information services
    o Channel analysts surveys
    o Channel and general IT ranking publications
    o Channel oriented publications
o   Review public bids announcements
o   IT solution oriented events and associations
o   Social Media is removing relationship barriers
o   Don't forget… asking for references from your customers
Results achieved (over two sequential years)


o U$ U32M (+78%) growth in booking levels from Direct
  coverage accounts
o U$ 18M (3.7x) growth in booking levels from Partners
  coverage accounts under the company relationship
  leadership
o Increased participation in the share of wallet at the
  selected Direct coverage accounts
o Partners achieved margin and cash flow levels necessary
  to fund the technical readiness and regional sales
  coverage investments
Final Recommendations

o Invest time on segmenting your opportunities
o Make your choices and stick to it for 1 or 2
  years at least
o Don’t change your key accounts too
  frequently; your customer will notice and
  tacking breaks boat momentum
o Customers need to trust you to share strategic,
  long term projects
o Partners need to trust on your commitments
  to support capacity building investments
o Consistency builds trust
o Yes... It takes courage (analytical self confidence)
aecheverria@uol.com.br

More Related Content

What's hot

Facing the forces of change survey results segmented by total sales_october ...
Facing the forces of change  survey results segmented by total sales_october ...Facing the forces of change  survey results segmented by total sales_october ...
Facing the forces of change survey results segmented by total sales_october ...Guy Blissett
 
CMD2012 - vetlana Skvortsova - Inessa Galaktionova - Market Area Russia
CMD2012 - vetlana Skvortsova - Inessa Galaktionova - Market Area RussiaCMD2012 - vetlana Skvortsova - Inessa Galaktionova - Market Area Russia
CMD2012 - vetlana Skvortsova - Inessa Galaktionova - Market Area RussiaTele2
 
Hemas investor presentation june 2011
Hemas investor presentation june 2011Hemas investor presentation june 2011
Hemas investor presentation june 2011sivanoly
 
Handling the boom in international commerce
Handling the boom in international commerceHandling the boom in international commerce
Handling the boom in international commerceX.commerce
 
China Mvas Changing Environment 2007
China Mvas Changing Environment 2007China Mvas Changing Environment 2007
China Mvas Changing Environment 2007Bruno Bensaid
 
IIM C - 221 B Baker Street
IIM C - 221 B Baker StreetIIM C - 221 B Baker Street
IIM C - 221 B Baker Streetlehartawde
 
TIM FIber Day Presentation
TIM FIber Day PresentationTIM FIber Day Presentation
TIM FIber Day PresentationTIM RI
 
Safaricom 2010 Results Announcement
Safaricom 2010 Results AnnouncementSafaricom 2010 Results Announcement
Safaricom 2010 Results AnnouncementKennedy
 
sonic automotive SAHStephens20June20Conference20Presentation
sonic automotive SAHStephens20June20Conference20Presentationsonic automotive SAHStephens20June20Conference20Presentation
sonic automotive SAHStephens20June20Conference20Presentationfinance43
 
Small Business Adoption of Payroll Direct Deposit
Small Business Adoption of Payroll Direct DepositSmall Business Adoption of Payroll Direct Deposit
Small Business Adoption of Payroll Direct DepositPaul McAdam
 
Real estatemarketreport 1q12
Real estatemarketreport 1q12Real estatemarketreport 1q12
Real estatemarketreport 1q12Dennis_De_Vera
 
Real estatemarketreport 1q12
Real estatemarketreport 1q12Real estatemarketreport 1q12
Real estatemarketreport 1q12Dennis_De_Vera
 
B-Onn PPT
B-Onn PPTB-Onn PPT
B-Onn PPTB-Onn .
 
MITX's Digital State of the State Report
MITX's Digital State of the State ReportMITX's Digital State of the State Report
MITX's Digital State of the State ReportMITX
 
Mobile Marketing India
Mobile Marketing   IndiaMobile Marketing   India
Mobile Marketing IndiaSaumen Ray
 

What's hot (18)

Facing the forces of change survey results segmented by total sales_october ...
Facing the forces of change  survey results segmented by total sales_october ...Facing the forces of change  survey results segmented by total sales_october ...
Facing the forces of change survey results segmented by total sales_october ...
 
CMD2012 - vetlana Skvortsova - Inessa Galaktionova - Market Area Russia
CMD2012 - vetlana Skvortsova - Inessa Galaktionova - Market Area RussiaCMD2012 - vetlana Skvortsova - Inessa Galaktionova - Market Area Russia
CMD2012 - vetlana Skvortsova - Inessa Galaktionova - Market Area Russia
 
Hemas investor presentation june 2011
Hemas investor presentation june 2011Hemas investor presentation june 2011
Hemas investor presentation june 2011
 
Handling the boom in international commerce
Handling the boom in international commerceHandling the boom in international commerce
Handling the boom in international commerce
 
China Mvas Changing Environment 2007
China Mvas Changing Environment 2007China Mvas Changing Environment 2007
China Mvas Changing Environment 2007
 
IIM C - 221 B Baker Street
IIM C - 221 B Baker StreetIIM C - 221 B Baker Street
IIM C - 221 B Baker Street
 
TIM FIber Day Presentation
TIM FIber Day PresentationTIM FIber Day Presentation
TIM FIber Day Presentation
 
Safaricom 2010 Results Announcement
Safaricom 2010 Results AnnouncementSafaricom 2010 Results Announcement
Safaricom 2010 Results Announcement
 
sonic automotive SAHStephens20June20Conference20Presentation
sonic automotive SAHStephens20June20Conference20Presentationsonic automotive SAHStephens20June20Conference20Presentation
sonic automotive SAHStephens20June20Conference20Presentation
 
Presentation 2Q10
Presentation 2Q10Presentation 2Q10
Presentation 2Q10
 
Small Business Adoption of Payroll Direct Deposit
Small Business Adoption of Payroll Direct DepositSmall Business Adoption of Payroll Direct Deposit
Small Business Adoption of Payroll Direct Deposit
 
Real estatemarketreport 1q12
Real estatemarketreport 1q12Real estatemarketreport 1q12
Real estatemarketreport 1q12
 
3 q08
3 q083 q08
3 q08
 
Real estatemarketreport 1q12
Real estatemarketreport 1q12Real estatemarketreport 1q12
Real estatemarketreport 1q12
 
Carriers & OTTs
Carriers & OTTsCarriers & OTTs
Carriers & OTTs
 
B-Onn PPT
B-Onn PPTB-Onn PPT
B-Onn PPT
 
MITX's Digital State of the State Report
MITX's Digital State of the State ReportMITX's Digital State of the State Report
MITX's Digital State of the State Report
 
Mobile Marketing India
Mobile Marketing   IndiaMobile Marketing   India
Mobile Marketing India
 

Viewers also liked

AES 3Q 2005 Form10QA
AES 3Q 2005 Form10QAAES 3Q 2005 Form10QA
AES 3Q 2005 Form10QAfinance19
 
AES 2Q 2005 Form10-Q
AES 2Q 2005 Form10-QAES 2Q 2005 Form10-Q
AES 2Q 2005 Form10-Qfinance19
 
AES 1q200210q
AES 1q200210qAES 1q200210q
AES 1q200210qfinance19
 
Servico social 2a (1)
Servico social 2a (1)Servico social 2a (1)
Servico social 2a (1)Léia Mayer
 
AES 2Q 2006 Form10Q
AES 2Q 2006 Form10QAES 2Q 2006 Form10Q
AES 2Q 2006 Form10Qfinance19
 
Fusions-acquisitions dans le secteur des services financiers (2011)
Fusions-acquisitions dans le secteur des services financiers (2011)Fusions-acquisitions dans le secteur des services financiers (2011)
Fusions-acquisitions dans le secteur des services financiers (2011)PwC France
 
AES 203Q 20200520 Form2010-Q
AES 203Q 20200520 Form2010-QAES 203Q 20200520 Form2010-Q
AES 203Q 20200520 Form2010-Qfinance19
 
Ratan Tata lays foundation stone for NAIC in the UK
Ratan Tata lays foundation stone for NAIC in the UKRatan Tata lays foundation stone for NAIC in the UK
Ratan Tata lays foundation stone for NAIC in the UKRushLane
 
AES_2Q_2007_Form10Q
AES_2Q_2007_Form10QAES_2Q_2007_Form10Q
AES_2Q_2007_Form10Qfinance19
 
IBM Netcool: Smarter Energy and Utilities 130910
IBM Netcool: Smarter Energy and Utilities 130910IBM Netcool: Smarter Energy and Utilities 130910
IBM Netcool: Smarter Energy and Utilities 130910Mark Anderson
 
N R Narayana Murthy
N R Narayana MurthyN R Narayana Murthy
N R Narayana MurthyLibu Thomas
 
Gender diference final
Gender diference finalGender diference final
Gender diference finalRuqaiya Vasi
 
Memorandum0303
Memorandum0303Memorandum0303
Memorandum0303nikkshah
 
Infosys (seminar)
Infosys (seminar)Infosys (seminar)
Infosys (seminar)Yash Bhati
 

Viewers also liked (20)

AES 3Q 2005 Form10QA
AES 3Q 2005 Form10QAAES 3Q 2005 Form10QA
AES 3Q 2005 Form10QA
 
AES 2Q 2005 Form10-Q
AES 2Q 2005 Form10-QAES 2Q 2005 Form10-Q
AES 2Q 2005 Form10-Q
 
AES 1q200210q
AES 1q200210qAES 1q200210q
AES 1q200210q
 
Servico social 2a (1)
Servico social 2a (1)Servico social 2a (1)
Servico social 2a (1)
 
AES 2Q 2006 Form10Q
AES 2Q 2006 Form10QAES 2Q 2006 Form10Q
AES 2Q 2006 Form10Q
 
Fusions-acquisitions dans le secteur des services financiers (2011)
Fusions-acquisitions dans le secteur des services financiers (2011)Fusions-acquisitions dans le secteur des services financiers (2011)
Fusions-acquisitions dans le secteur des services financiers (2011)
 
AES 10Q
AES 10QAES 10Q
AES 10Q
 
AES 203Q 20200520 Form2010-Q
AES 203Q 20200520 Form2010-QAES 203Q 20200520 Form2010-Q
AES 203Q 20200520 Form2010-Q
 
Business ethics
Business ethicsBusiness ethics
Business ethics
 
AES1Q 2005
AES1Q 2005AES1Q 2005
AES1Q 2005
 
Ratan Tata lays foundation stone for NAIC in the UK
Ratan Tata lays foundation stone for NAIC in the UKRatan Tata lays foundation stone for NAIC in the UK
Ratan Tata lays foundation stone for NAIC in the UK
 
AES_2Q_2007_Form10Q
AES_2Q_2007_Form10QAES_2Q_2007_Form10Q
AES_2Q_2007_Form10Q
 
Yc june 13
Yc june 13Yc june 13
Yc june 13
 
Case # 3
Case # 3Case # 3
Case # 3
 
IBM Netcool: Smarter Energy and Utilities 130910
IBM Netcool: Smarter Energy and Utilities 130910IBM Netcool: Smarter Energy and Utilities 130910
IBM Netcool: Smarter Energy and Utilities 130910
 
N R Narayana Murthy
N R Narayana MurthyN R Narayana Murthy
N R Narayana Murthy
 
Infinitytech
InfinitytechInfinitytech
Infinitytech
 
Gender diference final
Gender diference finalGender diference final
Gender diference final
 
Memorandum0303
Memorandum0303Memorandum0303
Memorandum0303
 
Infosys (seminar)
Infosys (seminar)Infosys (seminar)
Infosys (seminar)
 

Similar to How to Segment Latin American Markets and Design an Efficient Coverage Model

Idc Mass Tlc March 18 2010 Final
Idc Mass Tlc March 18 2010 FinalIdc Mass Tlc March 18 2010 Final
Idc Mass Tlc March 18 2010 FinalChristine Nolan
 
21/10/2012 - ASSESPRO Bid WCIT 2012 Presentation
21/10/2012 - ASSESPRO Bid WCIT 2012 Presentation21/10/2012 - ASSESPRO Bid WCIT 2012 Presentation
21/10/2012 - ASSESPRO Bid WCIT 2012 PresentationAssespro Nacional
 
The rules of mobile advertising
The rules of mobile advertisingThe rules of mobile advertising
The rules of mobile advertisingSeungyul Kim
 
Analysis of Revenue guidance - Infosys
Analysis of Revenue guidance - InfosysAnalysis of Revenue guidance - Infosys
Analysis of Revenue guidance - InfosysSarasvathi T.A
 
CASMA Globant Mobile Presentation
CASMA Globant Mobile PresentationCASMA Globant Mobile Presentation
CASMA Globant Mobile PresentationAndrew Burgert
 
Roadshow Europe Sponge - Alex meisl
Roadshow Europe Sponge - Alex meisl Roadshow Europe Sponge - Alex meisl
Roadshow Europe Sponge - Alex meisl mobilesquared Ltd
 
Growing Your Business - Autotask ChannelNext
Growing Your Business - Autotask ChannelNextGrowing Your Business - Autotask ChannelNext
Growing Your Business - Autotask ChannelNextJay McBain
 
M&A In Software Products Sector
M&A In Software Products SectorM&A In Software Products Sector
M&A In Software Products SectorNaufal Kukkady
 
Aop Mobile Insights by Tim Cain - Incisive Create Mobile Strategies
Aop Mobile Insights by Tim Cain - Incisive Create Mobile StrategiesAop Mobile Insights by Tim Cain - Incisive Create Mobile Strategies
Aop Mobile Insights by Tim Cain - Incisive Create Mobile StrategiesIncisive Create
 
State of online marketing april 2011
State of online marketing april 2011State of online marketing april 2011
State of online marketing april 2011Linda Gridley
 
Becoming iConic-Applying Apple's Principles Dallas Diggs at The Connective Hub
Becoming iConic-Applying Apple's Principles  Dallas Diggs at The Connective HubBecoming iConic-Applying Apple's Principles  Dallas Diggs at The Connective Hub
Becoming iConic-Applying Apple's Principles Dallas Diggs at The Connective HubDallas Diggs
 
2012 Connell & Partners Fall Pulse Survey Participant Report
2012 Connell & Partners Fall Pulse Survey Participant Report2012 Connell & Partners Fall Pulse Survey Participant Report
2012 Connell & Partners Fall Pulse Survey Participant ReportConnell & Partners
 
SIM Partners - Mobile Marketing Capabilities
SIM Partners - Mobile Marketing CapabilitiesSIM Partners - Mobile Marketing Capabilities
SIM Partners - Mobile Marketing CapabilitiesSIM Partners
 
OMMA Display 2011 -- Transformation of the Measurement Industry: How Much Can...
OMMA Display 2011 -- Transformation of the Measurement Industry: How Much Can...OMMA Display 2011 -- Transformation of the Measurement Industry: How Much Can...
OMMA Display 2011 -- Transformation of the Measurement Industry: How Much Can...Linda Gridley
 

Similar to How to Segment Latin American Markets and Design an Efficient Coverage Model (20)

Idc Mass Tlc March 18 2010 Final
Idc Mass Tlc March 18 2010 FinalIdc Mass Tlc March 18 2010 Final
Idc Mass Tlc March 18 2010 Final
 
21/10/2012 - ASSESPRO Bid WCIT 2012 Presentation
21/10/2012 - ASSESPRO Bid WCIT 2012 Presentation21/10/2012 - ASSESPRO Bid WCIT 2012 Presentation
21/10/2012 - ASSESPRO Bid WCIT 2012 Presentation
 
The rules of mobile advertising
The rules of mobile advertisingThe rules of mobile advertising
The rules of mobile advertising
 
Analysis of Revenue guidance - Infosys
Analysis of Revenue guidance - InfosysAnalysis of Revenue guidance - Infosys
Analysis of Revenue guidance - Infosys
 
CASMA Globant Mobile Presentation
CASMA Globant Mobile PresentationCASMA Globant Mobile Presentation
CASMA Globant Mobile Presentation
 
Roadshow Europe Sponge - Alex meisl
Roadshow Europe Sponge - Alex meisl Roadshow Europe Sponge - Alex meisl
Roadshow Europe Sponge - Alex meisl
 
Growing Your Business - Autotask ChannelNext
Growing Your Business - Autotask ChannelNextGrowing Your Business - Autotask ChannelNext
Growing Your Business - Autotask ChannelNext
 
M&A In Software Products Sector
M&A In Software Products SectorM&A In Software Products Sector
M&A In Software Products Sector
 
Korea fund4q presentation
Korea fund4q presentationKorea fund4q presentation
Korea fund4q presentation
 
Aop Mobile Insights by Tim Cain - Incisive Create Mobile Strategies
Aop Mobile Insights by Tim Cain - Incisive Create Mobile StrategiesAop Mobile Insights by Tim Cain - Incisive Create Mobile Strategies
Aop Mobile Insights by Tim Cain - Incisive Create Mobile Strategies
 
State of online marketing april 2011
State of online marketing april 2011State of online marketing april 2011
State of online marketing april 2011
 
Becoming iConic-Applying Apple's Principles Dallas Diggs at The Connective Hub
Becoming iConic-Applying Apple's Principles  Dallas Diggs at The Connective HubBecoming iConic-Applying Apple's Principles  Dallas Diggs at The Connective Hub
Becoming iConic-Applying Apple's Principles Dallas Diggs at The Connective Hub
 
2012 Connell & Partners Fall Pulse Survey Participant Report
2012 Connell & Partners Fall Pulse Survey Participant Report2012 Connell & Partners Fall Pulse Survey Participant Report
2012 Connell & Partners Fall Pulse Survey Participant Report
 
SIM Partners - Mobile Marketing Capabilities
SIM Partners - Mobile Marketing CapabilitiesSIM Partners - Mobile Marketing Capabilities
SIM Partners - Mobile Marketing Capabilities
 
Economics behind IT
Economics behind ITEconomics behind IT
Economics behind IT
 
Pepperdine cost of capital national summit 10 18 2011
Pepperdine cost of capital national summit 10 18 2011Pepperdine cost of capital national summit 10 18 2011
Pepperdine cost of capital national summit 10 18 2011
 
Pepperdine cost of capital national summit 10 18 2011
Pepperdine cost of capital national summit 10 18 2011Pepperdine cost of capital national summit 10 18 2011
Pepperdine cost of capital national summit 10 18 2011
 
Pepperdine cost of capital national summit 10 18 2011
Pepperdine cost of capital national summit 10 18 2011Pepperdine cost of capital national summit 10 18 2011
Pepperdine cost of capital national summit 10 18 2011
 
OMMA Display 2011 -- Transformation of the Measurement Industry: How Much Can...
OMMA Display 2011 -- Transformation of the Measurement Industry: How Much Can...OMMA Display 2011 -- Transformation of the Measurement Industry: How Much Can...
OMMA Display 2011 -- Transformation of the Measurement Industry: How Much Can...
 
The death of the click (с) Osnat Zaretsky
The death of the click (с) Osnat ZaretskyThe death of the click (с) Osnat Zaretsky
The death of the click (с) Osnat Zaretsky
 

How to Segment Latin American Markets and Design an Efficient Coverage Model

  • 1. Beyond São Paulo and Mexico city: How Do You Segment Your Market Opportunities and Design Your Coverage Model? André Echeverria LA Marketing VP
  • 2.
  • 3.
  • 4.
  • 5. The 1 Billion U$ questions: Which markets must we concentrate on? Which are the most efficient coverage models? How do we find, develop and fit my Partners in? How many accounts to serve? Which are those target accounts? Where are them?
  • 6. 1 Sub-Continent, 28 Countries 500M+ people, 4 major languages MEX C&CA mexico porto rico NOLA brasilia bogota BRA sao paulo SOLA Lima rio janeiro santiago buenos aires
  • 7. Country Profiles or Fortune 500-type Rankings …not enough
  • 9. LA Markets Maturity Level Analysis China Size of bubble = 2010 IT India Russia spending value (US$M) IT spending 2009-2010 Growth 2010 IT spending as a % of GDP Source: IDC Latin America IT Spending Patterns, Q4 2010 © 2010 IDC
  • 10. Latin America IT Spending by Industry Free trade between LA countries Local investment to equalize Asian product levels Consumption reactivation Commodities exporters leading the recovery Retail growth / New retails entering % Growth 2009/2010 6.3% growth Tourism reactivation Outsourcing growth in the local and off-shore markets Relative Size of IT Spending, 2010 Source: IDC Latin America Vertical Markets Spending Patterns, 1H 2009 © 2010 IDC
  • 11. Latin America Product Segments Maturity © 2010 IDC
  • 12. Building your Racing Plan: Segmenting Market Opportunities
  • 13. A key concept: the Addressable Market definition o Available market where your portfolio of products and services offer concrete potential, not likelihood, to address customers needs o What would your business value be if you had 100% market share in all areas where your products/services provide a solution? o Key to Accounts Segmentation and SOW (Account Share of Wallet) calculations o Standardized on IDC data: BlackBook Taxonomy (industry definitions) and WW Vertical Market definitions (product segments) o But... You have to make your own assumptions
  • 14. Addressable Market Calculator (TM) Input: IDC IT Data Input: 2001 <- Year IT Market Addressable Addressable Market 1-Year Original Estimates Brazil <- Market (No DataCom) Market Growth Brazil Mexico Argentin Chile Colombia Venezuel PuertoR 13780 <- Total IT Market Value (U$ M) 12567 Assumption % $ % Services 4.4% IT Consulting 4.8% 15% 0.7% 90.9 15.7% 30% 20% 50% 25% 0% 0% 0% 9.6% Operations Management 10.5% 14.3% 0% 0% 2.8% Training and Education 3.1% 15% 0.5% 57.9 13.1% 20% 10% 40% 30% 40% 20% 20% 9.3% Support Services 10.2% 8% 0.8% 102.5 10.7% 15% 15% 10% 10% 40% 20% 20% 9.9% Implementation 10.9% 5% 0.5% 68.2 13.9% 10% 5% 10% 0% 0% 0% 36.0% Services Total 39.5% 2.5% 319.6 13.4% 6% 12% 9% 9% 10% 9% 8% 11% Packaged Software 3.3% System Infrastructure 3.6% 10% 0.4% 45.5 11.5% 20% 10% 20% 25% 20% 20% 20% 5.7% Application Tools 6.3% 5% 0.3% 39.3 8.7% 10% 10% 5% 10% 10% 10% 4.2% Application Solutions 4.6% 16.9% 13.2% Packaged Software Total 14.5% 0.7% 84.7 12.4% 5% 9% 4% 10% 6% 9% 11% 11% Hardware Systems 2.2% High-End Servers 2.4% 75% 1.8% 227.4 -1.6% 100% 100% 100% 100% 100% 100% 100% 1.9% Mid-Range Servers 2.1% 100% 2.1% 261.8 2.9% 100% 100% 100% 100% 100% 100% 100% 1.2% Low-End Non-Intel Servers 1.3% 40% 0.5% 66.1 5.4% 100% 50% 100% 100% 100% 100% 100% 1.8% Low-End Intel Servers 2.0% 10% 0.2% 10.5% 20% 20% 20% 30% 20% 10% 24.4% Personal Computers 26.8% 11.4% 1% 0.7% Traditional Workstations 0.8% 60% 0.5% 57.9 1.8% 100% 100% 100% 100% 100% 100% 100% 32.2% Systems Total 35.3% 5.1% 613.2 9.9% Peripherals and Add-Ons 4.0% Add-On Storage Devices 4.4% 60% 2.6% 330.7 16.8% 100% 80% 100% 100% 100% 100% 4.0% Desktop Printers 4.4% 5.4% 0.8% Other Printers 0.9% 5.2% 1.0% Other Add-Nos 1.1% 8.0% 100% 9.8% Peripherals Total 10.7% 2.6% 330.7 9.1% 17% 25% 16% 15% 15% 24% 17% 12% 8.8% Data Communications 0.0% 24.6% Market Evolution 50.8% Hardware Total 46.1% 7.7% 943.9 12.1% 100% 13.2% Package Software Total 14.5% 0.7% 84.7 12.4% 36.0% Services Total 39.5% 2.5% 319.6 13.4% 90% 80% 10.9% 1348.2 13.2% 70% Address U$ M % 60% 50% 40% 30% 20% 10% 0% 2002 2007
  • 15. Apply with the Vertical Industries effect on IT investments Addr. Revenue Cum. Addr. Account INDUSTRIA %IT/Rev IT Invest Market – (US$ M) Market 2003 10.9% 2003 PETROLEO BRASILEIRO S.A. Quimica e Petroquimica $49,008.90 2.50% $1,225.22 $133.55 $133.55 BANCO BRADESCO S.A. Financeiro - Multiplo $10,956.10 6.00% $657.37 $71.65 $205.20 TELEFONICA Telecomunicação $9,780.30 4.50% $431.79 $47.06 $252.27 TELEMAR Telecomunicação $6,956.30 4.50% $313.03 $34.12 $286.39 BANCO ITAU S/A Financeiro - Multiplo $5,151.10 6.00% $309.07 $33.69 $320.08 BANCO DO BRASIL SA Financeiro - Comercial $4,583.30 6.00% $265.23 $28.91 $348.99 BANCO SANTANDER BRASIL S/A Financeiro - Multiplo $3,836.40 6.00% $230.18 $25.09 $374.08 UNIBANCO-UNIAO DE BANCOS BRASILEIROS S.A. Financeiro - Multiplo $3,236.60 6.00% $194.20 $21.17 $395.24 BRASIL TELECOM S/A Telecomunicação $3,913.60 4.50% $176.11 $19.20 $414.44 BANCO ABN AMRO REAL S.A. Financeiro - Multiplo $2,540.50 6.00% $152.43 $16.61 $431.06 EMPRESA BRASILEIRA DE TELECOMUNICACOES S A EMBRATE Telecomunicação $3,167.60 4.50% $142.54 $15.54 $446.59 CAIXA ECONOMICA FEDERAL Financeiro - Comercial $1,906.20 6.00% $114.37 $12.47 $459.06 ELETROPAULO METROPOLITANA ELETRICIDADE DE SAO PAUL Serv. Publicos $3,056.50 3.50% $106.98 $11.66 $470.72 VOLKSWAGEN DO BRASIL LTDA Automotivo $4,952.60 2.00% $105.49 $11.50 $482.22 COMPANHIA ENERGETICA DE MINAS GERAIS ¿ CEMIG Serv. Publicos $2,649.00 3.50% $92.72 $10.11 $492.32 ELETROBRAS Serv. Publicos $2,465.50 3.50% $86.29 $9.41 $501.73 BRASKEM S.A. Quimica e Petroquimica $3,345.20 2.50% $83.63 $9.12 $510.85 GENERAL MOTORS DO BRASIL LTDA Automotivo $4,131.50 2.00% $82.63 $9.01 $519.85 COMPANHIA DE BEBIDAS DAS AMERICAS ¿ AMBEV Bebidas $5,344.10 1.50% $80.16 $8.74 $528.59 IPIRANGA PETROQUIMICA SA Atacado e Com. Ext $5,229.60 1.50% $80.14 $8.74 $537.32 AGIP DO BRASIL S.A. Serv. Publicos $2,108.40 3.50% $73.79 $8.04 $545.37 EMPRESA BRASILEIRA DE CORREIOS E TELEGRAFOS Serv. Publicos $2,074.50 3.50% $72.61 $7.91 $553.28 SHELL BRASIL LTDA Atacado e Com. Ext $4,774.30 1.50% $71.61 $7.81 $561.09 LIGHT SERVICOS DE ELETRICIDADE S A Serv. Publicos $1,934.00 3.50% $67.69 $7.38 $568.47 BANCO SAFRA S A Financeiro - Multiplo $1,117.60 6.00% $67.06 $7.31 $575.78 FURNAS CENTRAIS ELETRICAS S A Serv. Publicos $1,757.70 3.50% $61.52 $6.71 $582.48 COPEL DISTRIBUICAO S.A. Serv. Publicos $1,734.80 3.50% $60.72 $6.62 $589.10 BUNGE ALIMENTOS S/A Alimentos $5,591.30 1.50% $57.99 $6.32 $595.42 COMPANHIA BRASILEIRA DE DISTRIBUICAO (PAO DE ACUCA Varejista Com. $3,858.70 1.50% $57.88 $6.31 $601.73
  • 16. Refining your Model: Customer Loyalty does make a difference
  • 17. What if we concentrate our coverage resources? How should we compare Key Accounts opportunity levels? On a mid to long term strategy! • Revenue historical series (weighted) • Future contract values • Share of Wallet x competition analysis • Services Attach rates • Customer Satisfaction index • Opt-in Programs members • Number of reference Executives • Customer Lifetime Value TM • …and avoid the “Mermaid” Accounts
  • 18. Analyze your Customer Loyalty levels Customer Lifetime ValueTM model, Dr. Peter Wilton Business Attitudinal Partner Loyalty Behavioural Loyalty Client Customer Prospect
  • 19. Compound and reorder based on the weighted parameters Customer LOYALTY LEVEL CONTRACT VALUES QUOTA 06th FY POND 01~05th FY 1 PETROBRAS 4 19.0% 19.0% 23.0% 14% 2 EMBRATEL 3 13.8% 10.5% 5.9% 23% 3 GRUPO TELEFONICA 2 9.9% 13.5% 10.7% 30% 4 BANCO DO BRASIL 4 5.7% 8.4% 7.5% 37% 5 CEF 4 6.2% 5.2% 7.3% 43% 6 TIM 2 3.9% 5.2% 7.1% 47% 7 TELEMAR 2 4.1% 4.6% 7.4% 51% 8 SAINT-GOBAIN 4 4.4% 0.5% 1.0% 55% 9 CVRD 3 2.8% 3.9% 3.6% 59% 10 GRUPO FOLHA 3 2.3% 1.3% 6.9% 63% 11 UNIBANCO 2 3.9% 3.3% 0.8% 66% 12 MINISTERIO DA SAUDE 2 3.3% 0.0% 1.4% 68% 13 MINISTERIO DA FAZENDA / SEFAZ 2 1.8% 1.3% 2.3% 71% 14 BRASIL TELECOM 2 1.1% 2.4% 2.2% 73% 15 BANKBOSTON 2 2.8% 0.4% 0.8% 75% 16 EMBRAER 2 2.4% 1.0% 0.8% 77% 17 MINISTERIO DAS COMUNICACOES/CORREIOS 2 1.2% 2.6% 0.1% 79% 18 ITAU 1 2.4% 2.6% 0.6% 81% 19 ABN 1 2.9% 1.3% 1.1% 83% 20 LIGHT 2 1.0% 0.7% 1.2% 85% 21 BRADESCO 1 0.9% 4.7% 0.5% 87% 22 GM 2 0.5% 0.7% 1.9% 88% 23 SERASA 2 0.7% 0.7% 1.0% 90% 24 SIEMENS 2 0.2% 0.7% 2.1% 92% 25 MINISTERIO DA JUSTICA 2 0.0% 0.0% 0.7% 93% 26 GLOBO 1 1.3% 0.7% 1.3% 94% 27 MINISTERIO DA PREVIDENCIA 2 0.0% 0.0% 0.0% 96% 28 CITIBANK 1 0.5% 1.3% 0.4% 97% 29 BANCO CENTRAL 1 0.2% 1.6% 0.0% 98% 30 FURNAS/ELETROBRAS 1 0.5% 0.7% 0.2% 98% 31 VW/GEDAS 1 0.1% 1.0% 0.2% 99% 32 SANTANDER 1 0.0% 0.4% 0.2% 100% (modified account names and data)
  • 20. The courageous decision: from 30 Direct Coverage Accounts… ● Petrobras ● Telefonica ● Caixa Econom Federal ● CVRD ● Bradesco ● Banco do Brasil ● Telemar ● Itau ● Banco Central ● TIM ● Unibanco ● Min. of Fin/Sefaz/Serpro ● Embratel ● GM Telco ● Min. of Just/TJs ● Light ● VW/Gedas ● Min. of Comun/Correios ● Globo ● Embraer ● Min. of Social Security ● Furnas ● Saint Gobain ● Brasil Telecom ● BankBoston ● ABN ● Santander ● Citibank ● Serasa ● UOL/Folha ● Siemens (modified account names and data)
  • 21. The courageous decision: to 13 Direct Coverage Accounts only ● Petrobras ● Telefonica ● Caixa Econom Federal ● TIM ● Unibanco ● Banco do Brasil ● Embratel ● Saint Gobain ● CVRD ● UOL/Folha ● Telemar ● Bradesco ● Itau (modified account names and data)
  • 22. Adjusting Accounts x Partners Coverage Model Account Management AMM Relational Sales Process 13 Client driven 17 P-AMM Territory Management Transactional Sales Process Opportunity driven 400 EMM Channel Management Transactional Sales Process Product driven Open CDP
  • 23. Sharing and Selling the Opportunity to your Partners Actual Revenue Addressable Mkt Share of Opportunity New Addressable Mkt Account 76% U$ 660M 17% U$ 430M Territory 7% U$ 315M 3% U$ 650M Channel 17%
  • 24. Geographic Coverage Models 2% 6% 11% 8% U$ 650M 15% 27% 18% opportunity 8%
  • 25. Finding your right Partners o Take advantage of your regional executives knowledge o Existent partners from your pre-entry or pre-acquisition o Leverage local markets information services o Channel analysts surveys o Channel and general IT ranking publications o Channel oriented publications o Review public bids announcements o IT solution oriented events and associations o Social Media is removing relationship barriers o Don't forget… asking for references from your customers
  • 26. Results achieved (over two sequential years) o U$ U32M (+78%) growth in booking levels from Direct coverage accounts o U$ 18M (3.7x) growth in booking levels from Partners coverage accounts under the company relationship leadership o Increased participation in the share of wallet at the selected Direct coverage accounts o Partners achieved margin and cash flow levels necessary to fund the technical readiness and regional sales coverage investments
  • 27. Final Recommendations o Invest time on segmenting your opportunities o Make your choices and stick to it for 1 or 2 years at least o Don’t change your key accounts too frequently; your customer will notice and tacking breaks boat momentum o Customers need to trust you to share strategic, long term projects o Partners need to trust on your commitments to support capacity building investments o Consistency builds trust o Yes... It takes courage (analytical self confidence)