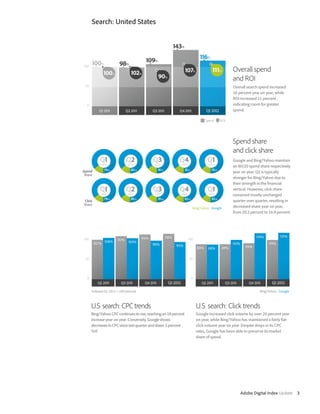
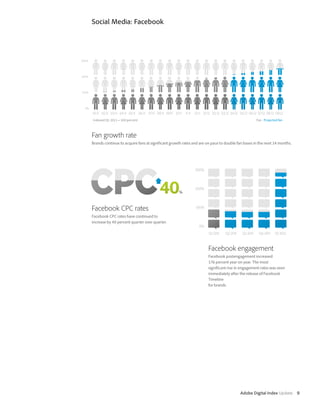
Digital advertising continued to grow across all channels in Q1 2012. Search advertising saw the largest growth, increasing 16% year-over-year globally. As mobile device traffic increased four-fold year-over-year, advertisers increased search investments on mobile devices like tablets. Tablet search spending grew rapidly, reaching 4.25% of total search spend by March 2012. Facebook post engagement also increased significantly, growing 176% year-over-year.
Q2 2012 Global Digital Advertising Updateaction.vn
During Q2 2012:
- Paid search advertising continued to grow across industries, driven by lower costs-per-click and improved return on investment.
- Search spending on tablets generated higher conversion rates and ROI than PCs and smartphones.
- Changes to Facebook's platform led to a significant 338% increase in user engagement, indicating that brands can benefit from optimizing social media spending.
Google regains US search market share for the first time since the Yahoo/Bing alliance. Facebook ad CPCs increase 54% in Q3 due to rising competition. Facebook ad spend increases 25% as advertisers see value in social media marketing. Tablets capture 77% of retail mobile ad spend in September 2011, with mobile spend projected to be 7-10% of total paid search spend by end of Q4 2011. UK search spend and ROI both increase 16% and 18% respectively in Q3.
In Q3 2017, paid search trends saw some notable changes from previous quarters:
- CPC on Google decreased quarter-over-quarter for the first time since 2016, driven by increased mobile search and changes to Google's algorithm.
- Shopping investment and volume continued rapid growth, reaching all-time highs on Google. However, Shopping CTR declined due to an increase in ad placements.
- On Bing, investment grew significantly year-over-year while CPC rose, leading to declines in impressions and clicks.
- Analysis of key verticals found decreasing CPC and increasing CTR for B2B advertisers, while retail saw continued growth in shopping campaigns on both Google and B
The document discusses paid search trends in Q2 2017 based on an analysis of over 1,800 Google AdWords accounts managed by iProspect. Key findings include:
- CPCs increased 13% from Q1 and set a new all-time high, rising 36% year-over-year. This was driven by increased mobile search competition and a Google algorithm update emphasizing bids over quality.
- Clicks declined 27.5% year-over-year due to higher CPCs reducing campaign budgets, while impressions fell 16%.
- Mobile CPC rose 52% year-over-year and closed the gap with desktop CPC. Mobile now accounts for 60% of clicks, up from 49% in
Ramadan Ads: Understand your audience and fine-tune your messageSocial Samosa
The document discusses strategies for brands and advertisers to effectively market during Ramadan. It notes that Ramadan celebrations focus on spirituality, community, and reflection while also providing opportunities for brands. With over 1.9 billion people celebrating globally, advertisers have exciting opportunities but must also think creatively with Covid restrictions. Consumer behavior and spending changes significantly during Ramadan, especially online. The document provides recommendations from industry experts on leveraging different platforms like Facebook and Twitter, emphasizing authenticity, empathy, and understanding shifting consumer trends in the post-Covid environment.
Magna Global - Advertising Forecasts - Global Advertising Market | 02/20/2015Lamia Mosbah
US media suppliers' advertising revenues grew 3.0% in 2014 to $164 billion but growth excluding non-recurring political and Olympic revenues was a modest 1.6%, the smallest in 6 years. Digital media grew 15% while traditional media like television, print, and radio slowed. The report forecasts a recovery in 2015 with overall growth of 4.1% excluding non-recurring revenues as the economy improves. However, television revenues are expected to stabilize at 0.3% growth as digital continues taking share.
Based on data received from 59 markets across the Americas, Asia Pacific and EMEA, Carat’s latest global advertising expenditure forecasts that global advertising spend will grow by +4.0% in 2015 to US$529billion, a slight decline from the +4.6% predicted in March 2015, and 2016 is predicted to grow by +4.7%, accounting for an additional US$25billion in spend.
Steven A. Ballmer is the Chief Executive Officer of Microsoft. Sanusha has completed the requirements to be recognized as a Microsoft Certified Technology Specialist (MCTS). The document certifies that Sanusha has achieved the MCTS certification.
Dokumen tersebut membahas tentang pidato yang terdiri dari 3 bagian yaitu bagian pembuka, isi, dan penutup. Bagian pembuka meliputi salam pembuka dan salam penghormatan untuk hadirin. Bagian isi mencakup tujuan pidato, uraian pidato, dan kesimpulan. Bagian penutup berisi salam penutup.
The document defines several financial terms including:
1) Accrued interest, which is interest owed on a bond since the last payment. The buyer pays the market price plus any accrued interest.
2) Acquisition, which is when one corporation gains control of another through a takeover attempt, which may involve offering a higher price for shares.
3) American Depositary Receipt, a security issued by a US bank that represents foreign shares held in trust, allowing foreign shares to trade on US markets.
The document discusses the benefits of exercise for mental health. Regular physical activity can help reduce anxiety and depression and improve mood and cognitive functioning. Exercise causes chemical changes in the brain that may help protect against mental illness and improve symptoms.
Descrizione delle attività per il primo incontro in presenza - Formazione in rete Istituti "Solari" (Tolmezzo), "Linussio" (Tolmezzo) e "Bachmann" (Tarvisio)
This document provides a summary of an individual's educational qualifications, professional experience, skills, and career objective. It includes details of the applicant's postgraduate degree in management from the Institute of Management Studies in Ghaziabad, bachelor's degree from IPS Academy Indore, and secondary education. It also lists the applicant's internship and project experience in areas like financial analysis, retail operations, and digital marketing. The applicant's key strengths are highlighted as time management, consistency, and flexibility. The overall career objective is to gain comprehensive understanding and take on responsibility in a reputed organization.
This document discusses the challenges facing the charitable sector in Canada. It notes that fundraising revenues have only grown 3% in recent years for traditional charities, and total tax receipted giving is just matching pre-recession levels. Participation rates are also declining, with fewer tax filers claiming charitable receipts and fewer Canadians volunteering. This decline is happening as attitudes towards charities are changing, with Canadians rethinking their relationship with the sector. The sector may need to examine its current paradigms and adapt to meet evolving expectations around impact, choice, involvement and social connections.
The document provides a guide to using the new Facebook timeline features for businesses. It discusses 6 key timeline features including cover photos, profile pictures, organizing views and apps, highlighting and pinning posts. It then offers best practices for timeline such as publishing visual content, editing app images, highlighting best posts, and publishing more than once per day. Finally, it showcases examples of other businesses that have effectively used timeline features like Starbucks' use of pinned posts.
Rishu Roshan is a Senior Application Development Analyst at Accenture with over 7 years of experience working on SAP PM and related modules focused on plant maintenance. He has experience designing business processes and configuring SAP EAM, LAM, and FM modules for large government and mining clients in India, Australia, South Africa, and Canada. Rishu also has expertise testing SAP functionality, resolving support tickets, and leading implementations for enterprise asset management, procurement, and fleet management processes. He is proficient in SAP PM, business process analysis, and testing methods like HPQC.
This document is Claude Resources Inc.'s annual information form for 2012. It provides an overview of the company's corporate structure, general development, business operations, risks, mineral properties, capital structure, market for securities, directors and officers, material contracts, and other additional information required by regulators. The key aspects are that Claude Resources is a Canadian mining company focused on gold production and exploration, primarily in Saskatchewan. It operates the Seabee gold operation and has interests in other exploration properties in the region. Risk factors for the company include commodity prices, production estimates, financing risks, and permitting/government regulation risks.
Satya Nadella has achieved Microsoft Certified Professional certification. The certification was achieved on March 28, 2008 and has the certification number C442-0620. The certification recognizes that Satya Nadella has successfully completed the requirements to be recognized as a Microsoft Certified Professional.
- Paid search spending grew 17% in Q1 2014, with Google up 17% and Bing up 17%. Growth in clicks was lower at 11%, while cost-per-click rose 6%.
- Product listing ads (PLAs) and other product ads are driving most paid search growth, with spending up 69% and clicks up 51%. PLAs accounted for 29% of Google clicks for retailers.
- Mobile accounted for 36% of paid search clicks but just 27% of spending, as smartphones have lower conversion rates despite an 18% share of clicks.
Merkle Q2 2019 Digital Marketing Report for download, complete with detailed analysis on trends spanning the key platforms across paid search, SEO, display advertising and paid social. This edition of the report includes commentary on the impact of Yahoo’s move to exit the Google Search Partner Network, a rebound in the growth of Google brand CPC, the continued strength of Instagram ads growth, and much more.
The document provides an executive summary and analysis of key trends in the search marketing industry in Q2 2014. Some of the key findings include:
- Paid search spending growth accelerated to 23% year-over-year as advertisers responded to improving conversion performance by increasing their cost-per-click (CPC) rates. Google saw paid search spending growth of 24% while Bing grew 19%.
- Product listing ads (PLAs) and product ads continued to see huge growth, with spending up 72% year-over-year. PLAs accounted for 26% of Google search clicks and 50% of non-brand clicks for retailers.
- Mobile devices accounted for 37% of paid search clicks
Ignition one - digital marketing report - Q3 2015Romain Fonnier
Les dépenses Search continuent de croître …
Le Search Mobile connaît une croissance plus lente …
Yahoo Gemini amène des changements …
Facebook dépasse Google vis-à-vis des coûts publicitaires …
Le display programmatique indique une tendance pour le remarketing …
The document summarizes key trends in online advertising for the fourth quarter of 2011 based on an analysis of over 1,000 advertisers. It finds that advertisers increased click-through rates and decreased costs-per-click, improving efficiency. It also finds that advertisers increased spending on Yahoo! and Bing while refining keyword matching on Google. Additionally, mobile and tablet advertising saw strong growth and performance gains.
Adobe Digital Index’s Q3 Digital Advertising & Social Intelligence ReportAdobe
Facebook’s undisputed victory in ad personalization is driving Google to make changes to its advertising business, according to ADI's Q3 Digital Advertising & Social Intelligence Report.
2010 Advertising Spend Ireland - IAB PWC StudyKrishna De
This document summarizes an industry report on online advertising spend in Ireland from 2010. It finds that online ad spend increased 13.5% from 2009 to 2010, totaling €110 million. This surpassed predictions of €102 million. The automobile category was the largest spender at 21% of total online ads. Increased broadband connections and time spent online helped fuel online's growth compared to other media. Most report participants predicted continued online ad spend growth in 2011.
- The document analyzes Alphabet Inc. (Google's parent company) and recommends a "buy" rating for the stock based on a discounted cash flow model.
- It finds that Alphabet is expected to maintain strong double digit revenue growth over the next 5 years, driven by increasing internet penetration globally and its leadership in online search and advertising.
- While risks like increasing competition exist, the model suggests the stock has a 30% upside from its current price based on Alphabet's robust revenue growth prospects and efforts to control costs.
Adobe Digital Index - Digital Advertising Report | Q2 2015 Webrazzi
This report summarizes key insights from the digital advertising industry in Q2 2015, including the effects of Google's Mobilegeddon algorithm change, growth in search engine marketing spend globally and by region, and metrics like click-through rates and cost-per-click for different devices, regions, sectors, and search engines. Some of the main findings are that global SEM spend increased 6% year-over-year while CTRs grew 9% and CPCs rose 6%, retailers saw a 17% increase in SEM spending, and marketers are paying 6% higher CPCs for tablet users than desktop users.
The document summarizes the key findings of the 2009 Ad Network Study conducted by Collective Media and Sterling Research Group. Some of the main findings include:
- More respondents planned to work with ad networks in 2009 compared to 2008.
- Over 70% of agencies/advertisers use 1-2 ad networks per media plan.
- Re-targeting and channel targeting saw significant increases in usage.
- Efficiency, reach, and targeting were the top reasons for using ad networks.
- Ad exchanges saw limited usage and were not expected to replace ad networks.
Paid search spending grew 26% year-over-year in Q3 2014, driven by a 19% increase in click volume and 6% increase in cost-per-click. Google paid search spending rose 27% due to 18% higher click volume and 8% higher CPC. Bing Ads spending grew 24% from a 24% rise in click volume, with no change in CPC. Product listing ads grew faster than text ads, with Google PLAs accounting for 27% of clicks and Bing product ads over 10% of non-brand spending.
The document summarizes key trends in US online advertising for the first quarter of 2012 based on an analysis of data from over 1,500 advertisers. The main findings are:
1) Advertisers increased click volumes by 37% year-over-year while keeping costs stable, indicating greater efficiency.
2) Google accounted for most search volume and spend but advertisers optimized campaigns, improving click-through rates and lowering costs.
3) Increased use of precise keyword matching improved relevance and performance.
4) Mobile and tablet advertising is growing rapidly and outperforming desktop.
1) Mobile devices are taking a larger share of consumer usage and advertiser budgets across search, display, and social media. While clicks and spending have shifted significantly to mobile, conversion rates remain higher on desktop devices.
2) Advertisers have increased mobile spending but still struggle with mobile attribution and optimization. Over 50% of clicks now occur on mobile, but the share of conversions attributed to mobile devices generally lags behind mobile spending.
3) Performance varies across channels and devices. Search has the highest click-through rates overall, while conversion rates are higher on desktop than mobile. Cost-per-click also tends to be lower for mobile devices where conversion rates are lower.
Adobe Digital Index Q4 2015 Advertising ReportAdobe
Paid search growth slowed in Q4 2015 as both Google and Bing showed slower growth. Mobile search spending increased helping to close the "mobile gap" as smartphone CPCs were 24% less than desktop. For US retailers over Thanksgiving weekend, paid search contributed 10% more revenue than direct traffic and revenue grew faster for paid search than direct traffic. Display advertising costs rose sharply at the end of each quarter and over Thanksgiving weekend for retailers.
Magna Global - Advertising Forecasts - Global Advertising Market | 08/26/2014Lamia Mosbah
1. A report from Magna Global forecasts that US ad spending will increase 4.9% in 2015, the highest growth rate in 10 years, bringing total spending to $172 billion.
2. US ad spending increased 3.2% in the first half of 2014 but growth slowed from 4.6% in Q1 to 2% in Q2, partly due to some advertisers shifting budgets from Q2 to Q1 for the Winter Olympics.
3. Television was particularly impacted by the slowdown in Q2, with network TV sales down 9% due to soft ratings and budgets shifting to cable, digital, and Spanish-language TV. However, the report predicts the dip was partly circumstantial and
GroupM global TYNY forecast report december 2021Social Samosa
- Global GDP growth is forecast to be 9.4% in 2021 and 7.6% in 2022, providing a strong foundation for advertising growth.
- The global advertising industry is expected to grow 22.5% in 2021 and 9.7% in 2022, faster than earlier forecasts.
- Digital advertising will likely grow 30.5% in 2021 and account for 64.4% of total advertising, driven by growth at Alphabet, Meta, and Amazon. Television advertising is also recovering but expected to be flat going forward as budgets shift to digital.
The document summarizes key digital advertising trends from Adobe's Q4 2015 report. It found that search marketing continued growing healthily in the US and UK, and mobile transactions increased significantly as consumers were finally using smartphones to purchase items. Programmatic display spending was found to be inefficient, with higher costs at the beginning of months. Retail spending in the US saw front-loading in 2015 with more spending in November, priming customers to purchase earlier.
Publishers face the ever-changing complexities of selling display ads and reaching new audiences. As a business partner to publishers around the world, Google is no stranger to these challenges. We rely on data-based insights to guide our business decisions. During our routine deep-dives into the publisher display dynamics, we frequently notice trends that may be of interest to our clients as well, which is what prompted us to introduce this research publication.
HOW GOOGLE WORKS is an entertaining, page-turning primer containing lessons that Google Executive Chairman and ex-CEO Eric Schmidt and former SVP of Products Jonathan Rosenberg learned as they helped build the company.
Caso Lago : Lo studio di Open Knowledge. Una case history che sta facendo la storia. Cosa fare per ingaggiare i propri clienti, partner colleghi e guadagnare una straordinaria reputazione digitale
1) The document provides an overview of A/B testing and summarizes the results of A/B tests conducted by various marketing partners on different elements of marketing assets.
2) It describes why elements like color, images, wording, pricing, and layout should be tested, and includes examples that tested variations of calls-to-action buttons based on these different elements.
3) The summaries illustrate that testing is important because user behavior is unpredictable, and that unexpected elements sometimes performed better, emphasizing the need to test assumptions to optimize marketing outcomes.
Sempre più consumatori si convincono ad acquistare un prodotto o un servizio piuttosto che un altro a seguito di recensioni o giudizi rinvenuti on line : ma , come ci riportano notizie anche recenti di cronaca , tali giudizi potrebbero essere non veritieri , denigratori o “ acquistati “ da aziende interessate . In questo mio articolo , pubblicato sul numero di ottobre 2013 della rivista di settore “ Market Place “ , sono esaminati i profili di responsabilità di chi mette in atto queste pratiche illegali e la concreta possibilità di perseguirle . Avv. Iorio
The document discusses the four essentials of great website design: aesthetically beautiful design, optimization for the user, personalization and context, and optimization for mobile. It covers how website design has evolved from static billboards to interactive platforms. Great design focuses on the user experience by using visual elements, colors, and layouts to convey the brand's personality and goals. Websites should explain their value proposition and be optimized for usability through principles like passing a "blink test" and establishing a logical thought process for users.
Osservatorio
New Media & New Internet
New Internet +90%: inizia a delinearsi
il nuovo scenario dei Media
Volano Video Online, Social Network,
Applicazioni, Smartphone e Tablet
Brian Fitzsimmons on the Business Strategy and Content Flywheel of Barstool S...Neil Horowitz
On episode 272 of the Digital and Social Media Sports Podcast, Neil chatted with Brian Fitzsimmons, Director of Licensing and Business Development for Barstool Sports.
What follows is a collection of snippets from the podcast. To hear the full interview and more, check out the podcast on all podcast platforms and at www.dsmsports.net
SATTA MATKA SATTA FAST RESULT KALYAN TOP MATKA RESULT KALYAN SATTA MATKA FAST RESULT MILAN RATAN RAJDHANI MAIN BAZAR MATKA FAST TIPS RESULT MATKA CHART JODI CHART PANEL CHART FREE FIX GAME SATTAMATKA ! MATKA MOBI SATTA 143 spboss.in TOP NO1 RESULT FULL RATE MATKA ONLINE GAME PLAY BY APP SPBOSS
Storytelling is an incredibly valuable tool to share data and information. To get the most impact from stories there are a number of key ingredients. These are based on science and human nature. Using these elements in a story you can deliver information impactfully, ensure action and drive change.
At Techbox Square, in Singapore, we're not just creative web designers and developers, we're the driving force behind your brand identity. Contact us today.
Anny Serafina Love - Letter of Recommendation by Kellen Harkins, MS.AnnySerafinaLove
This letter, written by Kellen Harkins, Course Director at Full Sail University, commends Anny Love's exemplary performance in the Video Sharing Platforms class. It highlights her dedication, willingness to challenge herself, and exceptional skills in production, editing, and marketing across various video platforms like YouTube, TikTok, and Instagram.
The 10 Most Influential Leaders Guiding Corporate Evolution, 2024.pdfthesiliconleaders
In the recent edition, The 10 Most Influential Leaders Guiding Corporate Evolution, 2024, The Silicon Leaders magazine gladly features Dejan Štancer, President of the Global Chamber of Business Leaders (GCBL), along with other leaders.
[To download this presentation, visit:
https://www.oeconsulting.com.sg/training-presentations]
This presentation is a curated compilation of PowerPoint diagrams and templates designed to illustrate 20 different digital transformation frameworks and models. These frameworks are based on recent industry trends and best practices, ensuring that the content remains relevant and up-to-date.
Key highlights include Microsoft's Digital Transformation Framework, which focuses on driving innovation and efficiency, and McKinsey's Ten Guiding Principles, which provide strategic insights for successful digital transformation. Additionally, Forrester's framework emphasizes enhancing customer experiences and modernizing IT infrastructure, while IDC's MaturityScape helps assess and develop organizational digital maturity. MIT's framework explores cutting-edge strategies for achieving digital success.
These materials are perfect for enhancing your business or classroom presentations, offering visual aids to supplement your insights. Please note that while comprehensive, these slides are intended as supplementary resources and may not be complete for standalone instructional purposes.
Frameworks/Models included:
Microsoft’s Digital Transformation Framework
McKinsey’s Ten Guiding Principles of Digital Transformation
Forrester’s Digital Transformation Framework
IDC’s Digital Transformation MaturityScape
MIT’s Digital Transformation Framework
Gartner’s Digital Transformation Framework
Accenture’s Digital Strategy & Enterprise Frameworks
Deloitte’s Digital Industrial Transformation Framework
Capgemini’s Digital Transformation Framework
PwC’s Digital Transformation Framework
Cisco’s Digital Transformation Framework
Cognizant’s Digital Transformation Framework
DXC Technology’s Digital Transformation Framework
The BCG Strategy Palette
McKinsey’s Digital Transformation Framework
Digital Transformation Compass
Four Levels of Digital Maturity
Design Thinking Framework
Business Model Canvas
Customer Journey Map
Taurus Zodiac Sign: Unveiling the Traits, Dates, and Horoscope Insights of th...my Pandit
Dive into the steadfast world of the Taurus Zodiac Sign. Discover the grounded, stable, and logical nature of Taurus individuals, and explore their key personality traits, important dates, and horoscope insights. Learn how the determination and patience of the Taurus sign make them the rock-steady achievers and anchors of the zodiac.
HOW TO START UP A COMPANY A STEP-BY-STEP GUIDE.pdf46adnanshahzad
How to Start Up a Company: A Step-by-Step Guide Starting a company is an exciting adventure that combines creativity, strategy, and hard work. It can seem overwhelming at first, but with the right guidance, anyone can transform a great idea into a successful business. Let's dive into how to start up a company, from the initial spark of an idea to securing funding and launching your startup.
Introduction
Have you ever dreamed of turning your innovative idea into a thriving business? Starting a company involves numerous steps and decisions, but don't worry—we're here to help. Whether you're exploring how to start a startup company or wondering how to start up a small business, this guide will walk you through the process, step by step.
B2B payments are rapidly changing. Find out the 5 key questions you need to be asking yourself to be sure you are mastering B2B payments today. Learn more at www.BlueSnap.com.
Building Your Employer Brand with Social MediaLuanWise
Presented at The Global HR Summit, 6th June 2024
In this keynote, Luan Wise will provide invaluable insights to elevate your employer brand on social media platforms including LinkedIn, Facebook, Instagram, X (formerly Twitter) and TikTok. You'll learn how compelling content can authentically showcase your company culture, values, and employee experiences to support your talent acquisition and retention objectives. Additionally, you'll understand the power of employee advocacy to amplify reach and engagement – helping to position your organization as an employer of choice in today's competitive talent landscape.
Event Report - SAP Sapphire 2024 Orlando - lots of innovation and old challengesHolger Mueller
Holger Mueller of Constellation Research shares his key takeaways from SAP's Sapphire confernece, held in Orlando, June 3rd till 5th 2024, in the Orange Convention Center.
2. Adobe Digital Index Update
Global digital advertising update
Table of contents
Q1 2012 executive summary
1: Q1 2012 executive summary
2: Outlook for Q2-Q4 2012 Digital advertising in Q1 2012 continues to show growth across all channels. Search remains the biggest
3: Search: United States driver of return on investment (ROI) for marketers absorbing the majority of biddable digital advertising
6: Search: International spend. Search continues to grow rapidly, increasing 16 percent year on year during Q1 2012. As traffic on
7: Mobile: United States mobile devices, specifically tablets, increases four-fold year on year, advertisers are adding search
8: Mobile: United Kingdom investments to these devices. This indicates that search on mobile and tablets is just as strong of an
9: Social Media: Facebook
emerging market as social media, and will continue to positively influence the growth in search spend
globally.
10: Methodology
Search spend increased year over year 16 percent in the U.S. and 3 percent in the U.K.—In the U.S., ROI
increased by 11 percent year on year indicating there is room to increase search spend. Industry sectors,
such as finance and automotive, showed large increases in year on year spend, while the retail sector
dropped 5 percent. The minimal increase in U.K. search spend levels reflect the fragile state of the
European economic recovery.
Mobile spend on search has grown year over year by 250 percent in the U.K.—In Q1, mobile spend
reached 8 percent of all search spend in the U.S. and 11 percent in the U.K. Of this, tablets alone accounted
for 4.25 percent of search spend. Because costs per click (CPC) on tablets are disproportionately low
compared to desktop CPCs (despite comparable conversion rates), mobile and tablet advertising
investments will become more appealing to advertisers in the short term.
Google CPC fell by 5 percent year on year—Bing/Yahoo CPC rates increased by 18 percent year on year
as marketers took advantage of better return per click (RPC) rates. As a result, the Bing/Yahoo ROI
advantage over Google no longer exists. Note that when Yahoo Japan converted to the Google ad serving
platform from Bing/Yahoo, CPC rates dropped significantly. This indicates that Google, on average, charges
a lower premium to search advertisers.
Google search algorithmic changes contribute to growth in search spend—Increases in search spend are
a result of increased click volume rather than increased CPC rates. This has been true for the past two
quarters, but is contradictory to trends in prior quarters. Algorithmic changes to Google in Q4 2011, such as
increased site links, have led to a greater proportion of branded traffic that does not impact CPC rates.
Google spend and click share rose to 93 percent in the U.K.—This is up from about 90 percent in Q4
2011. Google also continues to dominate market share in other European markets.
Facebook post engagement increased 176 percent year on year—Engagement in the brands’ Facebook
posts have increased dramatically since the beginning of this year. This may be due to the new platform
changes Facebook has made in the last two quarters. The most significant lifts were seen immediately after
the release of Facebook Timeline for brands.
Facebook spend has grown by 93 percent year on year—On a relative basis, this represents 3 to 5
percent of search spend—indicating that social media continues to be a strong, digital advertising channel.
Display advertising continues to increase in strength—Google DoubleClick Ad Exchange continues to
capture market share from Right Media Exchange.
3. Outlook for Q2-Q4 2012
Tablets and mobile devices will continue to assume a larger percentage of overall search spend,
reaching 15 to 20 percent by the end of this year. Mobile growth is driven by advertisers’ interest in
other digital marketing channels that yield desktop search ROI with lower CPC rates for maximizing
returns. Also, as more brands maximize the new Facebook Timeline for brands, we expect to see
increases in postengagement, resulting in lifts in Facebook ad spend from those advertisers looking
for more engagement with their social audiences.
Search spend in the U.S. will increase 10 to 15 percent for the rest of 2012—This rate is consistent
with macro trends. Search spend is typically indicative of the current state of the economy—as the
medium allows advertisers to react quickly to marketplace changes—thus providing a positive
outlook for both search and the U.S. economy.
Tablet and mobile spend will make up 15 to 20 percent of all search spend by the end of 2012—
Marketers should focus on tablet and mobile markets as they still appear to be underinvested
opportunities. Investments in tablet advertising will increase because tablet visitors are rapidly
growing, as shown in a recent Adobe Digital Index study. Retail websites’ share of total visits
increased from 1 percent to 4 percent in just 12 months. Conversion rates on mobile devices are
comparable to desktop performance, even though mobile CPC rates are 30 percent lower. In a
rational marketplace, the CPC rates on tablets should be identical to desktop CPC rates if the
conversion rates are comparable. Furthermore, current trends indicate that tablets may cannibalize
smartphone and desktop search spend as investments continue to shift to tablet devices.
Facebook CPC rates are expected to decelerate—While Facebook ad CPC rates have increased 40
percent quarter over quarter for the past three quarters, CPC rates on Sponsored Stories tend to be
lower than Marketplace Ads, which may contribute to temporary decreases in CPC rates.
Facebook engagement rates will grow as more brands convert to and maximize Facebook
Timeline for brands—Brands that measure success of Facebook via engagement will probably spend
more on Facebook advertising to build their audiences and engage with fans in a meaningful way.
Adobe Digital Index Update 2
4. Search: United States
Overall spend
and ROI
Overall search spend increased
16 percent year on year, while
ROI increased 11 percent ,
indicating room for greater
spend.
Spend share
and click share
Google and Bing/Yahoo maintain
an 80/20 spend share respectively
Spend year on year. Q1 is typically
Share
stronger for Bing/Yahoo due to
their strength in the financial
vertical. However, click share
remained mostly unchanged
Click quarter over quarter, resulting in
Share
Bing/Yahoo Google decreased share year on year,
from 20.2 percent to 16.9 percent.
Indexed Q1 2011 = 100 percent Bing/Yahoo Google
U.S. search: CPC trends U.S. search: Click trends
Bing/Yahoo CPC continues to rise, reaching an 18 percent Google increased click volume by over 20 percent year
increase year on year. Conversely, Google shows on year, while Bing/Yahoo has maintained a fairly flat
decreases in CPC since last quarter and down 5 percent click volume year on year. Despite drops in its CPC
YoY. rates, Google has been able to preserve its market
share of spend.
Adobe Digital Index Update 3
5. U.S. search: Impression trends
Impressions on Google increased by 5 percent year
over year, while Bing/Yahoo dropped by 7 percent. In
contrast, Google clickthrough rates (CTRs) increased
by 21 percent and dropped on Bing/Yahoo by only 1
percent. This indicates that both search engines have
improved CTRs, with Google seeing even more
significant improvements.
Indexed Q1 2011 = 100 percent Bing/Yahoo Google
U.S. search: RPC and ROI
Bing/Yahoo vs. Google
The average revenue per click (RPC) rate for Bing/
Yahoo is still significantly higher than for Google.
However, due to the 18 percent year on year increase
in Bing/Yahoo CPC rates, the ROI on Bing/Yahoo is
basically equal to the ROI for Google.
Indexed Google = 100 percent RPC ROI
Adobe Digital Index Update 4
6. U.S. search: Automobiles
A deep dive into the automotive sector shows mixed results with spend
and CPC dropping quarter over quarter, with ROI on the rise. Year-on-
year impressions are down 8 percent, but spend and ROI are up 23
percent and 18 percent respectively. This is inline with broader economic
indicators which show automobile sales are up year on year.
U.S. search: Retail
Spend is down 5 percent year on year as a result of a sharp decline in CPC
rates which are down 17 percent..
U.S. search: Finance
Finance is showing strong growth with a 17 percent spend increase year
on year, and a 36 percent increase in ROI. The higher ROI indicates there is
room for spend to increase in this sector.
Adobe Digital Index Update 5
7. Search: International
UK search: Overall
spend and ROI
Overall search spend is up 3
percent and ROI has increased by
5 percent YoY.
Google Google
Bing/Yahoo Bing/Yahoo
Market share by country Click share by country
Google continues to dominate the search space In the U.K. and France, click shares are consistent
despite suffering its first loss in market share since with spend shares, indicating CPC rates are
Q1 2011. The trend in France is similar to that of the comparable to Bing/Yahoo and Google, whereas
U.K. with Google growing year over year at Bing/ generally Bing/Yahoo has lower CPC rates. Germany
Yahoo’s expense. In Germany, however, Google has and Australia both have significantly higher click
significant market share relative to last year with a share than spend share for Bing/Yahoo than Google.
1.6 percent year-on-year gain. Japan is more evenly Japan has comparable figures, but this is expected
split between Bing/Yahoo and Google. given the much higher prevalence of Yahoo in Japan.
Normalized to Google CPC
for Q1 2011
Google
Yahoo (Overture)
Yahoo (v3)
Japan search: CPC trends
CPC rate in Japan have generally fallen since the earthquake and tsunami of 2011. In addition, Yahoo Japan*
changed its ad serving platform in Q4 2011 to Google, which resulted in drastic decreases in CPC rates. on the older
platform, Yahoo commanded a 20 percent CPC premium over Google, but in the new version it commands only a
single-digit premium over Google.
* Yahoo Japan migrated from their old platform using Overture technology to a new platform (v3) using Google technology in November
2011. Data shows that CPC rates for Yahoo were much higher than Google before the transition, but CPC rates have dropped considerably
after the transition to be closer to Google CPC rates. This is logical since Google technology is now being used.
Adobe Digital Index Update 6
8. Mobile: United States
U.S. mobile spend
and forecasts
In the U.S., overall spend on
mobile devices reached 7.65
percent in Q1, on pace to be 15
percent to 20 percent of search
spend by the end of 2012.
U.S. mobile and
tablet spend
The tablet is driving the spend.
Tablet spend has grown from
virtually zero in May 2011 to
4.25 percent of all search ad
spend by March 2012. Spend on
tablets now exceeds
smartphones, with the inflection
Mobile Tablet
point occurring in October 2011.
Mobile and tablet Mobile and tablet
vs. desktop vs. desktop
U.S. mobile and tablet vs. U.S. mobile and tablet vs.
desktop conversion rates desktop CPC rates
Tablets are displaying higher conversion rates CPC conversion rates on mobile and tablet
than desktop, while mobile conversion rates devices continue to remain lower than on
remain much lower at about a third. desktops. Since conversion rates of tablets are
similar to that of desktops, the CPC rates should
be identical to desktops in an efficient
marketplace. However, this is not the case,
perhaps because advertisers have yet to make
larger investments in mobile search.
Adobe Digital Index Update 7
9. Mobile: United Kingdom
U.S. vs. U.K.
mobile spend
Mobile spend in the U.K. is
currently higher than in the U.S.
(11 percent in the U.K. vs. 8
percent in the U.S.).
Mobile and tablet Mobile and tablet
vs. desktop vs. desktop
U.K. mobile and tablet vs. U.K. mobile and tablet vs.
desktop conversion rates desktop CPC rates
Conversion rates for mobile and tablet devices CPC rates on mobile and tablet devices are still
remain fairly equal. lower than desktops, although the conversion
rates on tablets are similar.
Adobe Digital Index Update 8
10. Social Media: Facebook
Indexed Q1 2011 = 100 percent Fan Projected fan
Fan growth rate
Brands continue to acquire fans at significant growth rates and are on pace to double fan bases in the next 14 months.
Facebook CPC rates
Facebook CPC rates have continued to
increase by 40 percent quarter over quarter.
Facebook engagement
Facebook postengagement increased
176 percent year on year. The most
significant rise in engagement rates was seen
immediately after the release of Facebook
Timeline
for brands.
Adobe Digital Index Update 9