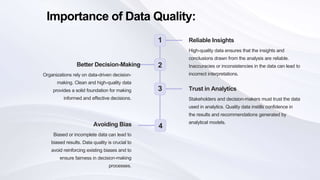
The document outlines data cleaning and preprocessing techniques using pandas, detailing processes such as handling missing values, removing duplicates, dealing with outliers, and feature scaling. It emphasizes the importance of high-quality data for reliable insights, better decision-making, and avoiding bias in analytical models. Key steps in data preprocessing, including transforming raw data and encoding categorical variables, are also discussed, along with machine learning applications.


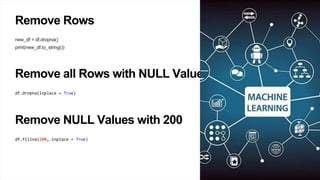
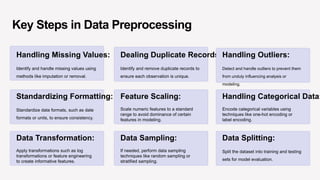
![Remove NULL values in Specific Co
df[“col_name"].fillna(130, inplace = True)
Replace using Mean, Median and M
df[" col_name "].fillna(df[" col_name "].mean(), inplace = True)
df[" col_name "].fillna(df[" col_name "].median(), inplace = True)
df[" col_name "].fillna(df[" col_name "].mode()[0], inplace = True)
Convert into a Correct Format
pd.to_datetime(df['Date'])](https://image.slidesharecdn.com/lect6-240428094950-5ae10406/85/Pandas-Data-Cleaning-and-Preprocessing-PPT-pptx-9-320.jpg)


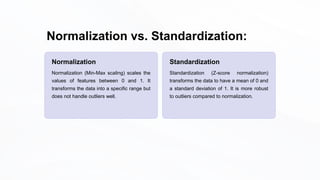
![Identifying Outliers using
Descriptive Statistics
Descriptive statistics, such as mean, median, and standard deviation, can be used to
identify outliers. Data points that fall far from the mean or median may be considered
outliers.
import pandas as pd
# Creating a DataFrame with outliers
data = {'Values': [1, 2, 3, 20, 25, 30, 35, 40]}
df = pd.DataFrame(data)
# Calculate mean and standard deviation
mean_val = df['Values'].mean()
std_dev = df['Values'].std()
# Identify outliers based on z-scores
outliers = df[(df['Values'] < mean_val - 2 * std_dev) | (df['Values'] > mean_val + 2 *
std_dev)]
print("Original DataFrame:")
print(df)
print("nOutliers identified using descriptive statistics:")](https://image.slidesharecdn.com/lect6-240428094950-5ae10406/85/Pandas-Data-Cleaning-and-Preprocessing-PPT-pptx-12-320.jpg)
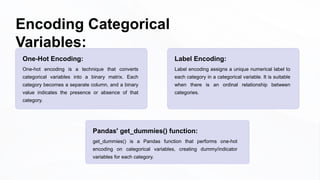
![Handling Outliers
(Removing or
Transforming)
Handling outliers involves deciding whether to remove them or transform
them to mitigate their impact on analysis or modeling.
# Remove outliers using z-scores
df_no_outliers = df[(df['Values'] >= mean_val - 2 * std_dev) & (df['Values'] <=
mean_val + 2 * std_dev)]
print("DataFrame after removing outliers:")
print(df_no_outliers)
# Transformation to handle positively skewed data
df['Values_log'] = df['Values'].apply(lambda x: 0 if x == 0 else np.log(x))
print("DataFrame after log transformation:")
print(df)](https://image.slidesharecdn.com/lect6-240428094950-5ae10406/85/Pandas-Data-Cleaning-and-Preprocessing-PPT-pptx-13-320.jpg)


![Scaling Numeric Features using Pandas:
import pandas as pd
# Creating a DataFrame with numeric features
data = {'Feature1': [10, 20, 15, 25], 'Feature2': [500, 1000, 750, 1250]}
df = pd.DataFrame(data)
# Min-Max scaling using Pandas
df_normalized = (df - df.min()) / (df.max() - df.min())
print("Original DataFrame:")
print(df)
print("nDataFrame after Min-Max scaling (Normalization):")
print(df_normalized)
Min-Max Scaling (Normalization)](https://image.slidesharecdn.com/lect6-240428094950-5ae10406/85/Pandas-Data-Cleaning-and-Preprocessing-PPT-pptx-19-320.jpg)
![Scaling Numeric Features using Pandas:
import pandas as pd
# Creating a DataFrame with numeric features
data = {'Feature1': [10, 20, 15, 25], 'Feature2': [500, 1000, 750, 1250]}
df = pd.DataFrame(data)
# Z-score normalization using Pandas
df_standardized = (df - df.mean()) / df.std()
print("Original DataFrame:")
print(df)
print("nDataFrame after Z-score normalization (Standardization):")
print(df_standardized)
Z-score Normalization (Standardization)](https://image.slidesharecdn.com/lect6-240428094950-5ae10406/85/Pandas-Data-Cleaning-and-Preprocessing-PPT-pptx-20-320.jpg)


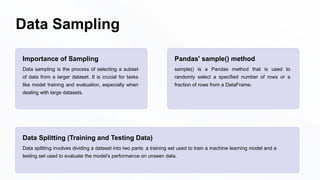
![Using Pandas for Data Splitting
import pandas as pd
from sklearn.model_selection import train_test_split
# Creating a DataFrame
data = {'Feature1': [1, 2, 3, 4, 5], 'Target': [0, 1, 0, 1, 0]}
df = pd.DataFrame(data)
# Splitting data into features (X) and target variable (y)
X = df[['Feature1']]
y = df['Target']
# Using train_test_split for data splitting
X_train, X_test, y_train, y_test = train_test_split(X, y, test_size=0.2, random_state=42)
print("Training Data:")
print(X_train, y_train)
print("nTesting Data:")
print(X_test, y_test)](https://image.slidesharecdn.com/lect6-240428094950-5ae10406/85/Pandas-Data-Cleaning-and-Preprocessing-PPT-pptx-25-320.jpg)


![제 23회 보아즈(BOAZ) 빅데이터 컨퍼런스 - [MBOAX] : ABSA를 활용한 소비자 반응 분석 기반 운영 효율화 대시보드 설계](https://cdn.slidesharecdn.com/ss_thumbnails/3-1boaz23rdconferencemboax-260203102709-9d519923-thumbnail.jpg?width=640&height=640&fit=bounds)

