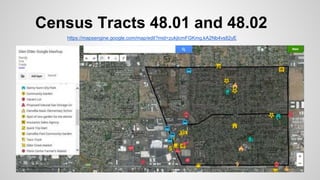
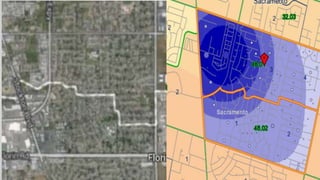
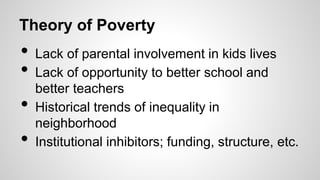
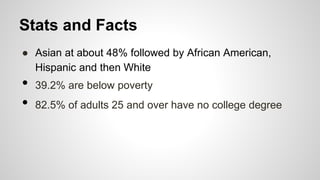
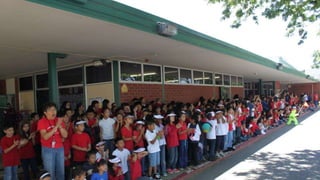
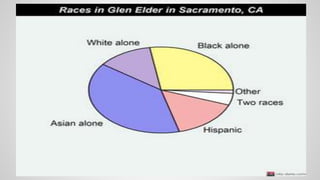
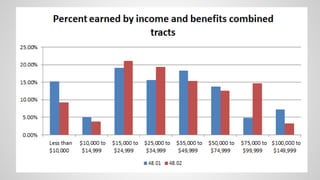
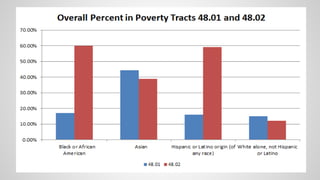
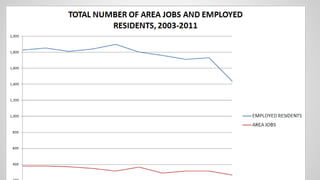
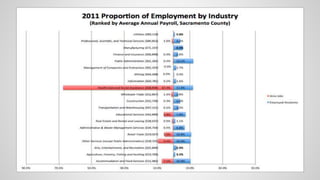
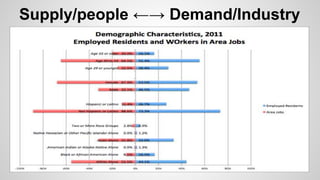
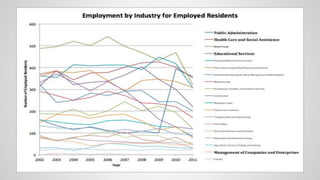
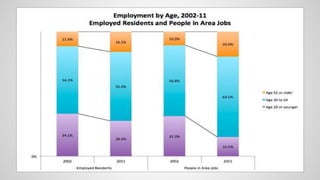
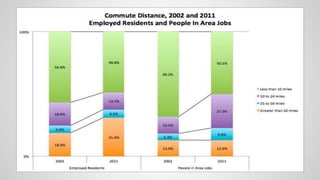
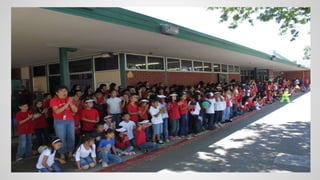
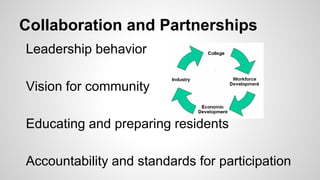
This document discusses the Glen Elder community in southeast Sacramento and provides statistics and factors related to poverty in the area. It notes that the community has great potential for dynamic change. Census tracts 48.01 and 48.02 show Asians make up about 48% of the population, with 39.2% living below the poverty line and most adults lacking a college degree. Theories of poverty mentioned include a lack of parental involvement, limited educational opportunities, and historical inequality. The document stresses the importance of collaboration between community resources and industries to provide opportunities that can help lift residents out of poverty through leadership, vision, education, accountability and participation.
2. Census Tracts 48.01 and 48.02
https://mapsengine.google.com/map/edit?mid=zukjlcmFGKmg.kA2Nb4vs82yE
3.
4. Theory of Poverty
• Lack of parental involvement in kids lives
• Lack of opportunity to better school and
better teachers
• Historical trends of inequality in
neighborhood
• Institutional inhibitors; funding, structure, etc.
5. Stats and Facts
● Asian at about 48% followed by African American,
Hispanic and then White
• 39.2% are below poverty
• 82.5% of adults 25 and over have no college degree
This is our Mashup map of the Glen Elder neighborhood and some of the important points that we included, with embedded pictures, videos, and synthesized notes on the area.
Here is the criteria based Elementary school called Camellia Elementary. Much of the proposal was selected only after talking to a couple teachers at this school.
This graph shows a big proportion of Asian residents in the Glen Elder Neighborhood. Next is Black, followed by hispanic and white.
This graph show the big proportion of young residents in the neighborhood. One big reason that brought me to the idea of having a teen youth center was because of this data. Many women (housewives?) - will have interests in education, motivate children, and encourage wise investments for the future.
This graph shows that the majority of residents are earning between $15,000 and $49,000 for both tracts. Some noteworthy features are that in 48.01 there are 7% more households earning $10,000 or less and in 48.02 there are 10% earning $75,000 to $99,999 per year.
African Americans and Hispanics are quite salient in the 48.02 tract of this graph. To have a poverty level of 60 percent among these ethnicities tells us that there are broader institutional forces at play. Asians also make up a big proportion of those in poverty.
Approximately 20 percent attend college but are unable to graduate. The rest, making up around 15%, receive some type of a degree. This is well below the state average and this is strong proof to show why education from a younger age needs to be a high priority. This graph shows how the amount of employed residents in Glen Elder has been going down at a steady rate since about 2006. In the year 2010 things got even worse and the Glen Elder Workforce took a nose dive with about 300 residents losing their jobs. Some of the credit for this can be given to the bad economy but I believe that most these residents find it hard to find jobs in this society because of their lack of education. Most jobs now require at least some amount of college education which most Glen Elder Residents just don’t have. An adult education center would be great for this community because it would set them up and prepare them for the workforce of today.
This being the Northern section of Glen Elder, we can see that most of the jobs in this area are in Health care and Social Assistance. This makes up 67.4% of jobs in this side of town. But only 11.9% of employed residents work in this field. This probably means that if there are abundant amount of Health Care related jobs, they are most likely being taken by people who live outside the neighborhood and find themselves having to commute here. What is also very significant from this graph is that the residents who are working in the area, as shown in the top blue bars, have jobs that make more money than residents commuting from outside of the neighborhood.
When it comes to Demographic Characteristics of employed Residents, I would have to say that most of the employed residents are between the ages 30 and 54. They make up about 55% of the Glen Elder Workforce. This Workforce is made up primarily of Non Hispanic or Latino, which sums to be about 73.3%. About 31.8% of Area jobs alone, are going to the Asian community. Most jobs although, are going to White residents, who make up about 55.5% of Area jobs.
Top 4 industry employment industries where potential job growth can be expected.
In this slide we can see that the number of employed residents in the age range of 29 or younger dropped about 6.5% between the year 2002 and 2011. I would have to say that this might most likely have to do with decline in the economy which has made it difficult for the younger generation of communities to find jobs. Another big change we can see from these graphs is that Area jobs decreased about 10%-15% across every age group..
From these graphs we can see that, for employed residents, there was an increase of about 12% of residents who now find themselves having to commute a distance of 50 miles or greater. This means that most likely residents are having to travel a further distance to find better jobs, or jobs in general.
Seemingly appropriate lot: reasonable space, trees, convenient location, close to food and drugstore, easily accessible, etc.
Here is the school (Camellia Elementary) where i had the opportunity to speak with two teachers (one of which is on the left side. I learned that even though this is a public elementary schoo, not any student is admitted unless they show strong performance. I also learned that many of the students are actually commuting from outside of the neighborhood to go to this school.