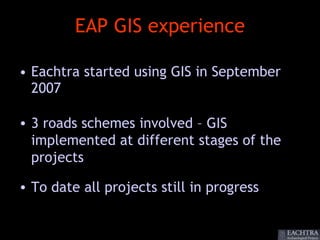
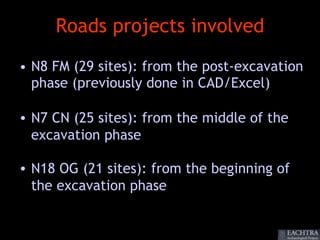
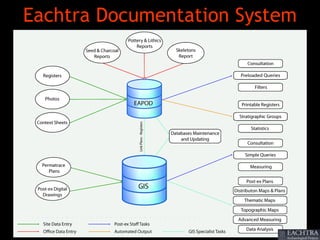
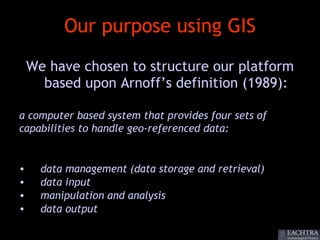
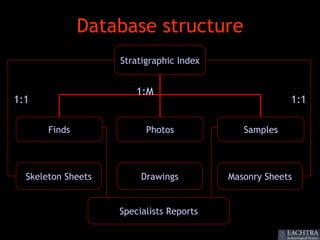
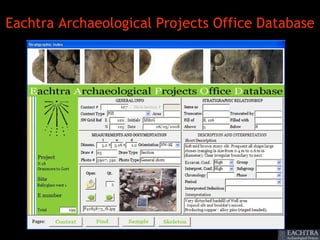
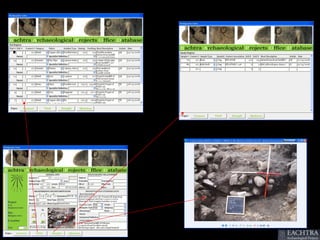
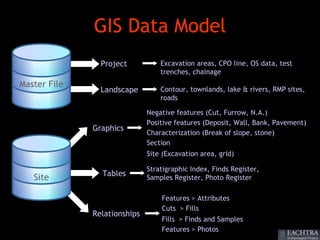
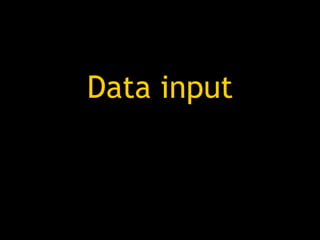
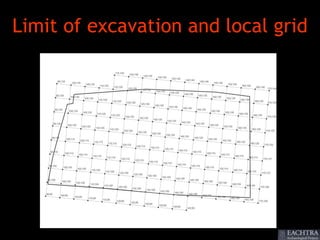
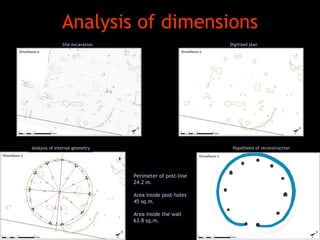
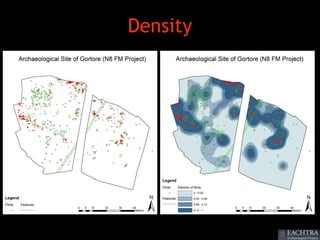
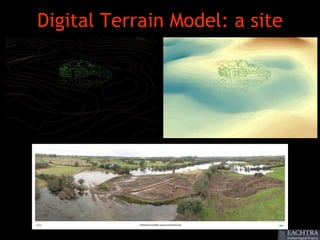
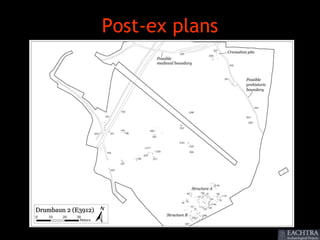
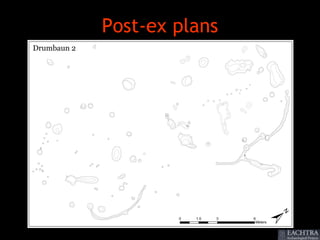
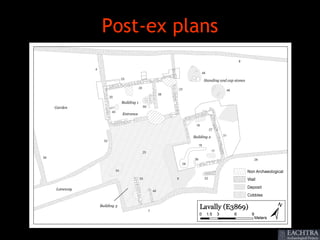
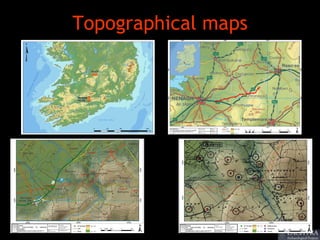
The use of GIS on large scale
  infrastructural projects in Ireland.
Excavation, post-excavation and publication.


            Maurizio Toscano

      Eachtra Archaeological Projects
EAP GIS experience

• Eachtra started using GIS in September
  2007

• 3 roads schemes involved – GIS
  implemented at different stages of the
  projects

• To date all projects still in progress
Roads projects involved
• N8 FM (29 sites): from the post-excavation
  phase (previously done in CAD/Excel)

• N7 CN (25 sites): from the middle of the
  excavation phase

• N18 OG (21 sites): from the beginning of
  the excavation phase
Eachtra Documentation System
Our purpose using GIS
    We have chosen to structure our platform
      based upon Arnoff’s definition (1989):

a computer based system that provides four sets of
capabilities to handle geo-referenced data:


•     data management (data storage and retrieval)
•     data input
•     manipulation and analysis
•     data output
Data management
Database structure
                    Stratigraphic Index


                        1:M
1:1                                                    1:1

       Finds              Photos             Samples


  Skeleton Sheets        Drawings         Masonry Sheets


                    Specialists Reports
Eachtra Archaeological Projects Office Database
GIS Data Model
                Project           Excavation areas, CPO line, OS data, test
                                  trenches, chainage
Master File
                Landscape         Contour, townlands, lake & rivers, RMP sites,
                                  roads

                              Negative features (Cut, Furrow, N.A.)
                              Positive features (Deposit, Wall, Bank, Pavement)
              Graphics
                              Characterization (Break of slope, stone)
                              Section
                              Site (Excavation area, grid)

                              Stratigraphic Index, Finds Register,
                Tables
   Site                       Samples Register, Photo Register

                                  Features > Attributes
                                  Cuts > Fills
              Relationships
                                  Fills > Finds and Samples
                                  Features > Photos
Data input
Limit of excavation and local grid
Permatrace plans

• Individual plans are drawn
by grid square (5x5 m.);

• Each grid square plan is
then scanned as a raster
file.
Permatrace plans

Each grid square plan is
then put into place by
matching up the grid
square points on the
permatrace drawing to
the corresponding grid
square points on the
GIS site plan.
Permatrace plans
 Plans ‘stitched’ together
Permatrace plans
The composite raster plan created:
   – Makes it easier to see if something is missing / wrong;
   – Avoids searching through archive boxes and numerous
     plans to find the plan you’re looking for;
   – Stores the Irish grid position and can be placed directly in
     the right position into others programs / GIS platforms;
   – Represents a comprehensive digital archive for all the
     post-ex sites drawings.

Using this method, unlike when using CAD and a drawing
tablet, we can zoom into the plan and digitise up to 1:1
scale, respecting the real shape of the object giving a
higher degree of accuracy to the final drawing.
Geometry
All the digitized graphs are stored in the database and
classified according to logic scheme previously created;
Stratigraphical units are organized into three types, with
relative subtypes, and represented with a specific geometry:
   – Positive units like polygon objects, because they represents
     real surfaces;
   – Negative units like linear objects, because of their nature of
     surface without material consistency;
   – Characterisations like linear objects, because they are used
     just to describe the aspect of the features;
   – Section like linear objects, because of their nature of arbitrary
     boundaries.
Thanks to the connected database, all digitized drawings are
“stratigraphically informed”.
Aerial photo

        Enclosure:
        Perimeter 220 m.
        Area 3.000 sq. m.
Geophysical data
Historical maps
Manipulation and
    analysis
Overlay
Database query
• There are two types of possible queries in a GIS
  platform: spatial and on attributes:
   – Spatial queries are used to identify / select objects
     depending on their mutual position;
   – Query on attributes can be performed using SQL
     (Structured Query Language) and are used to identify /
     select objects through one or more of their attributes;

• An example of SQL query:
    SELECT * FROM neg_features WHERE c_type LIKE “stakehole”
    AND deep > 0.1 AND period NOT LIKE “Bronze Age”
• This query selects all of the stakeholes deeper than
  10 cm and that are not of Bronze Age in date.
Statistical and Tabular Analysis
                            40                                                                                           100%


                            35

                                                                                                                         80%                                                         Fulacht fiadh altitude analysis
                            30


                                                                                                                                Cumulative frequecy curve
Quantity of Fulacht Fiadh


                            25
                                                                                                                         60%                                                              Mean                                      109.3
                            20                                                                                                                                                            Standard Deviation                          39.4
                            15
                                                                                                                         40%
                                                                                                                                                                                          Minimum                                     24.5
                            10                                                                                                                                                            Maximum                                   290.9
                                                                                                                         20%

                             5                                                                                                                                                            Count                                           469
                             0                                                                                           0%
                                 5   20   35   50   65   80   95   110 125 140 155 170 185 200 215 230 245 260 275 290

                                                                       Altitude in meters                                                                                45                                       42.4

                                                                                                                                                                         40

                                                                                                                                                                         35


                                     Study Area                                                                                                             Percentage   30                                27.7

                                                                                                                                                                         25                         22.8
                                     Extent                                                 2827.4 km2                                                                                       19.8
                                                                                                                                                                                                                            21.3
                                                                                                                                                                         20                                                        18.5
                                                                                                                                                                                                                         17.5
                                     Minimum elevation                                                         0
                                                                                                                                                                         15                                                               12.6    13.4

                                     Maximum elevation                                                904.9                                                              10

                                     Mean                                                             147.6                                                              5    3.1
                                                                                                                                                                                    0.4                                                                  0.4
                                                                                                                                                                         0
                                                                                                                                                                                40               80          120           160       240             900
                                                                                                                                                                                                              Height Classes
                                                                                                                                                                                                                                   Landscape     Fulacht Fiadh
Statistical and Tabular Analysis
               Fulacht fiadh river distance analysis
 Mean         381.0                                    100                                                  100%
                                                        90                                                  90%
 Standard


                                                                                                                   Cumulative frequency curve
                                                        80                                                  80%
 Deviation    369.0


                            Quantity of Fulach Fiadh
                                                        70                                                  70%
 Minimum         0                                      60                                                  60%
                                                        50                                                  50%
 Maximum     1949.8
                                                        40                                                  40%
 Count         469                                      30                                                  30%
                                                        20                                                  20%
                                                        10                                                  10%
                                                         0                                                  0%


                                                             0
                                                             0
                                                             0
                                                             0
                                                             0
                                                             0
                                                             0
                                                             0

                                                        10 0
                                                           50


                                                           50
                                                           50
                                                           50

                                                        14 0
                                                           50
                                                           50
                                                           50

                                                        18 0
                                                           50
                                                           50
                                                         15
                                                         25
                                                         35
                                                         45


                                                         65
                                                         75
                                                         55


                                                         85
                                                         95


                                                           5


                                                           5
                                                        11
                                                        12
                                                        13


                                                        15
                                                        16
                                                        17


                                                        19
                                                             Distance in meters to nearest water resource
Analysis of dimensions
               Site excavation                            Digitized plan


Analysis of internal geometry                              Hypothesis of reconstruction


                                 Perimeter of post-line
                                 24.2 m.

                                 Area inside post-holes
                                 45 sq.m.

                                 Area inside the wall
                                 63.8 sq.m.
Density
Digital Terrain Model: a kiln
Digital Terrain Model: a site
Data output
Post-ex plans
Post-ex plans
Post-ex plans
Topographical maps
Thematic maps
Thematic plans
Distribution maps
Distribution maps
Benefits of GIS
Benefits on data management

• Ideally, any kind of archaeological data can be input
  and manipulated in a GIS platform;

• Archaeology produces a vast amount of data, often
  underused because of difficulties to access and
  relating to them;

• At the end of the project, the GIS platform
  represents a complete digital archive, giving post-ex
  researchers a powerful tool to improve the degree of
  accuracy of site interpretation;
Benefits during project development
• GIS methodology requires an organised and
  standardised approach to everything undertaken,
  involving all workflow from data-recording
  techniques to on-site data entry and digital storing;

• Vector data are suited to transfer into paper
  publication but also ready for amalgamation with
  other datasets as our future needs require;

• GIS approach transform plans from an illustration of
  something already completed to an instrument of
  research.
There may be a reluctance to adopt a GIS
platform to replace a CAD/Illustrator approach.
    Firstly a GIS technician is required and a
 certain amount of time is needed at start-up,
 but carrying out the project, time to perform
 different tasks will be reduced and results can
                    be better.
The use of GIS on large scale
  infrastructural projects in Ireland.
Excavation, post-excavation and publication.


            Maurizio Toscano

      Eachtra Archaeological Projects

Archaeological GIS on Infrastructural Projects in Ireland

  • 1.
    The use ofGIS on large scale infrastructural projects in Ireland. Excavation, post-excavation and publication. Maurizio Toscano Eachtra Archaeological Projects
  • 2.
    EAP GIS experience •Eachtra started using GIS in September 2007 • 3 roads schemes involved – GIS implemented at different stages of the projects • To date all projects still in progress
  • 3.
    Roads projects involved •N8 FM (29 sites): from the post-excavation phase (previously done in CAD/Excel) • N7 CN (25 sites): from the middle of the excavation phase • N18 OG (21 sites): from the beginning of the excavation phase
  • 4.
  • 5.
    Our purpose usingGIS We have chosen to structure our platform based upon Arnoff’s definition (1989): a computer based system that provides four sets of capabilities to handle geo-referenced data: • data management (data storage and retrieval) • data input • manipulation and analysis • data output
  • 6.
  • 7.
    Database structure Stratigraphic Index 1:M 1:1 1:1 Finds Photos Samples Skeleton Sheets Drawings Masonry Sheets Specialists Reports
  • 8.
  • 10.
    GIS Data Model Project Excavation areas, CPO line, OS data, test trenches, chainage Master File Landscape Contour, townlands, lake & rivers, RMP sites, roads Negative features (Cut, Furrow, N.A.) Positive features (Deposit, Wall, Bank, Pavement) Graphics Characterization (Break of slope, stone) Section Site (Excavation area, grid) Stratigraphic Index, Finds Register, Tables Site Samples Register, Photo Register Features > Attributes Cuts > Fills Relationships Fills > Finds and Samples Features > Photos
  • 11.
  • 12.
    Limit of excavationand local grid
  • 13.
    Permatrace plans • Individualplans are drawn by grid square (5x5 m.); • Each grid square plan is then scanned as a raster file.
  • 14.
    Permatrace plans Each gridsquare plan is then put into place by matching up the grid square points on the permatrace drawing to the corresponding grid square points on the GIS site plan.
  • 15.
    Permatrace plans Plans‘stitched’ together
  • 16.
    Permatrace plans The compositeraster plan created: – Makes it easier to see if something is missing / wrong; – Avoids searching through archive boxes and numerous plans to find the plan you’re looking for; – Stores the Irish grid position and can be placed directly in the right position into others programs / GIS platforms; – Represents a comprehensive digital archive for all the post-ex sites drawings. Using this method, unlike when using CAD and a drawing tablet, we can zoom into the plan and digitise up to 1:1 scale, respecting the real shape of the object giving a higher degree of accuracy to the final drawing.
  • 17.
    Geometry All the digitizedgraphs are stored in the database and classified according to logic scheme previously created; Stratigraphical units are organized into three types, with relative subtypes, and represented with a specific geometry: – Positive units like polygon objects, because they represents real surfaces; – Negative units like linear objects, because of their nature of surface without material consistency; – Characterisations like linear objects, because they are used just to describe the aspect of the features; – Section like linear objects, because of their nature of arbitrary boundaries. Thanks to the connected database, all digitized drawings are “stratigraphically informed”.
  • 18.
    Aerial photo Enclosure: Perimeter 220 m. Area 3.000 sq. m.
  • 19.
  • 20.
  • 21.
  • 22.
  • 23.
    Database query • Thereare two types of possible queries in a GIS platform: spatial and on attributes: – Spatial queries are used to identify / select objects depending on their mutual position; – Query on attributes can be performed using SQL (Structured Query Language) and are used to identify / select objects through one or more of their attributes; • An example of SQL query: SELECT * FROM neg_features WHERE c_type LIKE “stakehole” AND deep > 0.1 AND period NOT LIKE “Bronze Age” • This query selects all of the stakeholes deeper than 10 cm and that are not of Bronze Age in date.
  • 24.
    Statistical and TabularAnalysis 40 100% 35 80% Fulacht fiadh altitude analysis 30 Cumulative frequecy curve Quantity of Fulacht Fiadh 25 60% Mean 109.3 20 Standard Deviation 39.4 15 40% Minimum 24.5 10 Maximum 290.9 20% 5 Count 469 0 0% 5 20 35 50 65 80 95 110 125 140 155 170 185 200 215 230 245 260 275 290 Altitude in meters 45 42.4 40 35 Study Area Percentage 30 27.7 25 22.8 Extent 2827.4 km2 19.8 21.3 20 18.5 17.5 Minimum elevation 0 15 12.6 13.4 Maximum elevation 904.9 10 Mean 147.6 5 3.1 0.4 0.4 0 40 80 120 160 240 900 Height Classes Landscape Fulacht Fiadh
  • 25.
    Statistical and TabularAnalysis Fulacht fiadh river distance analysis Mean 381.0 100 100% 90 90% Standard Cumulative frequency curve 80 80% Deviation 369.0 Quantity of Fulach Fiadh 70 70% Minimum 0 60 60% 50 50% Maximum 1949.8 40 40% Count 469 30 30% 20 20% 10 10% 0 0% 0 0 0 0 0 0 0 0 10 0 50 50 50 50 14 0 50 50 50 18 0 50 50 15 25 35 45 65 75 55 85 95 5 5 11 12 13 15 16 17 19 Distance in meters to nearest water resource
  • 26.
    Analysis of dimensions Site excavation Digitized plan Analysis of internal geometry Hypothesis of reconstruction Perimeter of post-line 24.2 m. Area inside post-holes 45 sq.m. Area inside the wall 63.8 sq.m.
  • 27.
  • 28.
  • 29.
  • 30.
  • 31.
  • 32.
  • 33.
  • 34.
  • 35.
  • 36.
  • 37.
  • 38.
  • 39.
  • 40.
    Benefits on datamanagement • Ideally, any kind of archaeological data can be input and manipulated in a GIS platform; • Archaeology produces a vast amount of data, often underused because of difficulties to access and relating to them; • At the end of the project, the GIS platform represents a complete digital archive, giving post-ex researchers a powerful tool to improve the degree of accuracy of site interpretation;
  • 41.
    Benefits during projectdevelopment • GIS methodology requires an organised and standardised approach to everything undertaken, involving all workflow from data-recording techniques to on-site data entry and digital storing; • Vector data are suited to transfer into paper publication but also ready for amalgamation with other datasets as our future needs require; • GIS approach transform plans from an illustration of something already completed to an instrument of research.
  • 42.
    There may bea reluctance to adopt a GIS platform to replace a CAD/Illustrator approach. Firstly a GIS technician is required and a certain amount of time is needed at start-up, but carrying out the project, time to perform different tasks will be reduced and results can be better.
  • 43.
    The use ofGIS on large scale infrastructural projects in Ireland. Excavation, post-excavation and publication. Maurizio Toscano Eachtra Archaeological Projects