This document discusses several key issues related to global energy sources, demand, and sustainability:
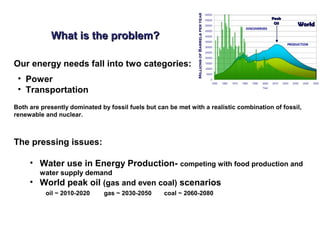
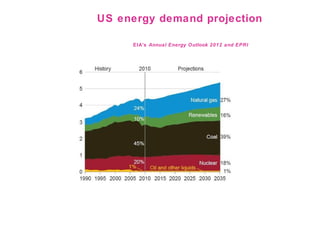
1) Peak levels of fossil fuels like oil, gas, and coal may be reached within the next few decades, between 2010-2080.
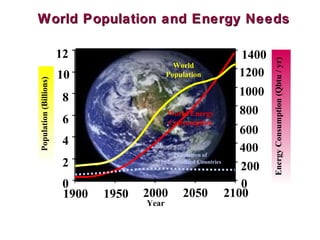
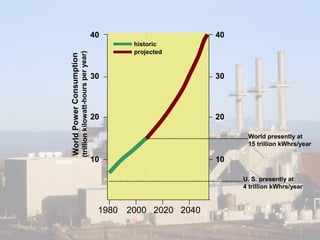
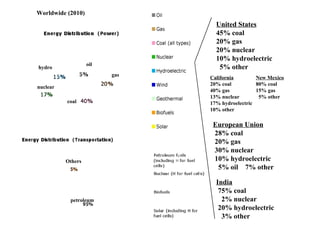
2) Meeting growing global energy needs will require a combination of fossil fuels, renewables, and nuclear power given world population and consumption trends.
3) Water use for energy production competes with other needs like food and drinking water supply.
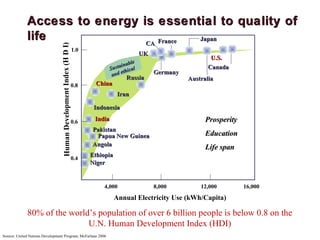
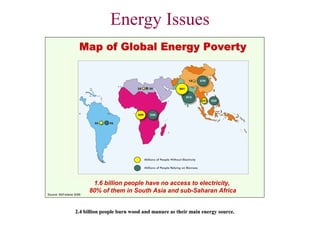
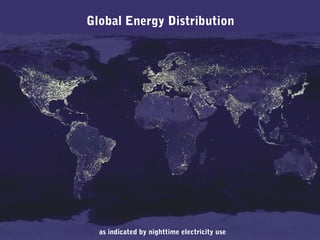
4) Over 1.6 billion people lack access to electricity, mostly in South Asia and sub-Saharan Africa, and 2.4 billion rely mainly on burning biomass like wood and manure.


![[Challenge:Future] Disrupt your world: The Future of Work](https://cdn.slidesharecdn.com/ss_thumbnails/challengefuture-disrupt-your-world-the-future-of-work2523-130228034925-phpapp01-thumbnail.jpg?width=640&height=640&fit=bounds)


