Downloaded 39 times

![Strong Growth in Electricity …
Wind Bioenergy Solar PV Hydro other
Generation
338 296 31 3503 74
2010 [TWh]
CAGR 2005-
26.5% 8.8% 50.8% 3.1% 4.6%
2010 [%]
© OECD/IEA 2010](https://image.slidesharecdn.com/chilerenconferencemay102012nn-120514092309-phpapp01/85/Renewable-Energy-An-IEA-Perspective-3-320.jpg)
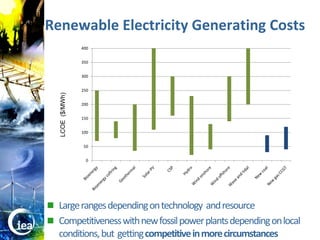
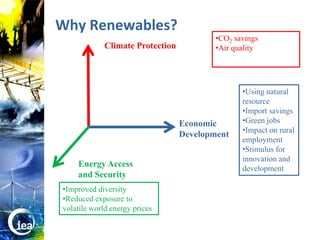
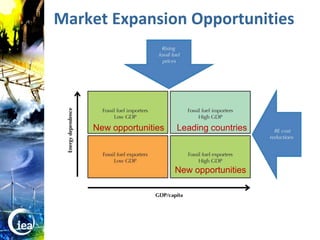
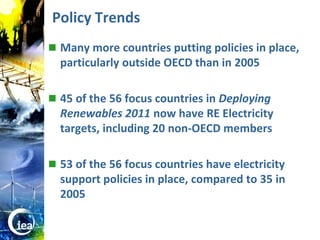
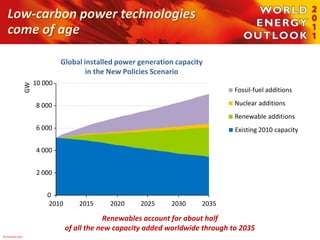
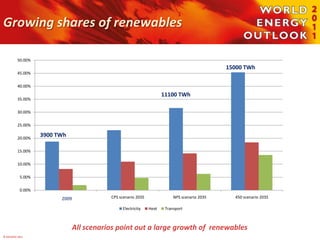

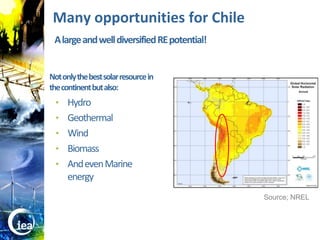
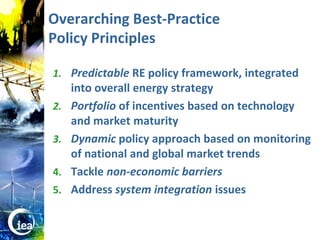


The document discusses the growing importance and competitiveness of renewable energy sources globally, highlighting significant trends, costs, and benefits. It emphasizes the need for supportive policies, particularly in Chile, which has a rich potential for diverse renewable resources. The report concludes that renewables will play a crucial role in achieving energy security and sustainability.


![Getting Started with Apache Spark: Big Data Made Simple [Free Meetup]](https://cdn.slidesharecdn.com/ss_thumbnails/apachesparkgettingstarted-260203175547-8361bcc3-thumbnail.jpg?width=640&height=640&fit=bounds)


