Download to read offline


![The Global PV market
WORLD PV MARKET
[MWp/year]
NEWLY INSTALLED PV POWER
18,000
16,000
CAGR: 52%
14,000
12,000
10,000
Crisis, what crisis?
8,000
6,000 2009: +15% growth
2010: +100%
4,000
2011: +15%...?
2,000
-
2001
2002
2003
2004
2005
2006
2007
2008
2009
2010
2011](https://image.slidesharecdn.com/01-edwinkoot-solarplaza-110404142353-phpapp02/85/01-edwin-koot-solarplaza-5-320.jpg)
![Market hard to predict…
WORLD PV MARKET WORLD PV MARKET
[MWp/year] [MWp/year] 2011 FORECAST NEWLY INSTALLED PV
2009 FORECAST NEWLY INSTALLED
PV POWER POWER
12,000 18,000
16,000
10,000
14,000
8,000 12,000
10,000
6,000
8,000
4,000 6,000
4,000
2,000
2,000
- -
2001
2002
2003
2004
2005
2006
2007
2008
2009
2010
2011
2001
2002
2003
2004
2005
2006
2007
2008
2009](https://image.slidesharecdn.com/01-edwinkoot-solarplaza-110404142353-phpapp02/85/01-edwin-koot-solarplaza-6-320.jpg)
![Module prices in decline…
Solarfun (NASDAQ)
$4.50
$4.00
$3.50
$3.00
-/- 59%
[$/Wp]
$2.50
$2.00
$1.50
$1.00
$0.50
$0.00
Q2-‐08
Q3-‐08
Q4-‐08
Q1-‐09
Q2-‐09
Q3-‐09
Q4-‐09
Q1-‐10
Q2-‐10
Q3-‐10
Q4-‐10
Q1-‐11
9](https://image.slidesharecdn.com/01-edwinkoot-solarplaza-110404142353-phpapp02/85/01-edwin-koot-solarplaza-9-320.jpg)
![Germany: the engine of the solar
industry…
16000
[MWp/year]
14000
12000
?
10000
Buerstad; 50.000 m2, Photo by Ralph Orlowski/2005 Getty
8000 Images, Inc.
6000
4000
2000
0
10 MW Sunpower project in Bavaria
2001 2003 2005 2007 2009 2011 2013
© Solarplaza April 2010; Data source: Bundesnetzagentur plus Solarplaza model](https://image.slidesharecdn.com/01-edwinkoot-solarplaza-110404142353-phpapp02/85/01-edwin-koot-solarplaza-10-320.jpg)

![Wind versus PV: 9 years’ difference
25.0
[GWp/yr]
Anticipated growth
20.0 of PV market
15.0
10.0
Wind energy data for 9
years ago; 2008 data
generated in 1999
5.0
PV market volume [GWp]
Wind energy market [GWp]
0.0
2001 2002 2003 2004 2005 2006 2007 2008 2009 2010 2011 2012 2013](https://image.slidesharecdn.com/01-edwinkoot-solarplaza-110404142353-phpapp02/85/01-edwin-koot-solarplaza-14-320.jpg)
![Wind versus solar energy
60
Wind
Energy
market
[GWp]
30% CAGR
50
PV
market
volume
[GWp]
40
30
20
10
0
1995
1997
1999
2001
2003
2005
2007
2009](https://image.slidesharecdn.com/01-edwinkoot-solarplaza-110404142353-phpapp02/85/01-edwin-koot-solarplaza-15-320.jpg)
![PV market growth scenarios
160
[GWp/yr]
140
Optimistic growth
scenario of 30%
120
Growth scenario
CAGR Wind –
100 of 25% > 2014 energy: 30%/year
€ 500 billion
80
60
40
25%/year
20
€ 190 billion
0
2004
2006
2008
2010
2012
2014
2016
2018
2020
© SolarPlaza June 2008; Data source: analyses by SolarPlaza based on various sources](https://image.slidesharecdn.com/01-edwinkoot-solarplaza-110404142353-phpapp02/85/01-edwin-koot-solarplaza-16-320.jpg)
![5 years ago &
5 years from now…
2006: 2011: 2016:
Global market [GWp]: 1.8 >17 >40
First Solar [MWp]: 100 >2250 >8000*
c-Si Module [$/Wp]: ≈4.50 1.80 <1.15
* Solarplaza 2016 estimate: 30% growth 2013-2016](https://image.slidesharecdn.com/01-edwinkoot-solarplaza-110404142353-phpapp02/85/01-edwin-koot-solarplaza-17-320.jpg)
![Growth electricity consumption
World Net Electricity Power Generation
[Trillion kWh/year] EIA forecast [GW] Fully covered
3,000
by new PV
30 power
+16%
2,500
25
2,000
20
15
1,500
10
1,000
Expected new
5
500
PV power
0
-‐
2015
2010
2015](https://image.slidesharecdn.com/01-edwinkoot-solarplaza-110404142353-phpapp02/85/01-edwin-koot-solarplaza-18-320.jpg)


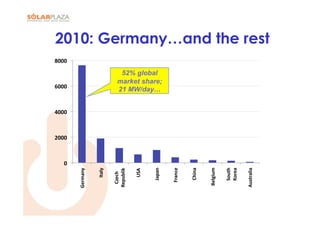
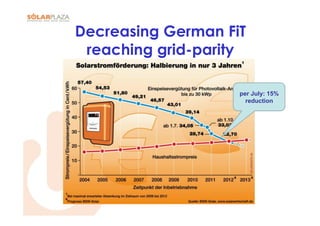
The document discusses past and projected growth in the global solar PV market from 2001-2011 and beyond. It notes that the market grew at an average annual rate of 52% from 2001-2010, with particularly rapid growth in 2009-2010. Germany has been the leading country for installed capacity but its market may be nearing saturation. Module prices declined sharply from 2008-2010. The document considers whether the solar PV market will continue growing at similar rates or begin to slow and outlines optimistic and conservative scenarios for market growth through 2020.


![[Challenge:Future] Disrupt your world: The Future of Work](https://cdn.slidesharecdn.com/ss_thumbnails/challengefuture-disrupt-your-world-the-future-of-work2523-130228034925-phpapp01-thumbnail.jpg?width=640&height=640&fit=bounds)


