Download to read offline

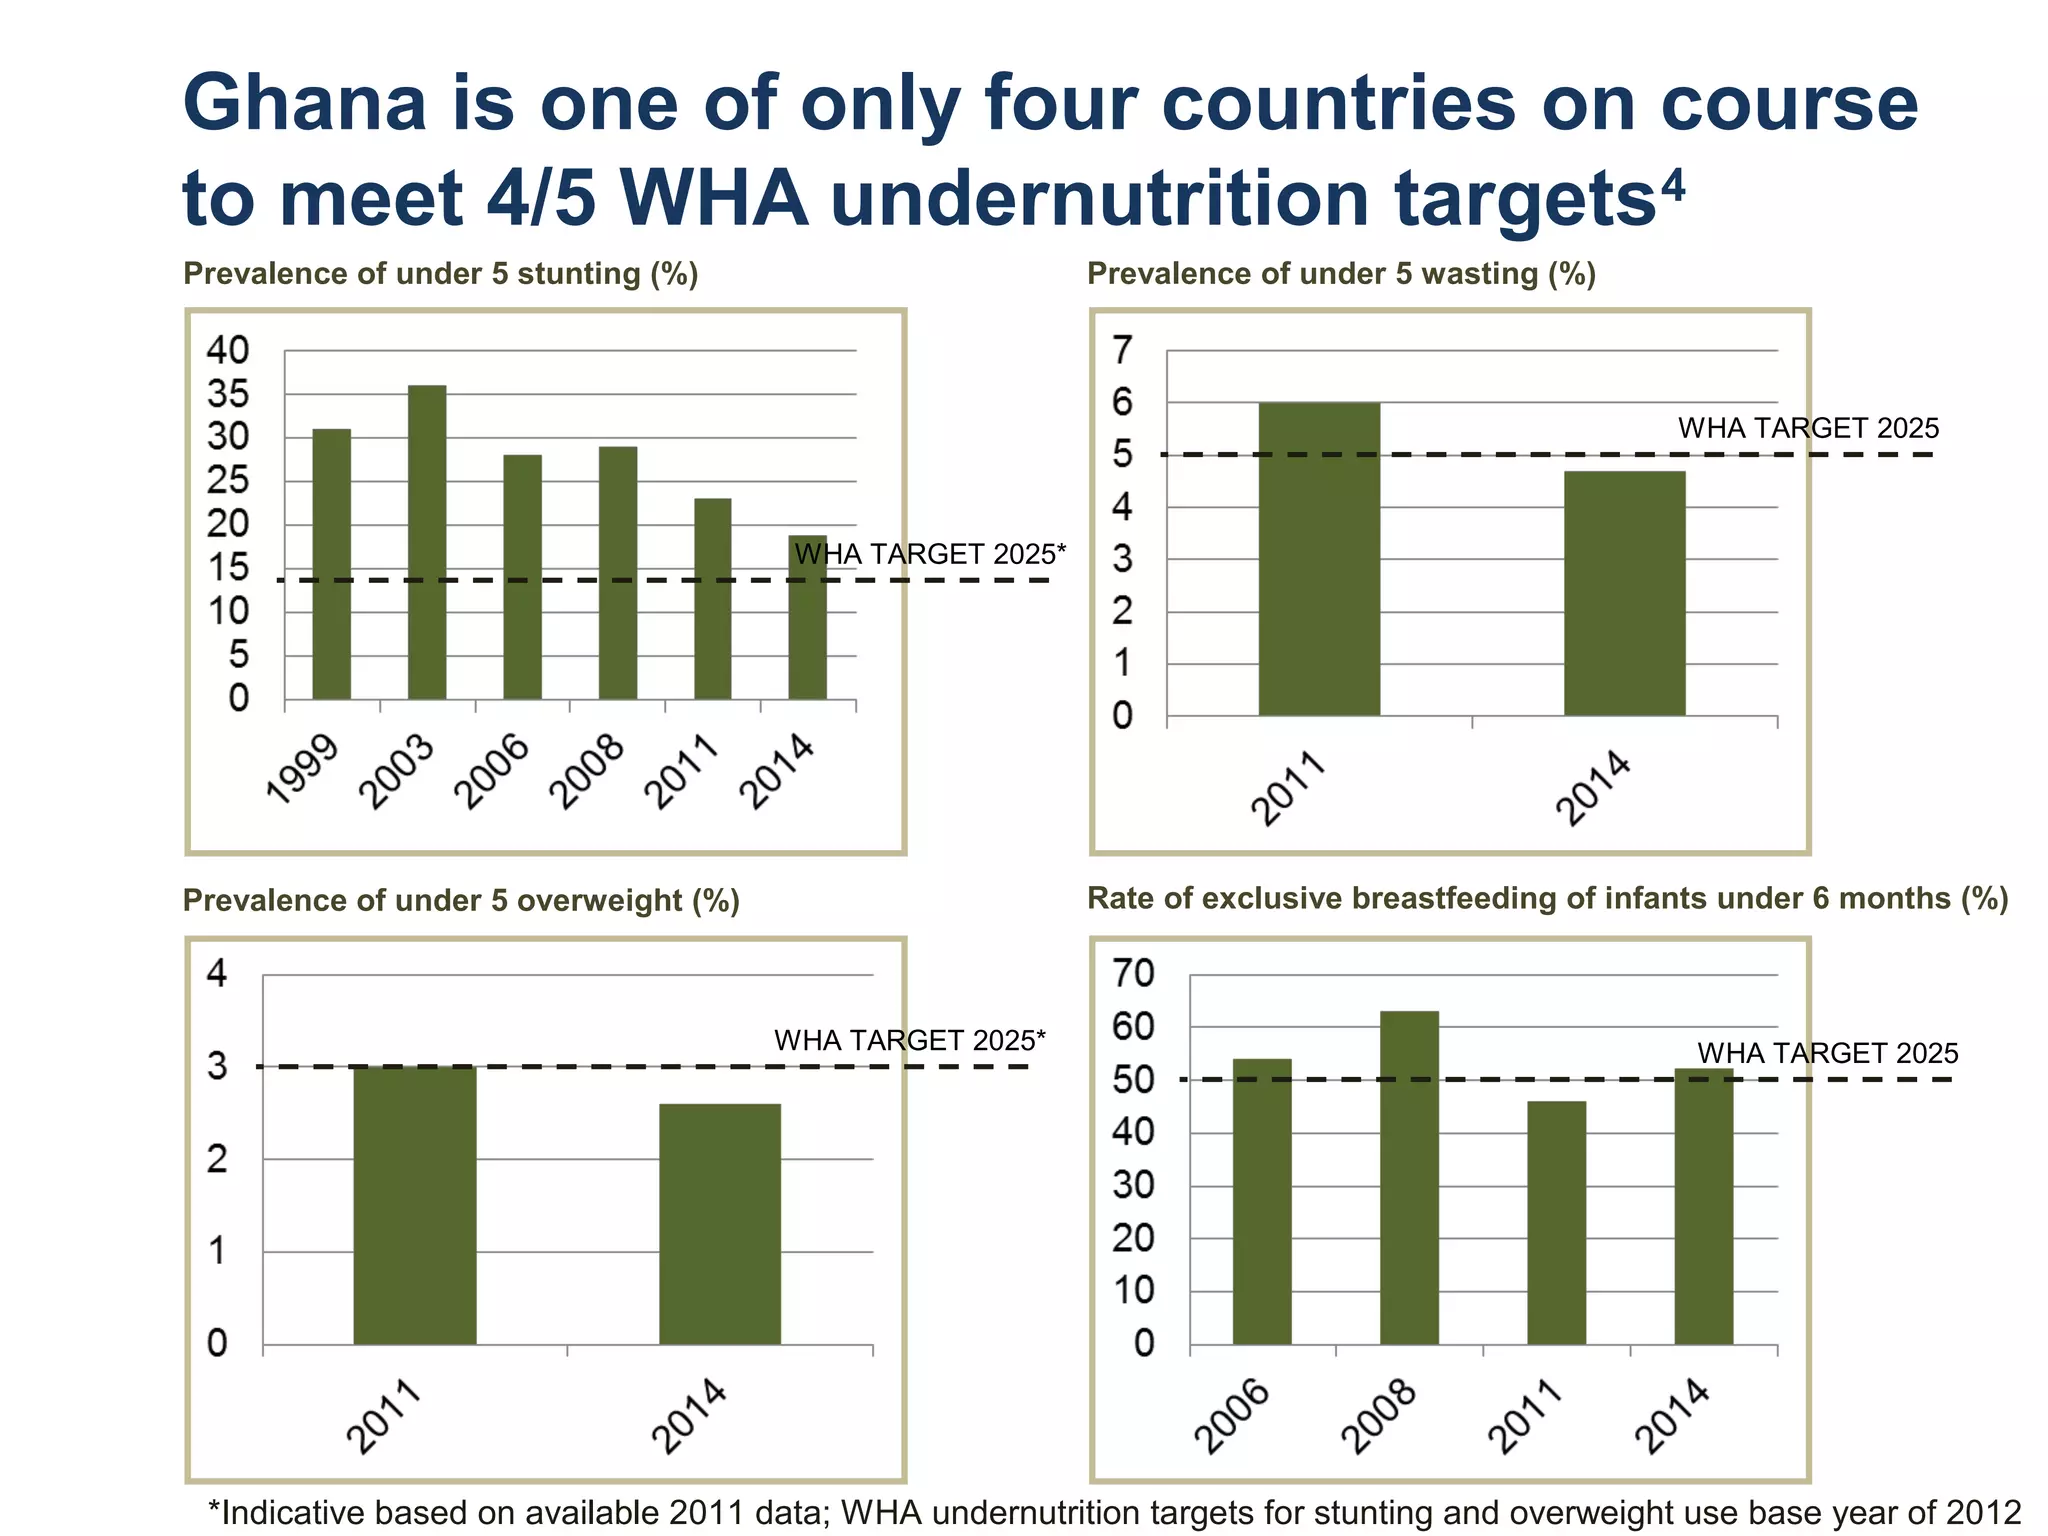
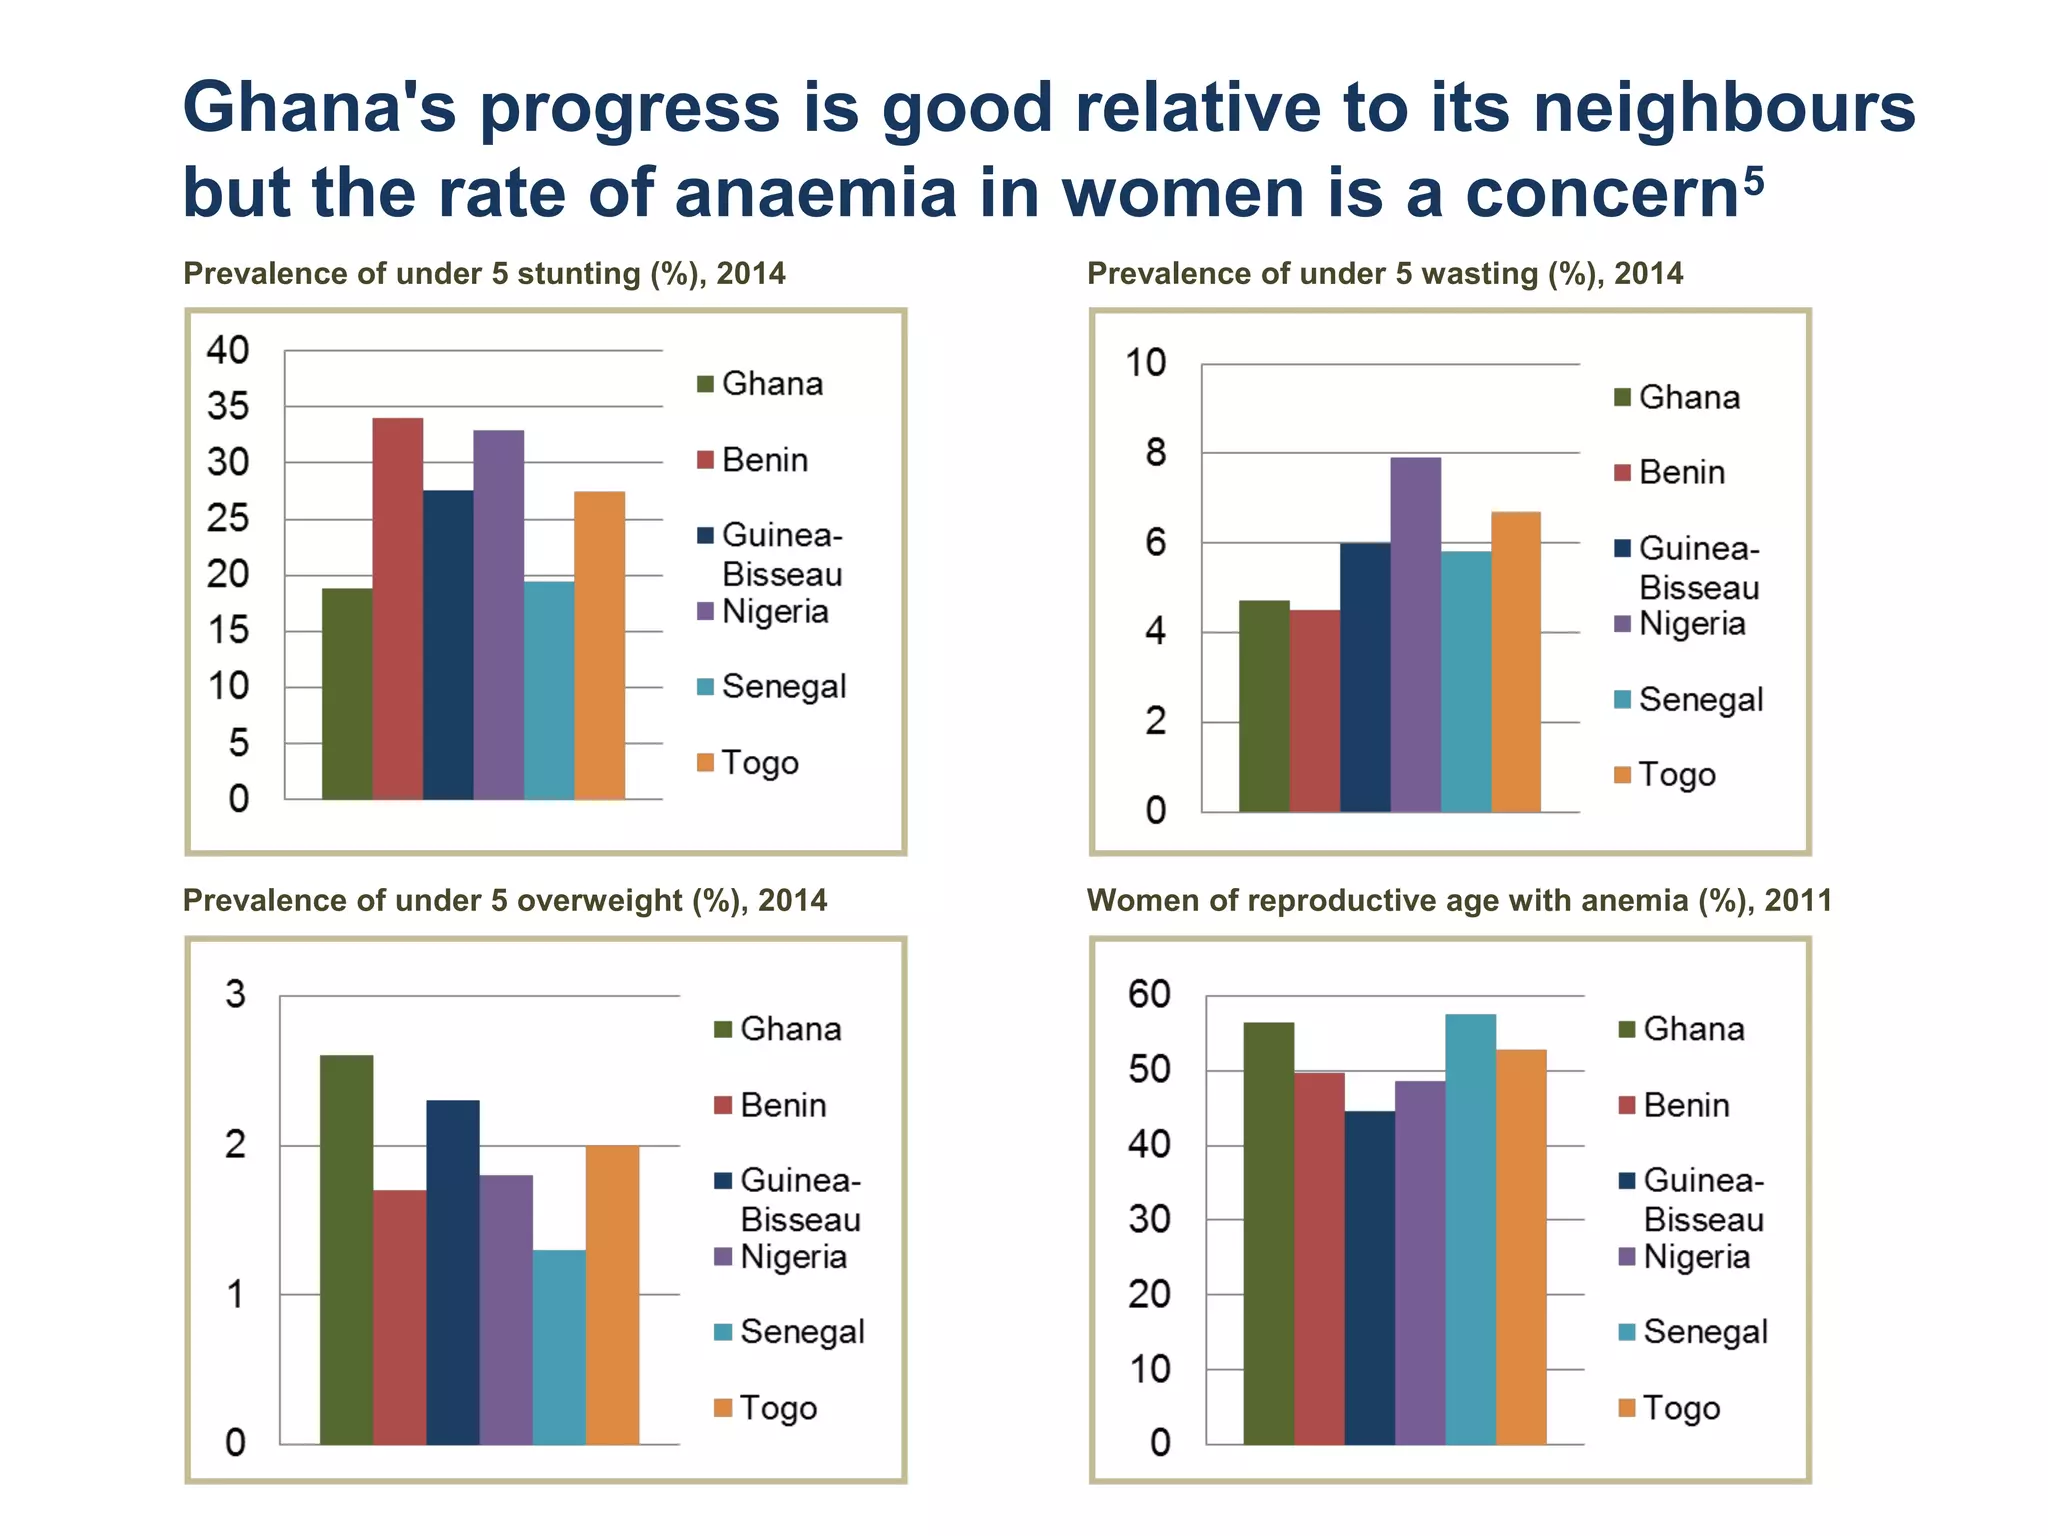

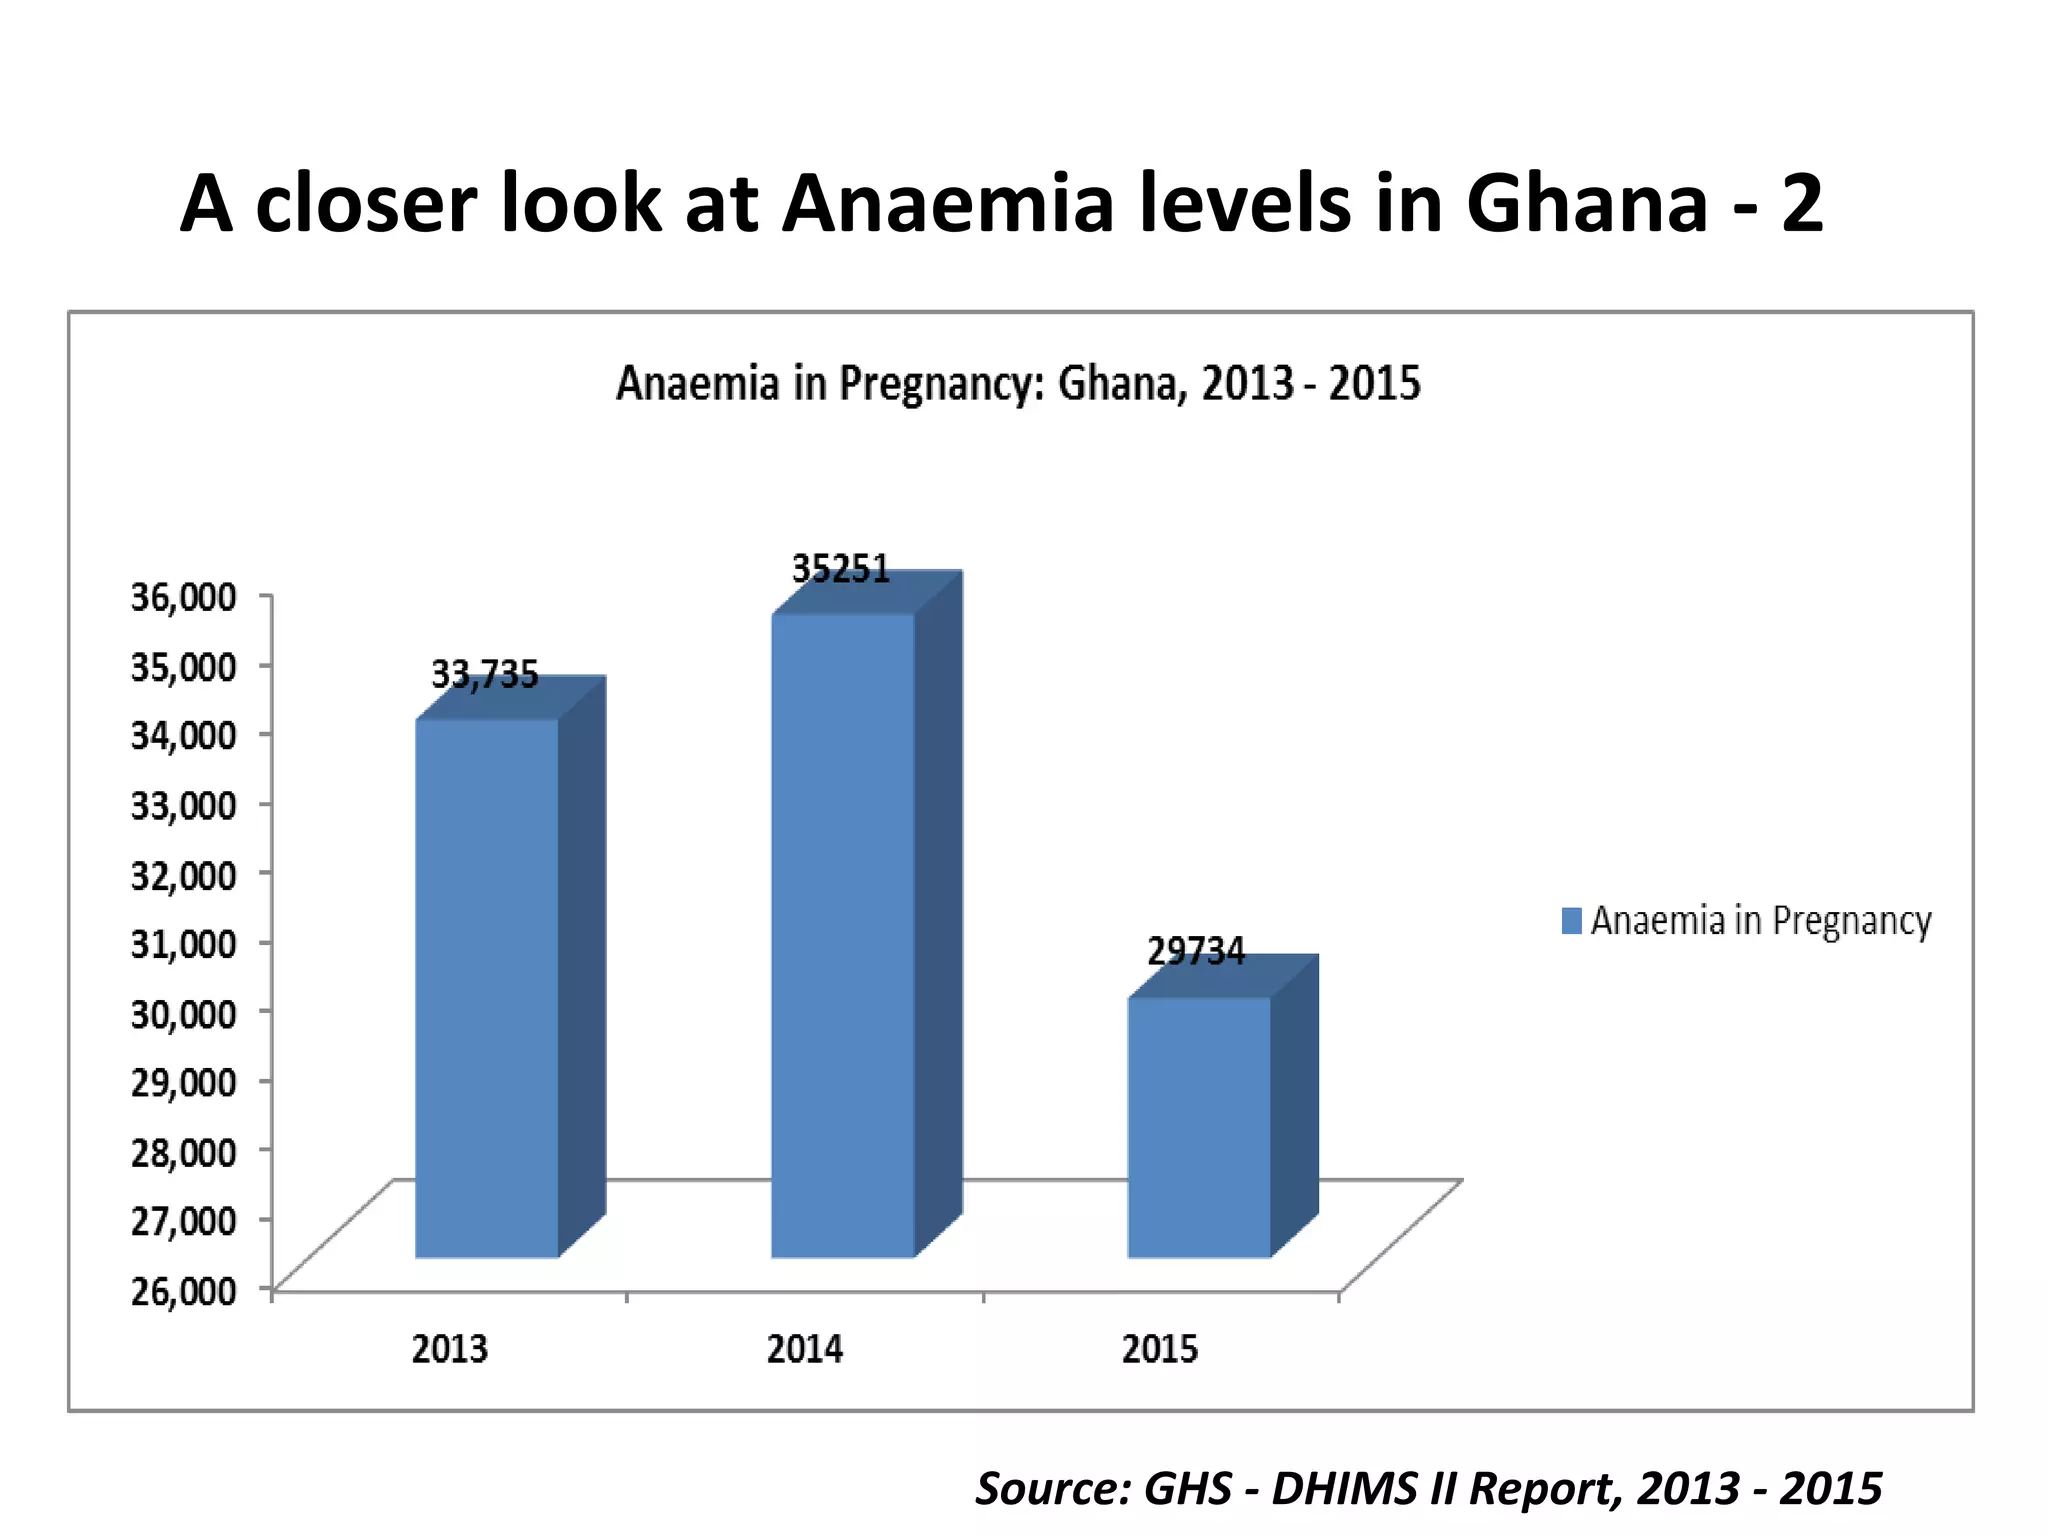


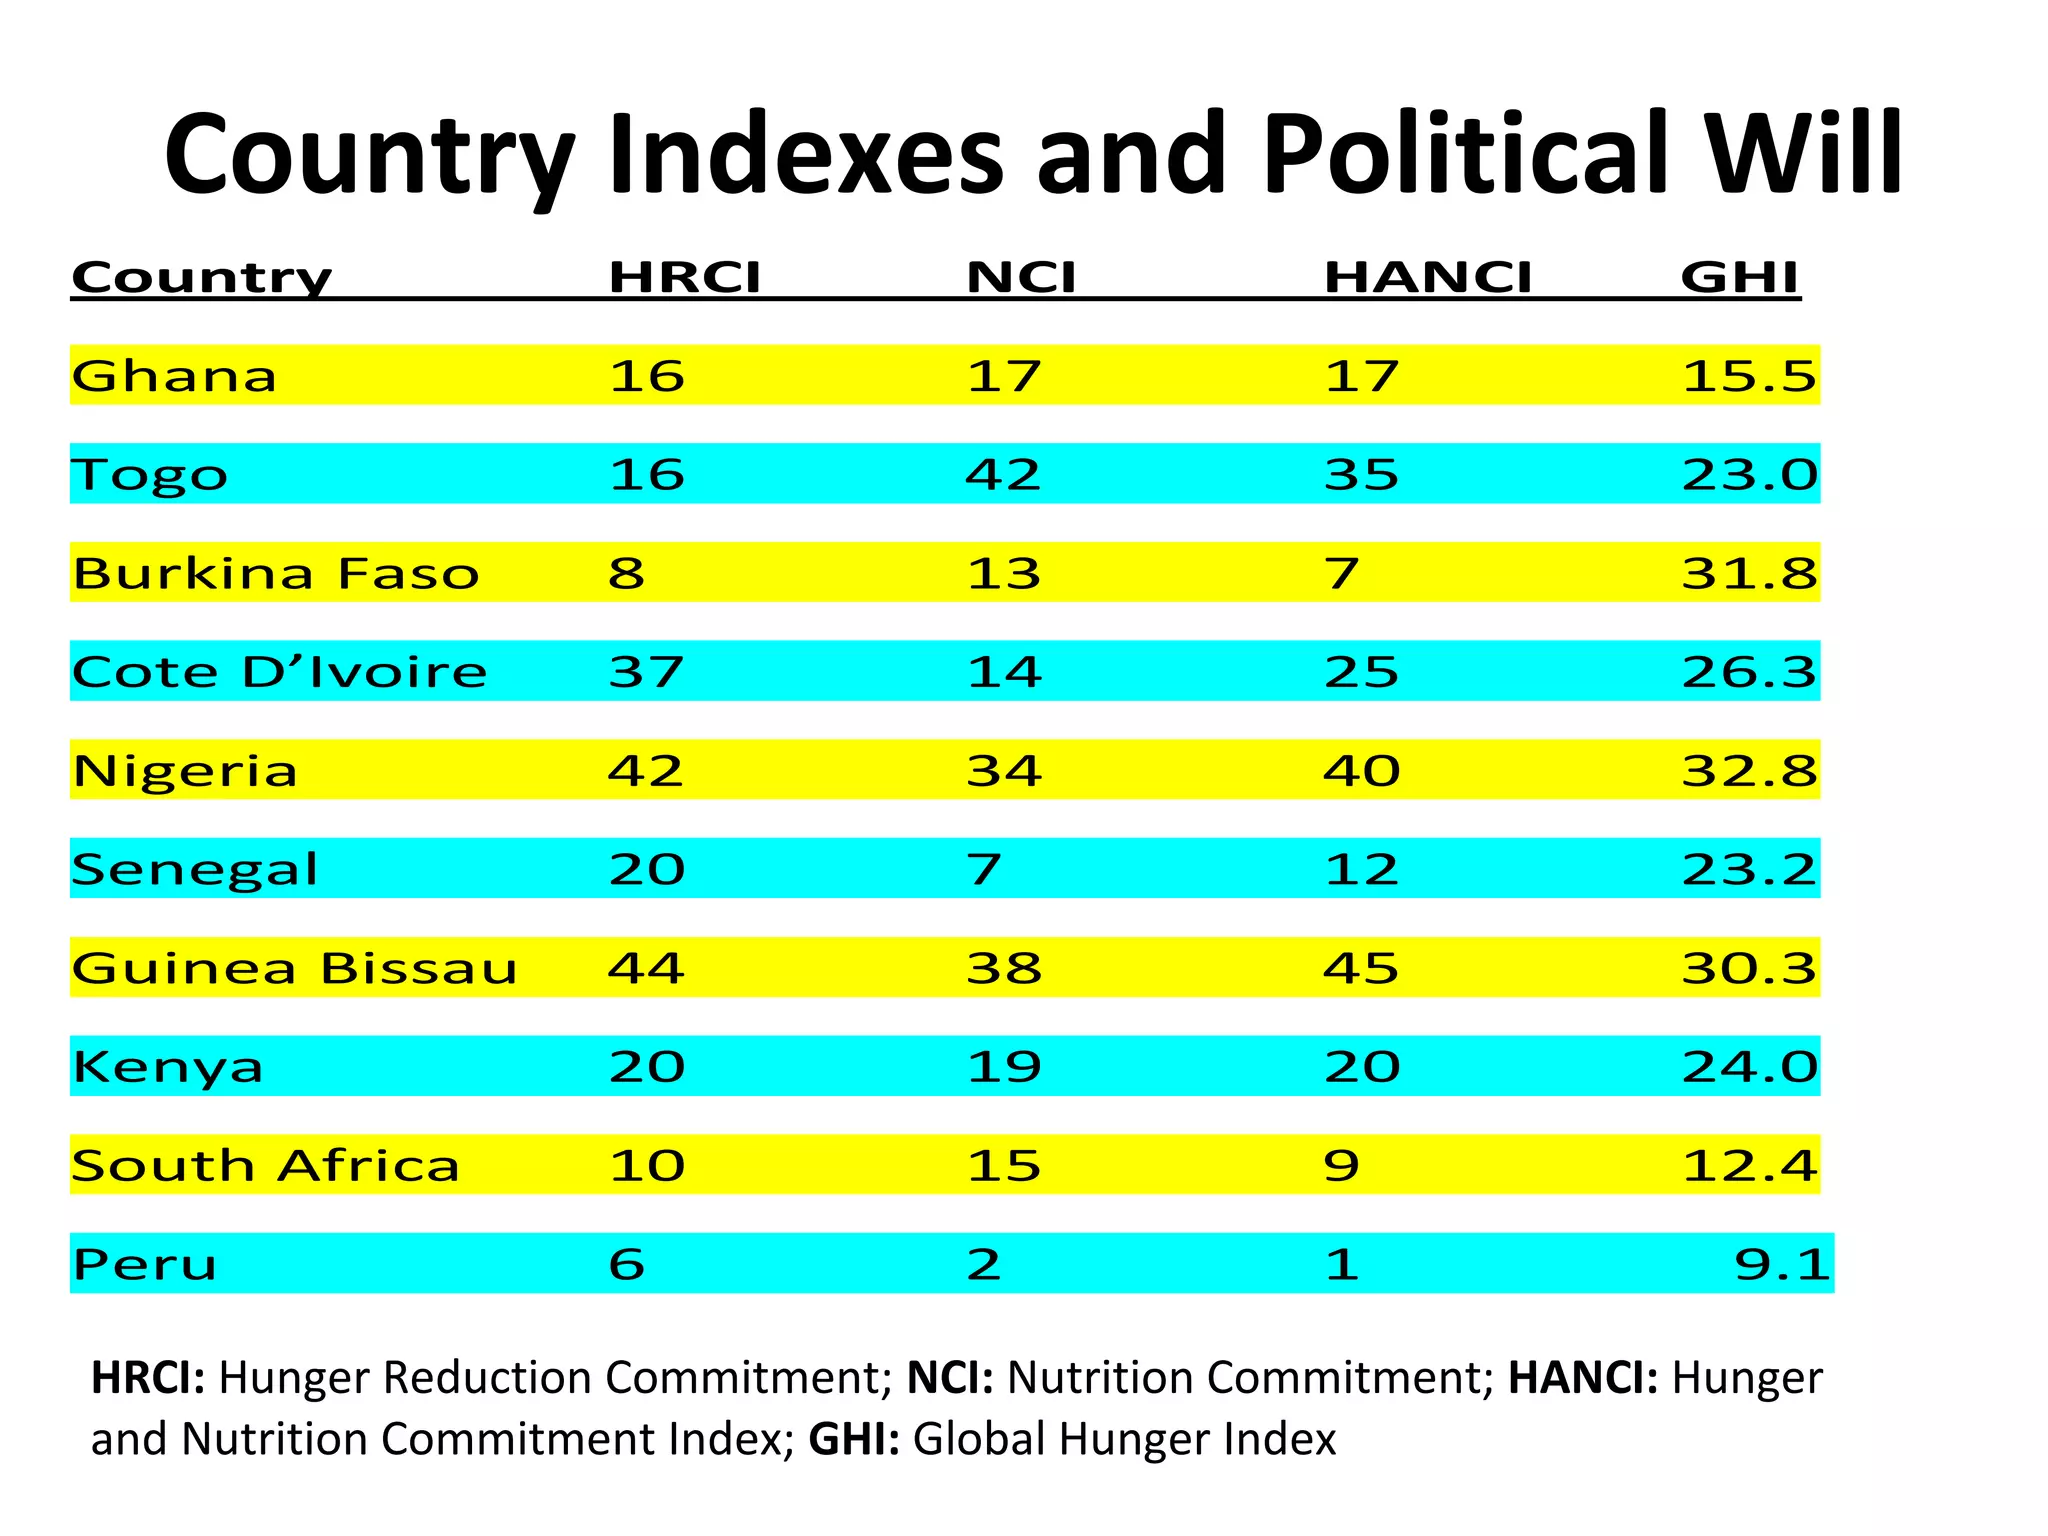


The document discusses Ghana's progress in nutrition and food systems, noting its potential economic productivity losses if the current nutrition status remains unchanged. Despite good relative progress, concerns about anemia rates in women and the diversity of children's diets are highlighted. Ghana ranks favorably compared to its neighbors in commitment to reducing hunger and improving nutrition, but challenges remain, particularly in dietary diversity.


![(_nut)LECTURE_SAM[2].pptx](https://cdn.slidesharecdn.com/ss_thumbnails/nutlecturesam2-230922203647-8a3d0335-thumbnail.jpg?width=640&height=640&fit=bounds)


