Download as PDF, PPTX


![Stakeholder perspectives
‘’I think another thing that perhaps for advocacy purposes-wise,
this whole idea Ghana did the profile sometime back which tried
to translate the cost of low action into monitoring terms and this
was used for advocacy. I remember some of these events
supported this whole idea of priority setting” [UN agency]
Role of economic analysis in stunting Advocacy
“In terms of 0 to 10, I will say stunting is rated very high
nationally and I will give 8 but anemia there hasn’t been a lot of
priority given to child anemia. But for anemia in pregnancy it has
high priority and you can see that there is more on prevention of
anemia in pregnancy. But with childhood anemia we haven’t
placed a lot of priority to that’’ [GHS, Regional]
“And we have core indicators that the health sector tracks, and
stunting is one of the indicators that they are tracking’’ [GHS,
National]
Prioritization of stunting
“yes we work with education and recently a program on GIFT thus
Girls Iron FolicTablets implementation closely with Education
sector and also deworming exercise were done in the schools and
we worked with the teachers’’ [GHS, Regional]
Role of Nutrition-specific interventions
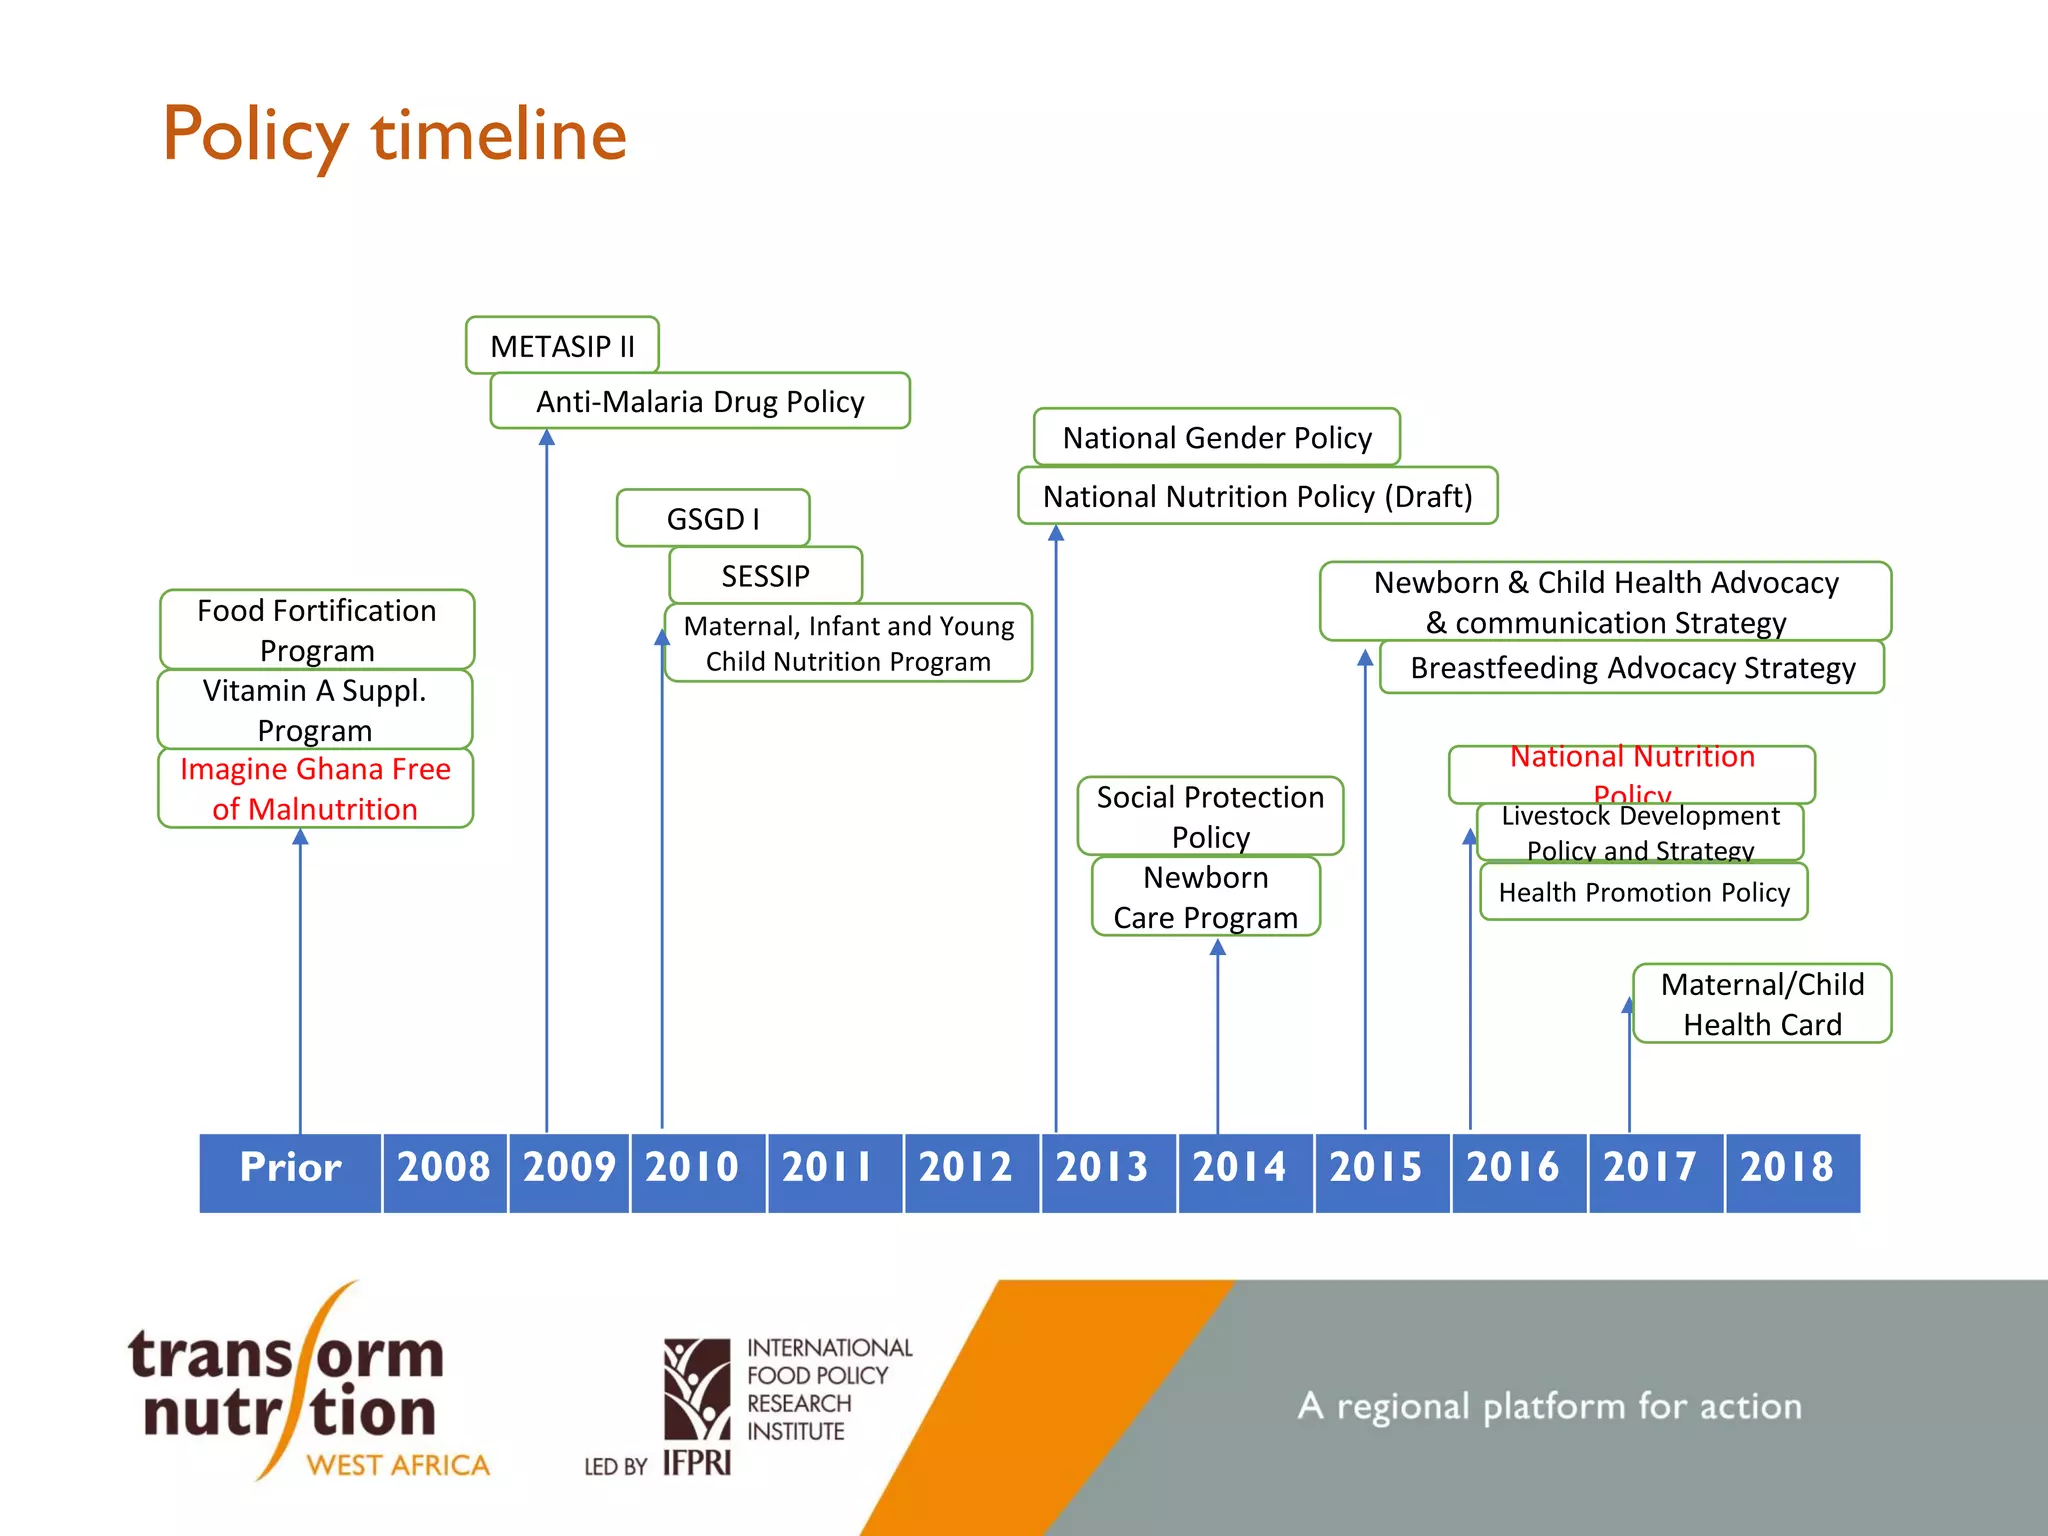
‘’One other key activity or event that I think would
have also affected things in Ghana has to do with the
writing of the first ever national nutrition policy which
also took place during these period’’ [University
researcher]
Policy focus on stunting
‘’The first lady who has been active…the queen
mother of Mankessim and when we were developing
our strategic document for breastfeeding and we
thought of engaging traditional leaders, she was one
whom we called on. [GHS, National]
Role of Champions
‘’And DFID in the last four years also match the
money that we took the loan and they provided the
equipment, weighing scales, infantometers and they
also gave money to develop guidelines and other tools
and actually paid for training of health providers in a
number of regions And that has improved the
nutrition logistics and equipment. But also building
staff competencies’’ [GHS, National]
Enhanced capacity](https://image.slidesharecdn.com/finalslidedecksocghana29apr2020-200806181805/75/Stories-of-Change-Ghana-31-2048.jpg)


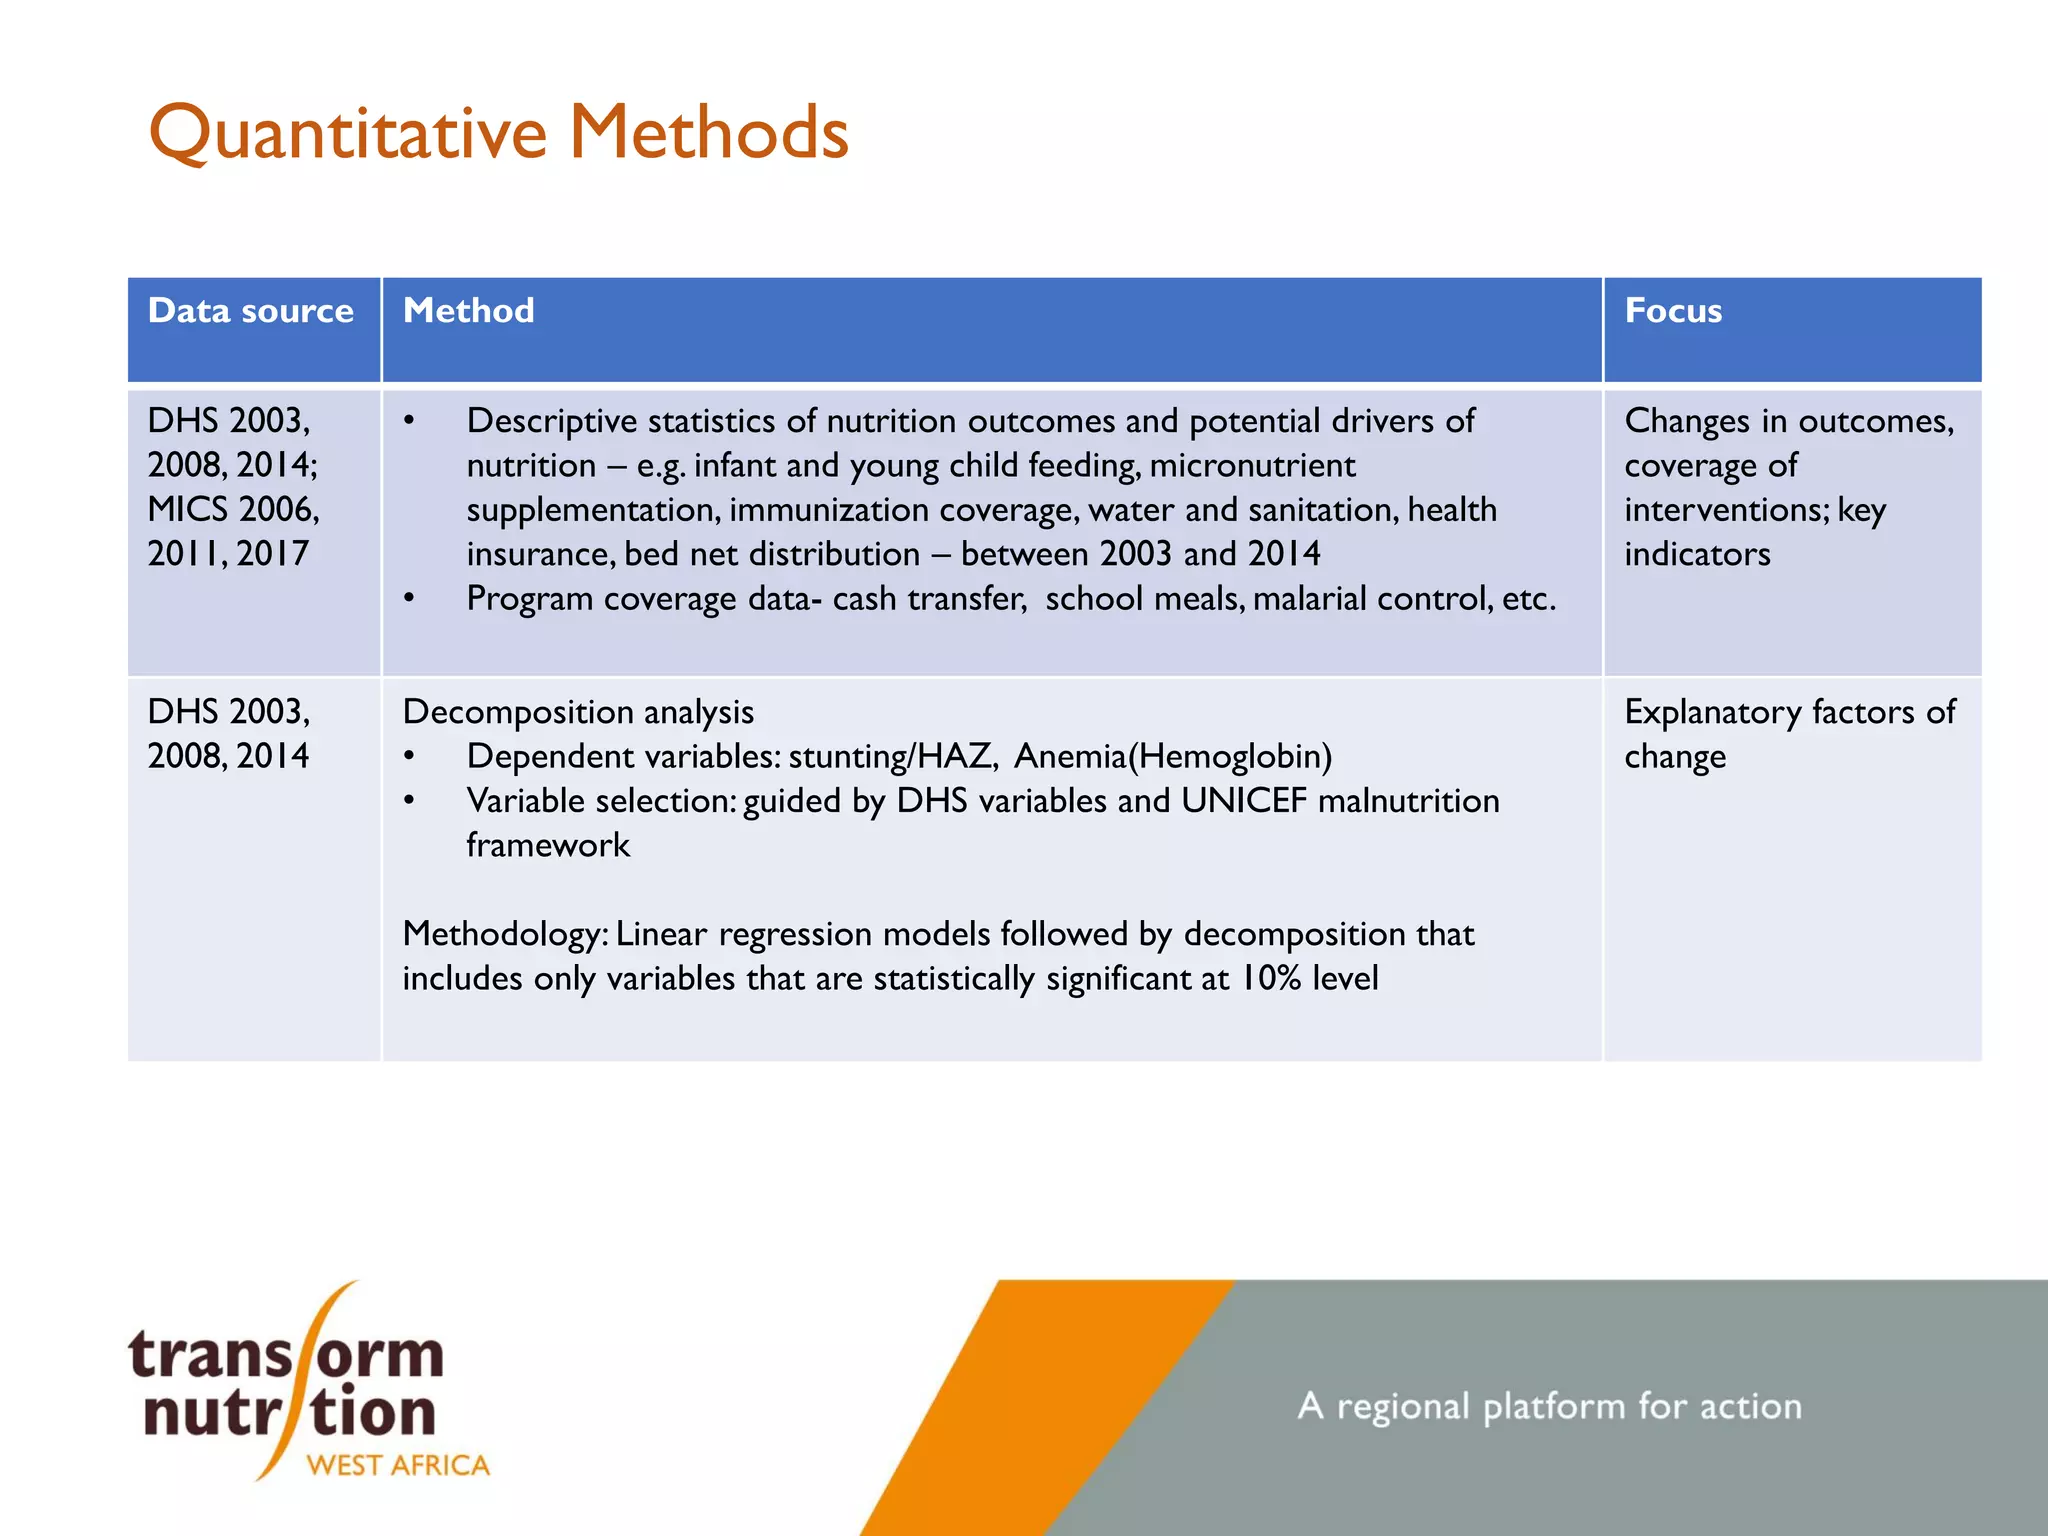
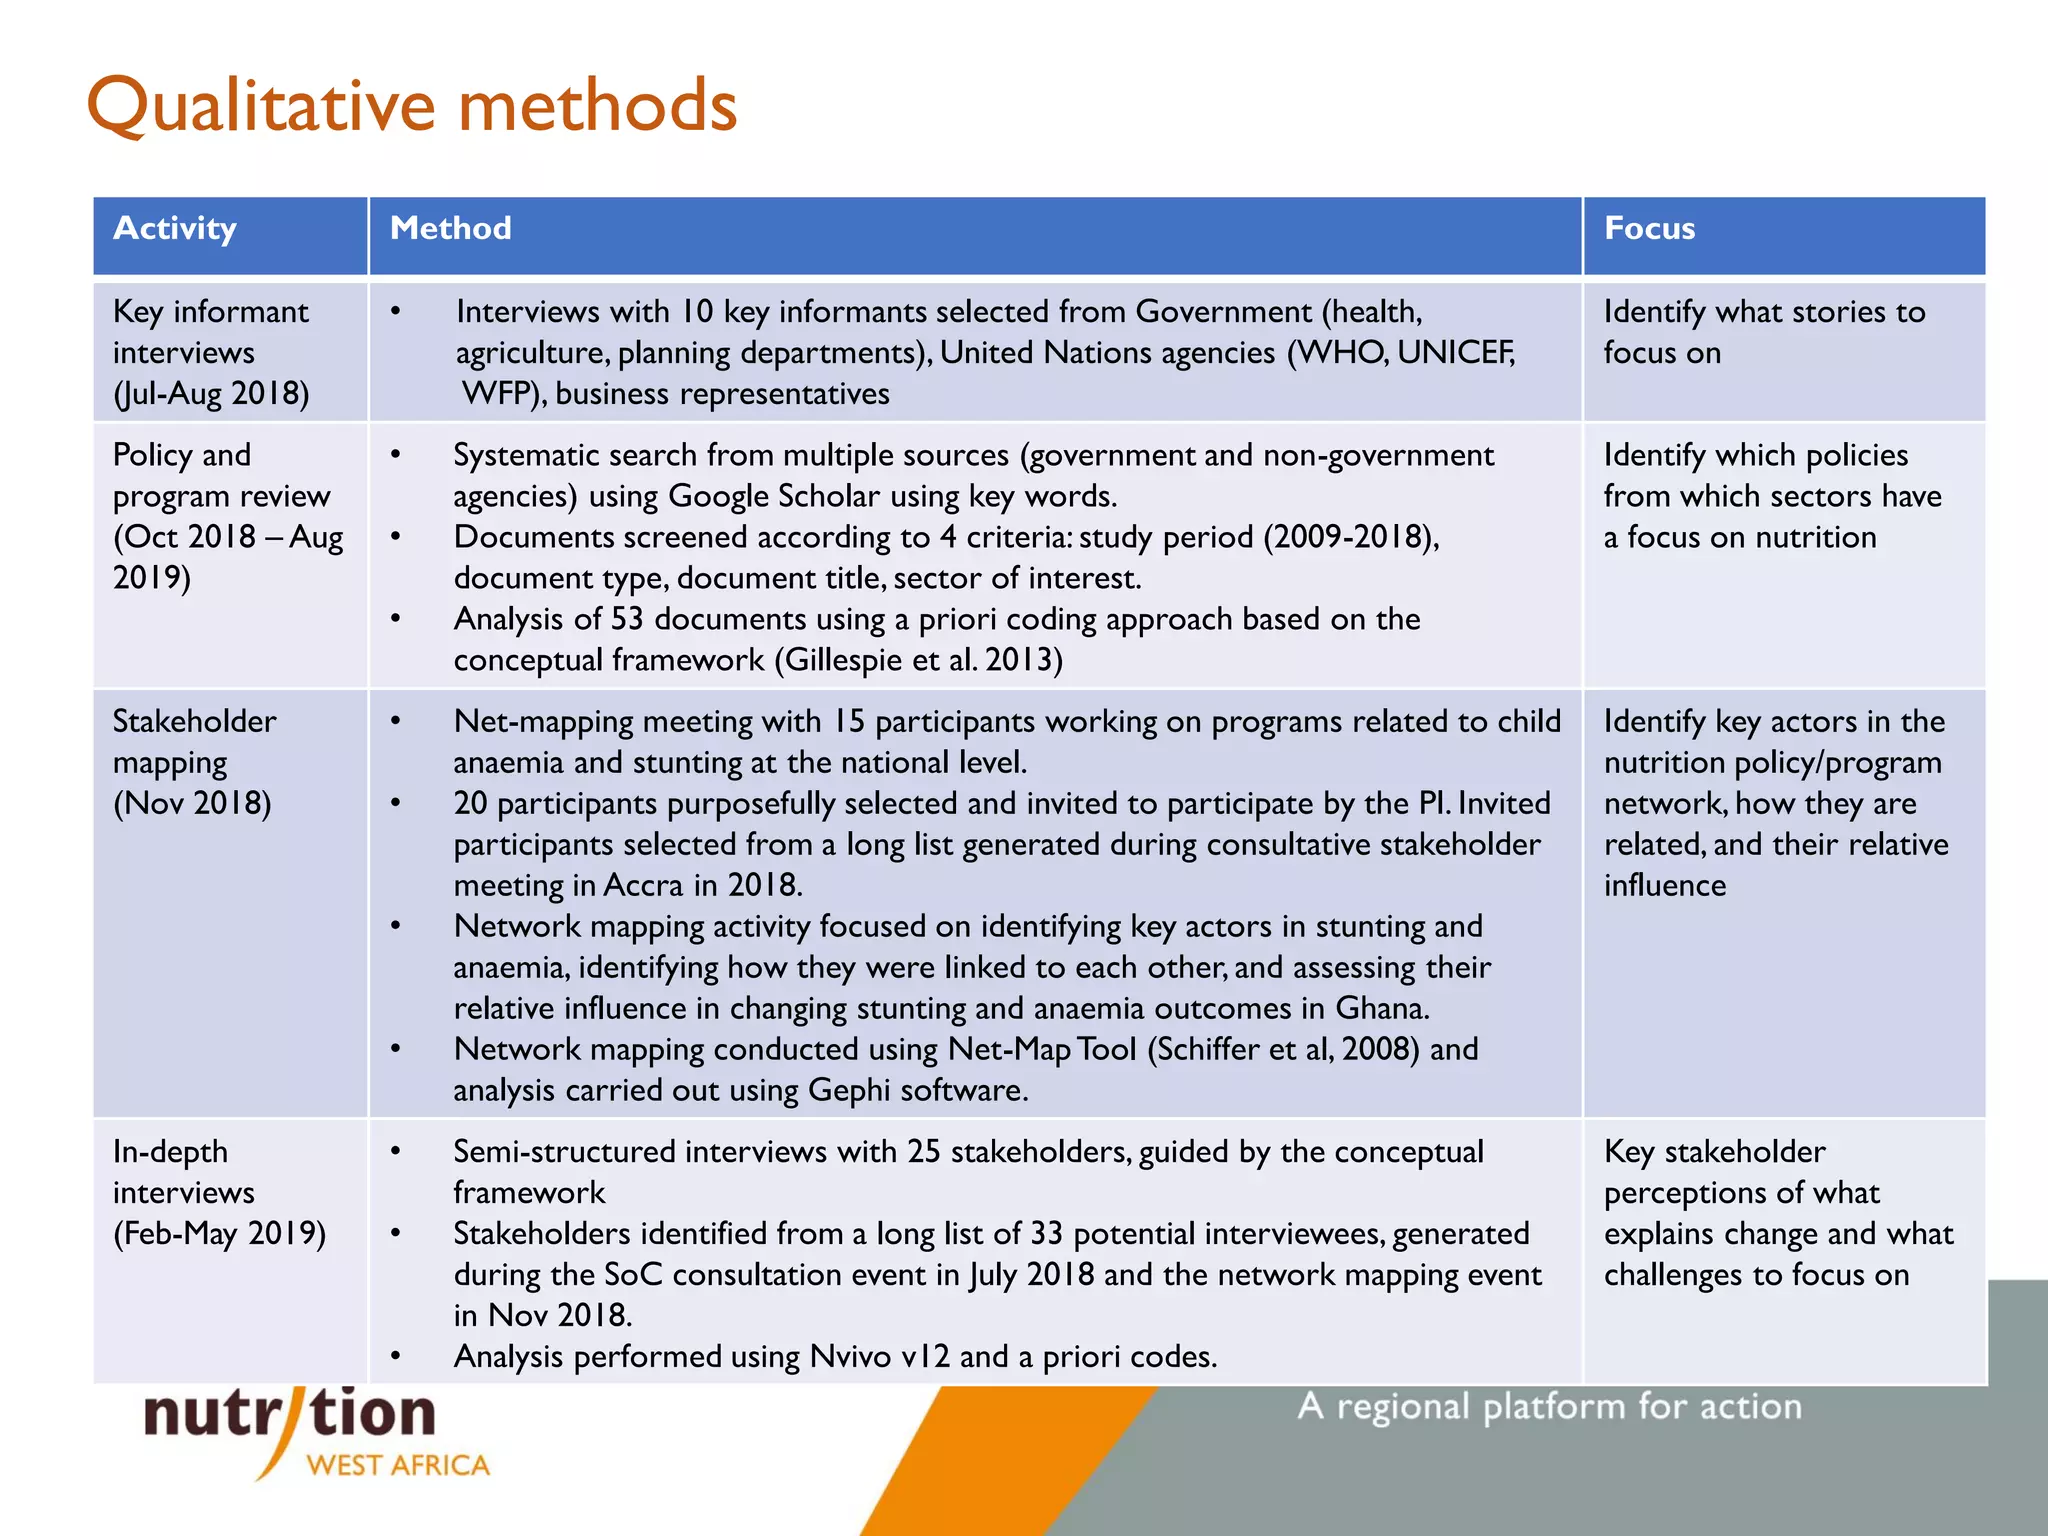
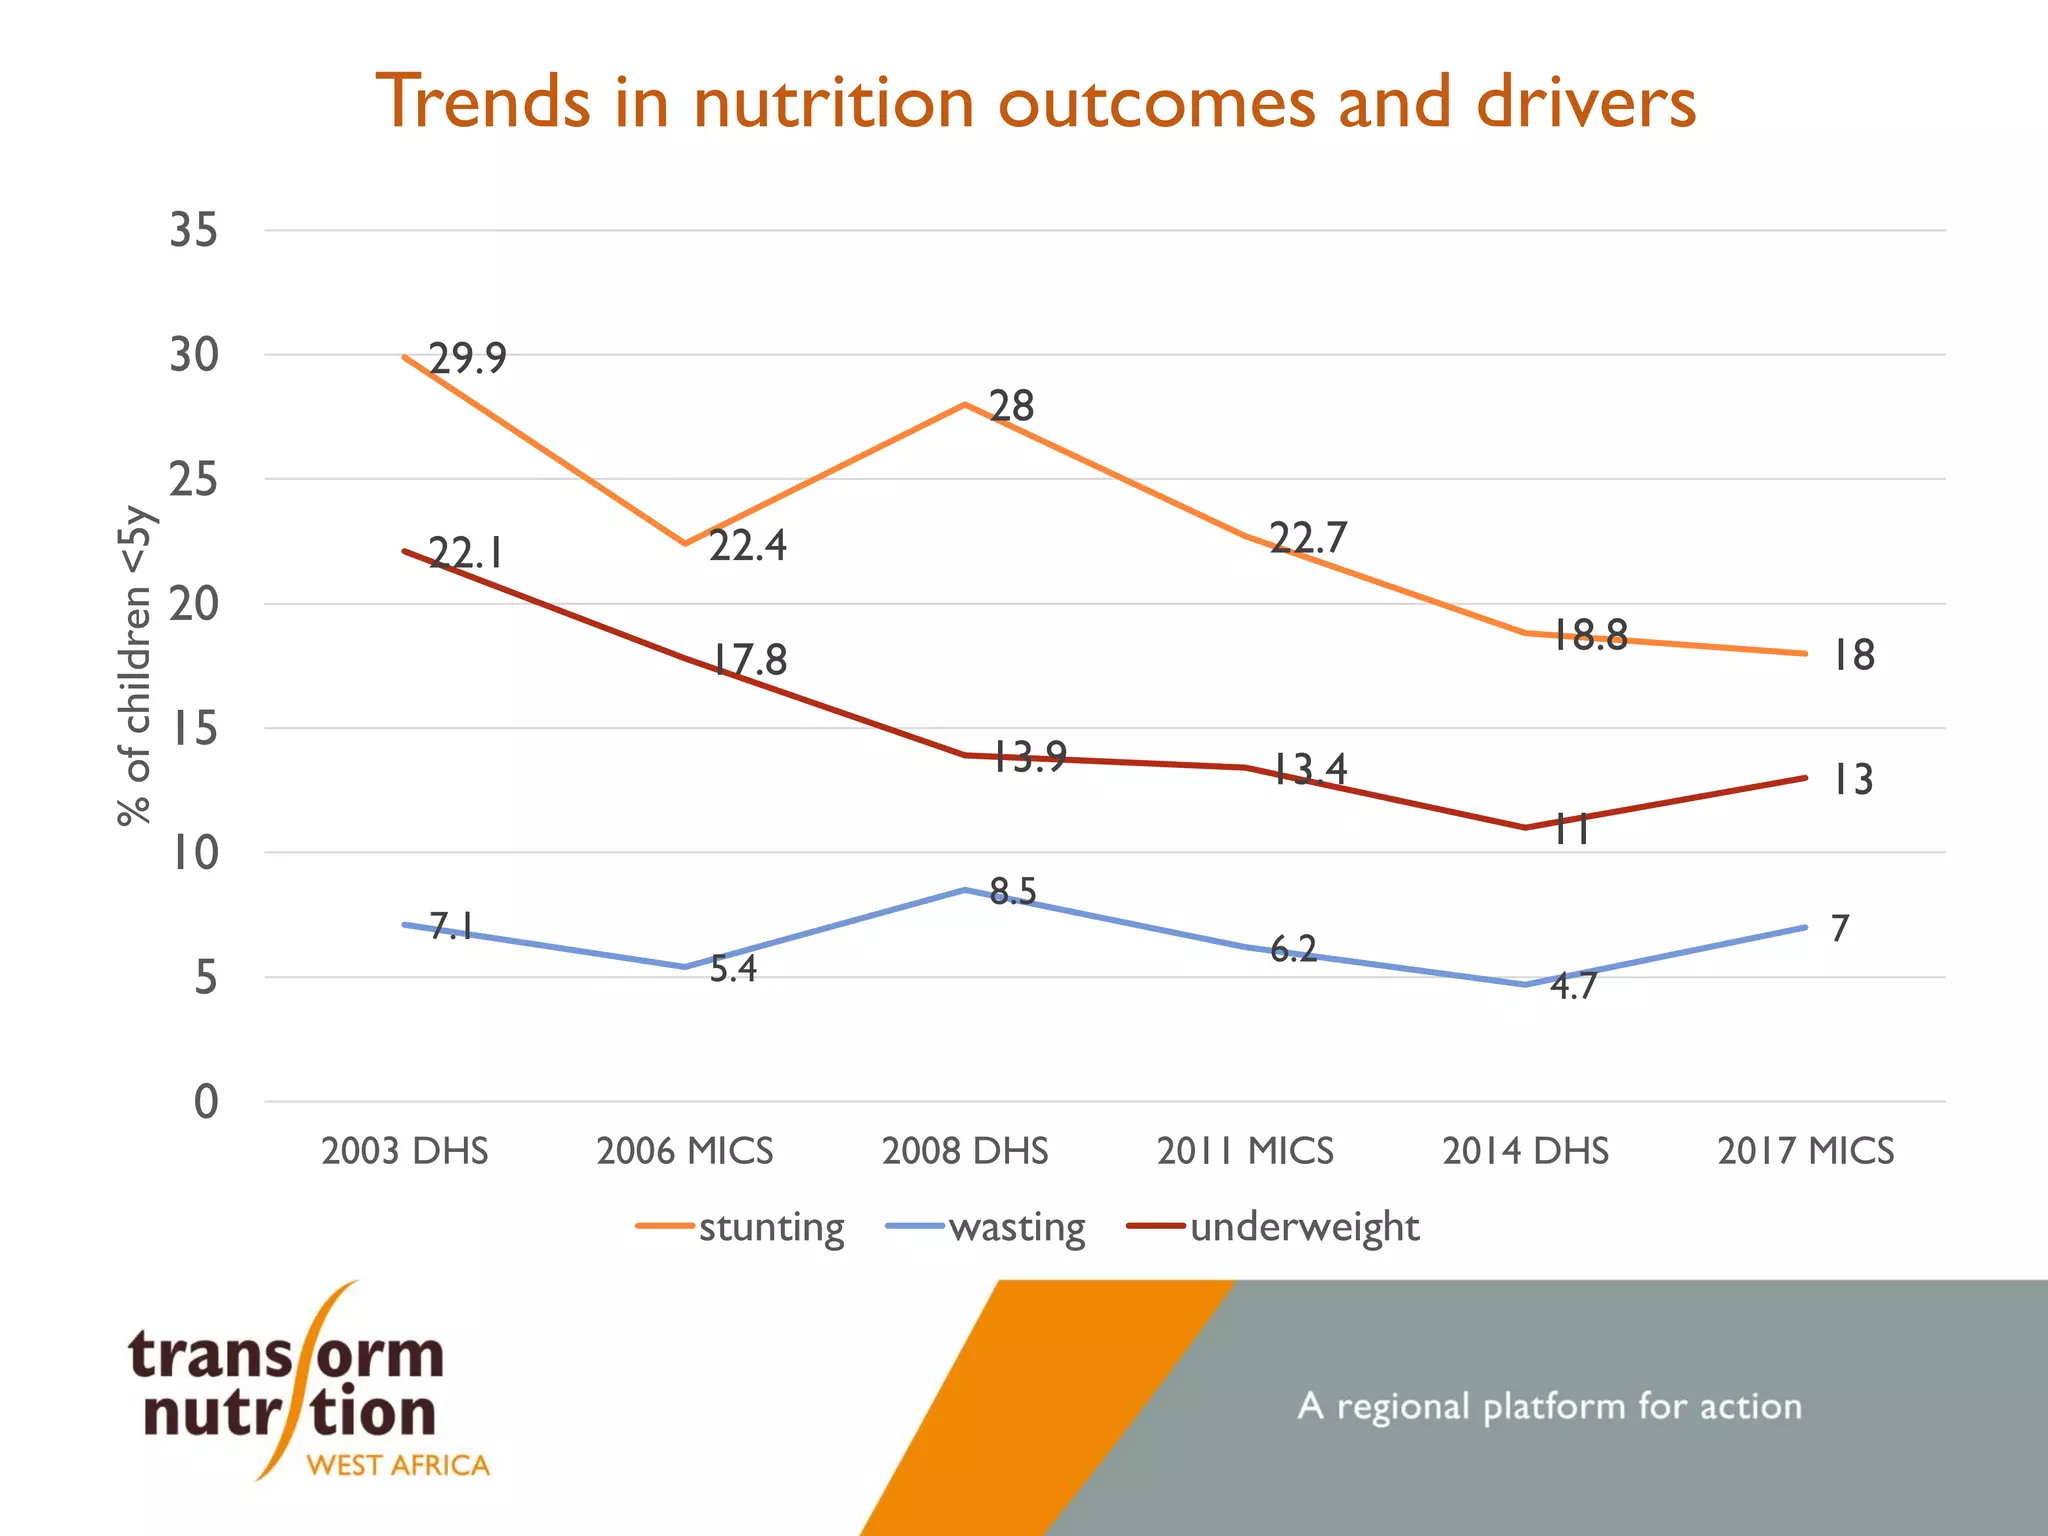
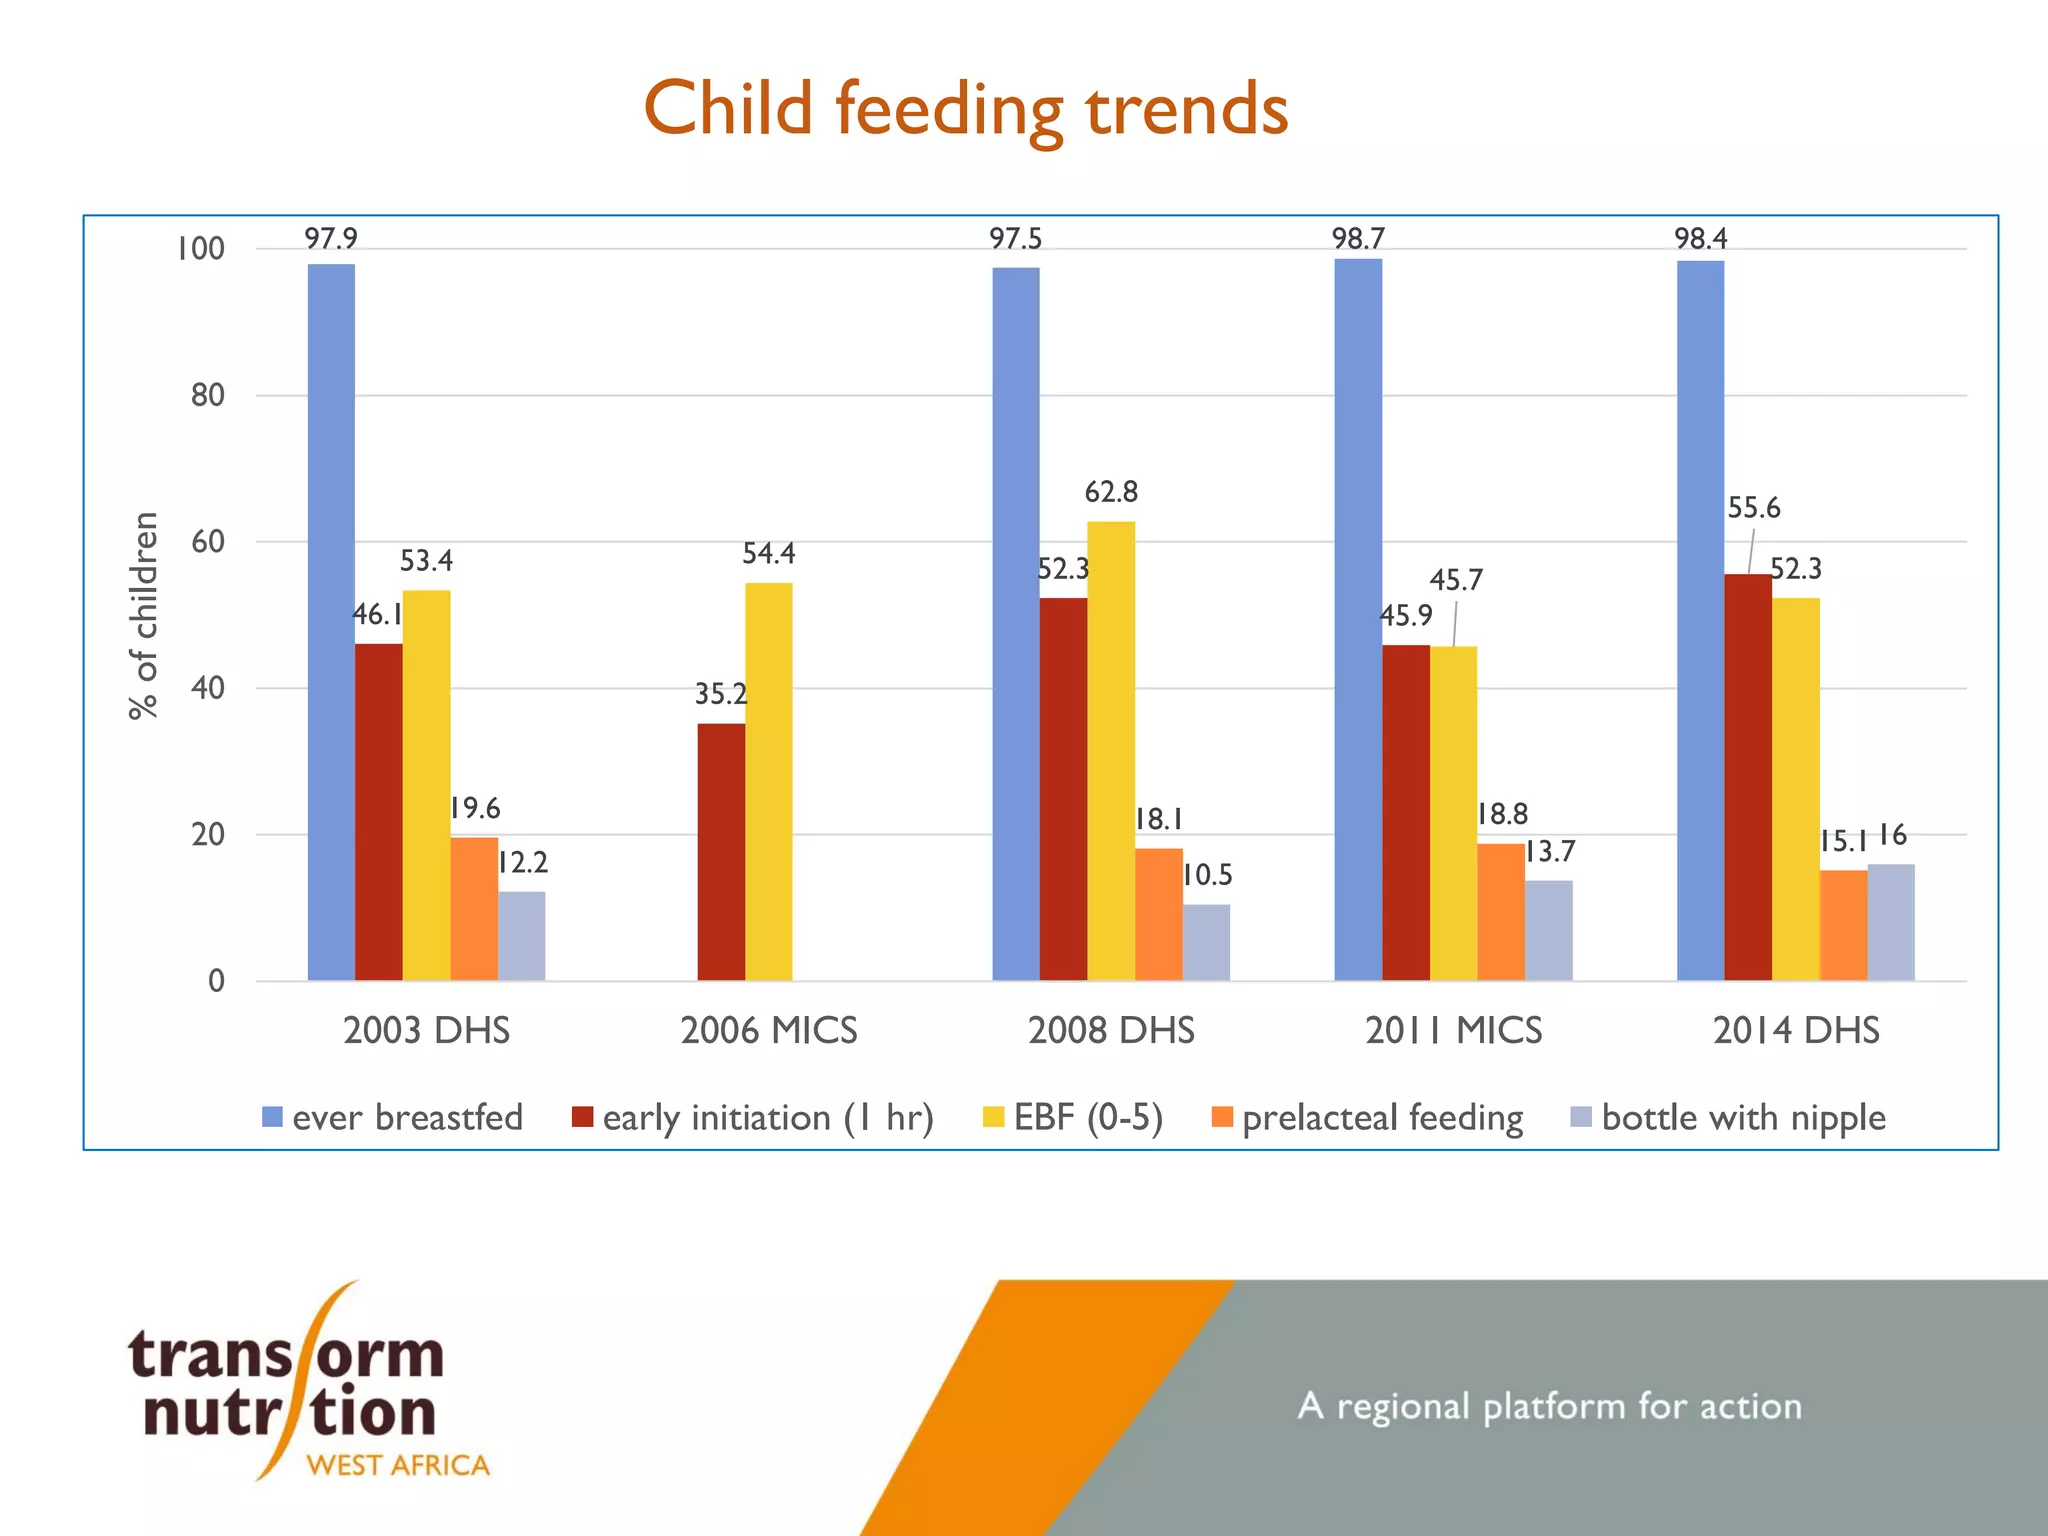
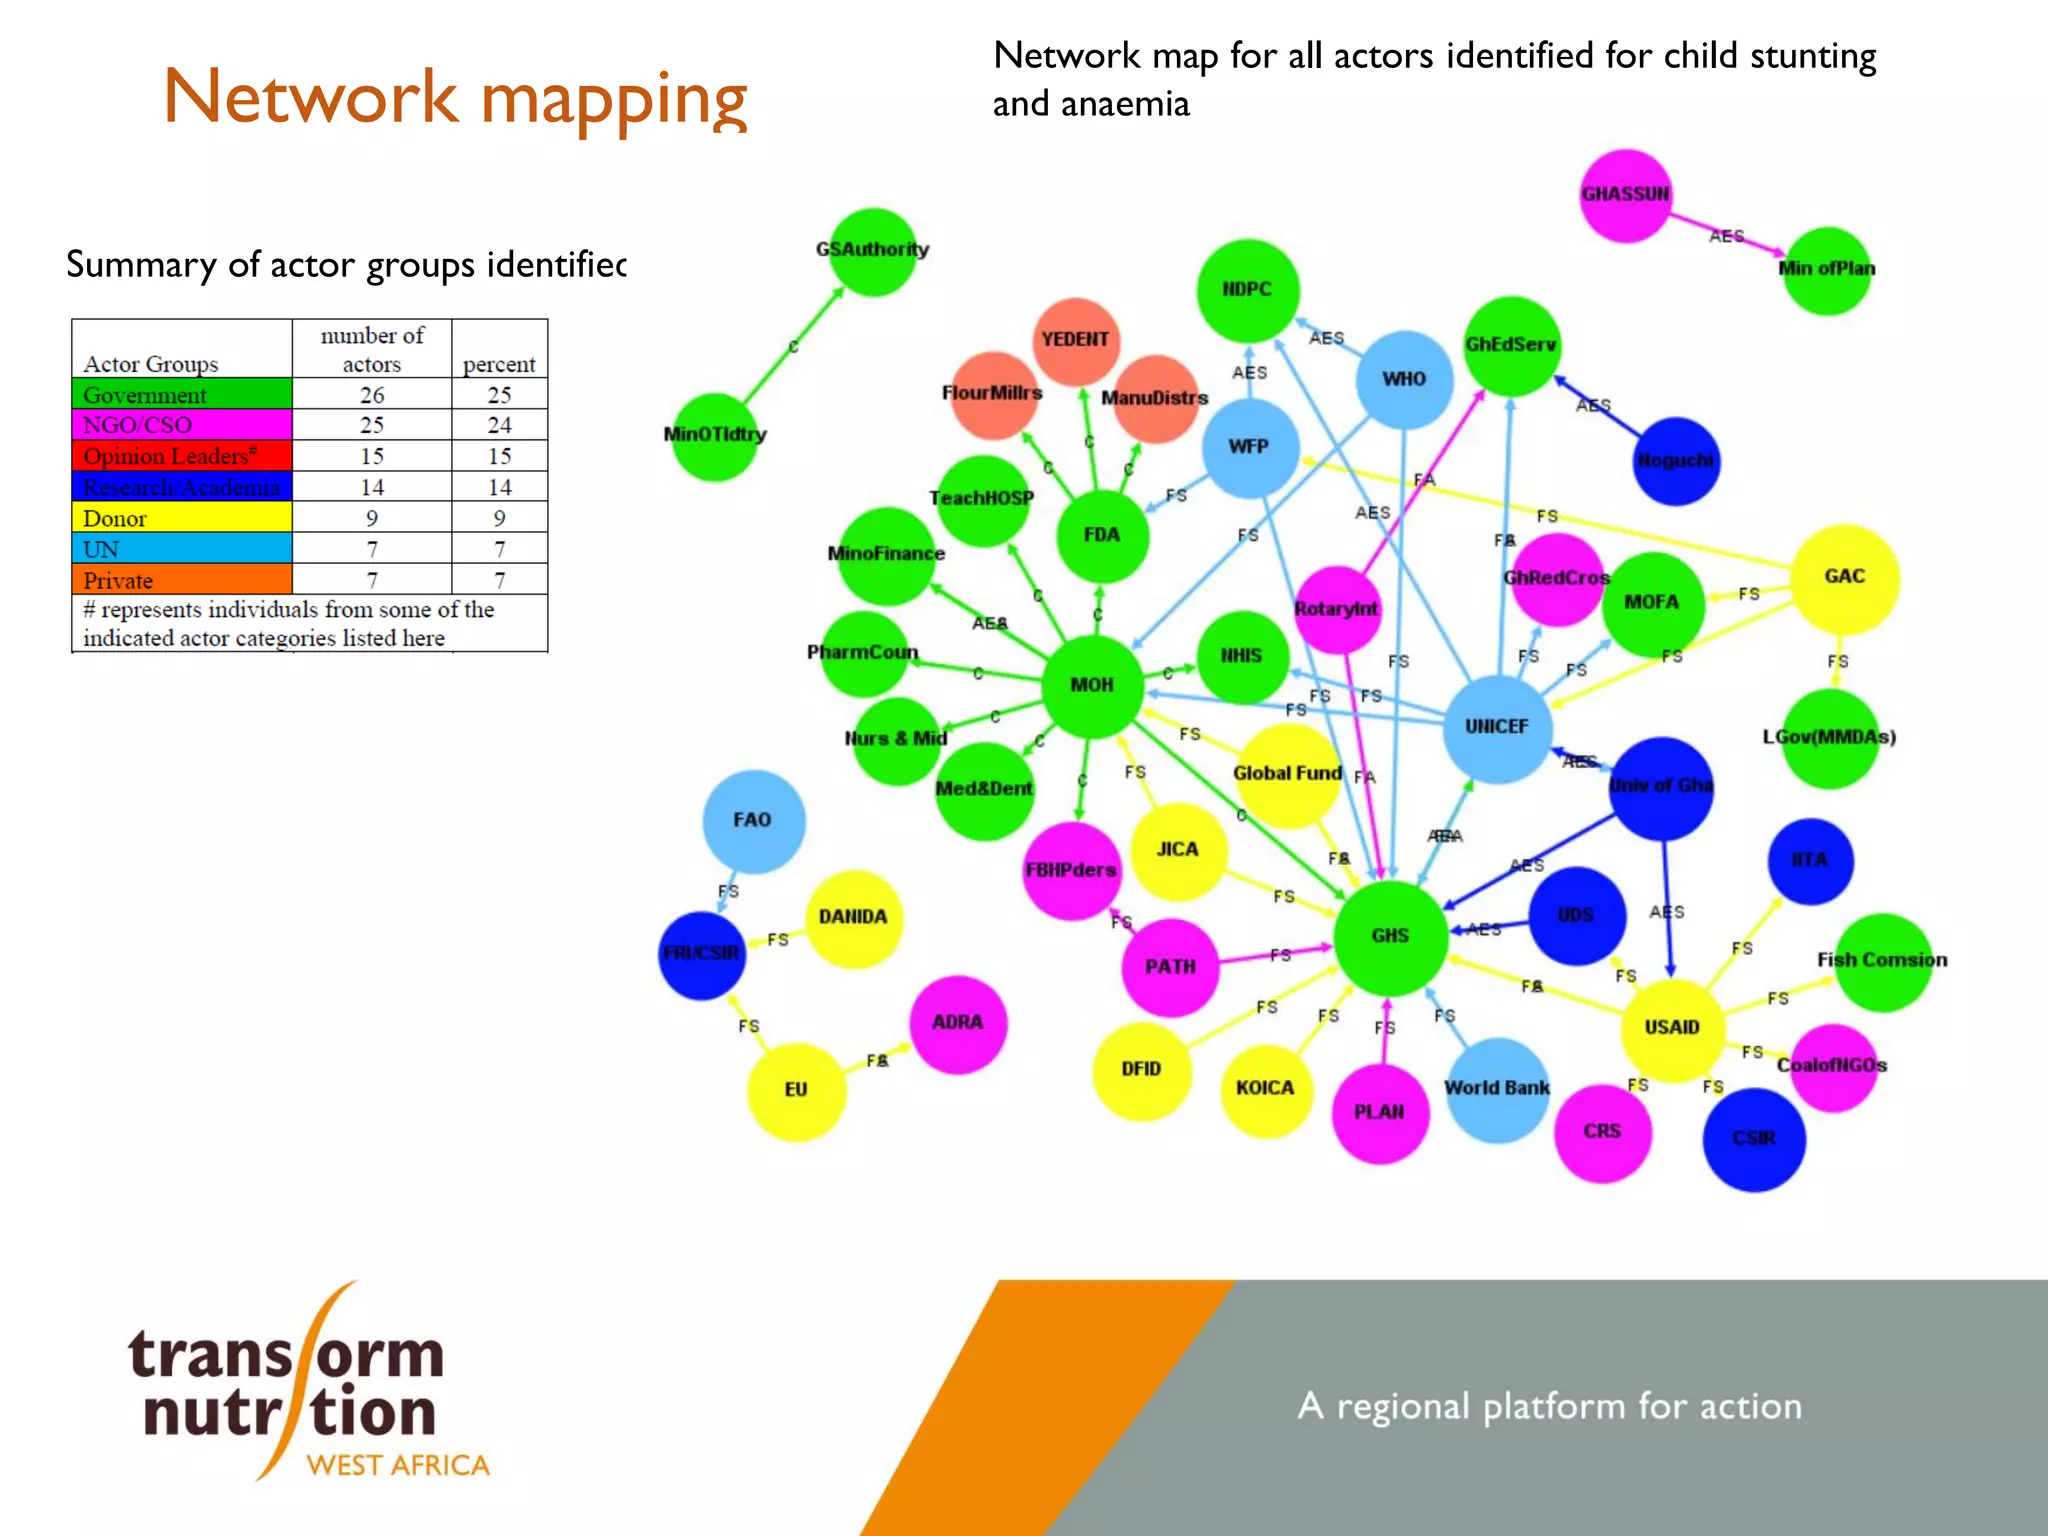
The document examines changes in nutrition outcomes and policies in Ghana between 2008 and 2020, focusing on child stunting and anaemia, and aims to capture experiential learning for effective policy planning. It highlights a marked reduction in stunting from 28% to 18%, while improvements in addressing anaemia were less significant. The findings emphasize the need for operationalizing effective interventions across various sectors to sustain these gains and combat malnutrition.


