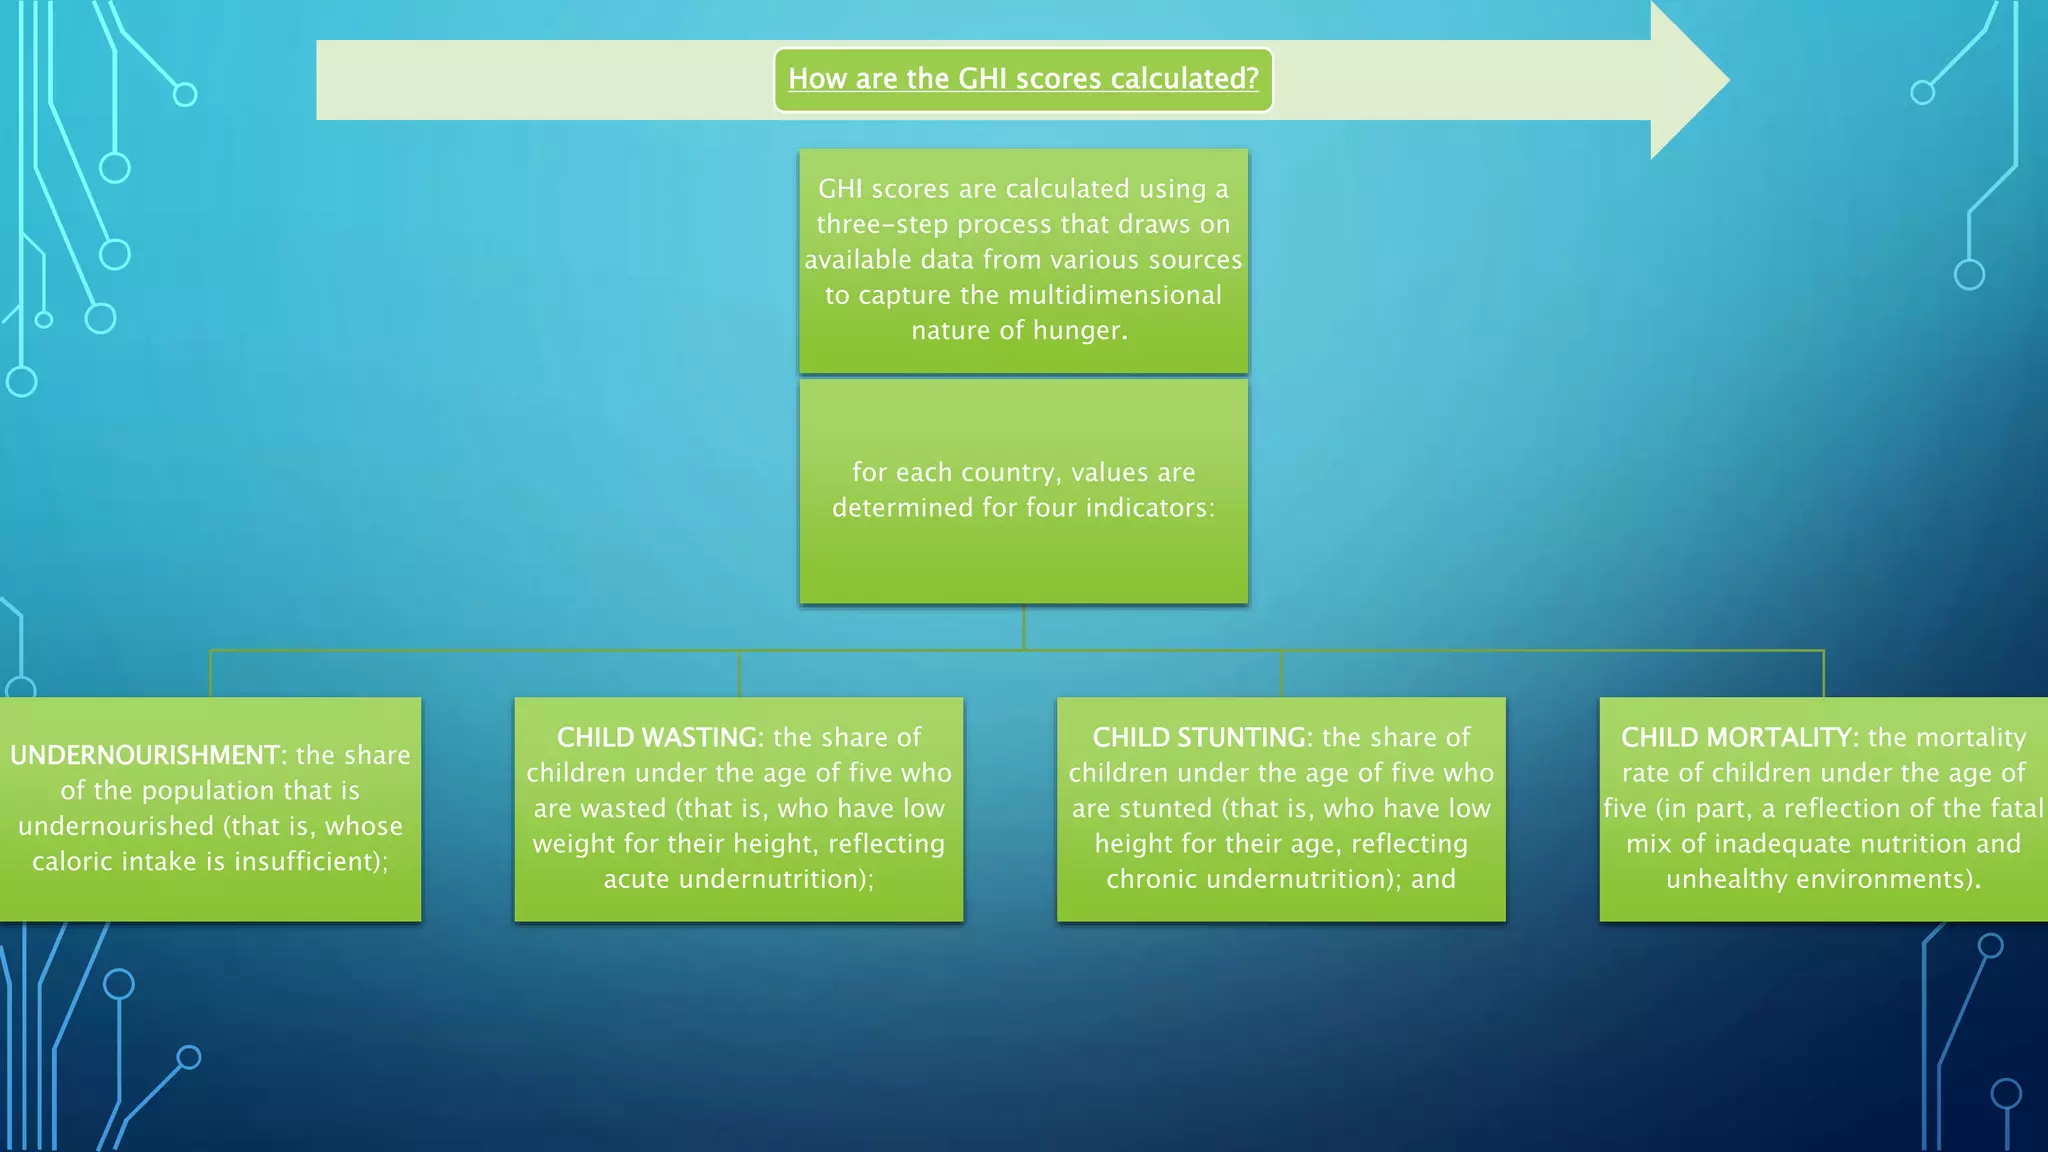
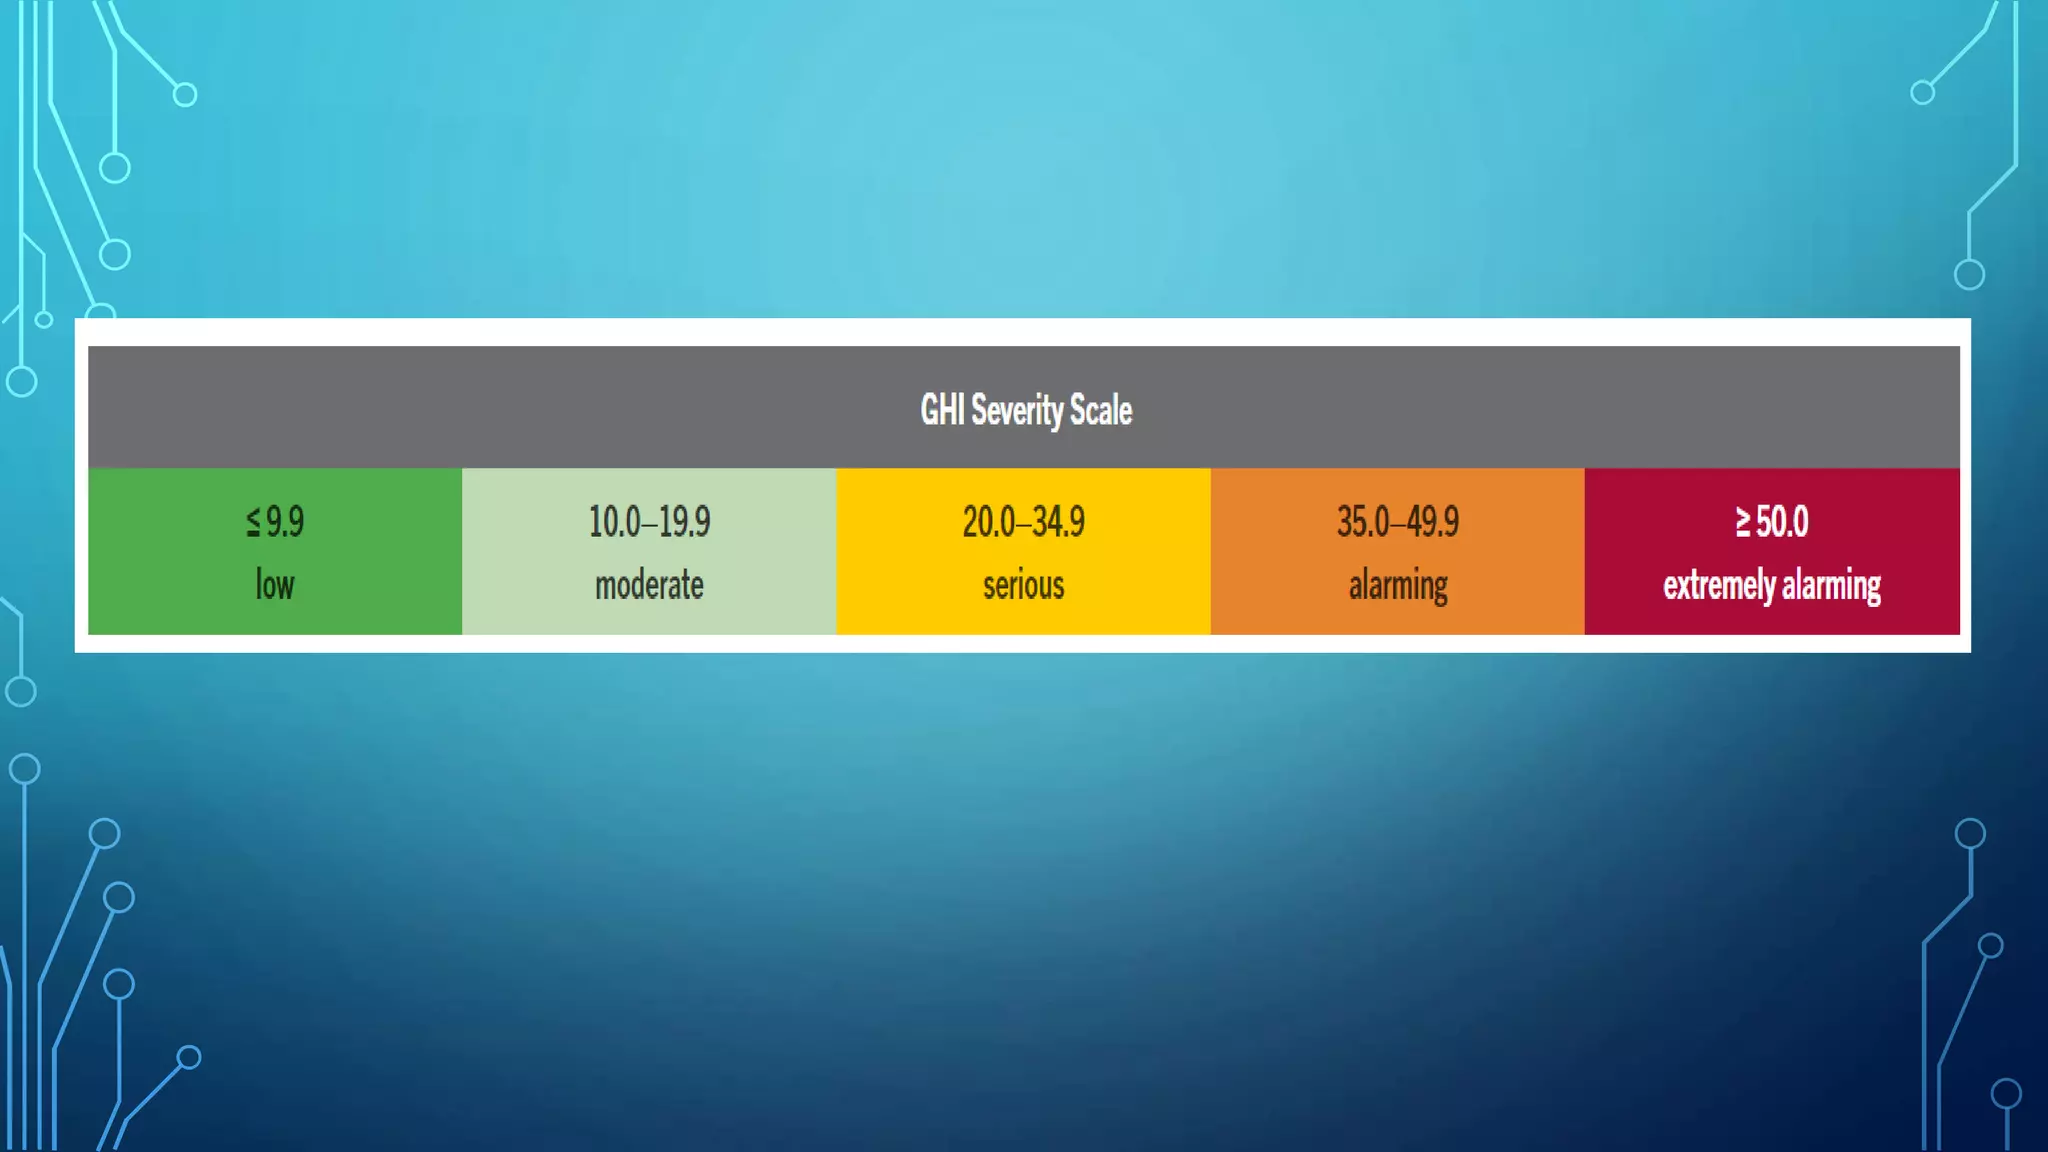
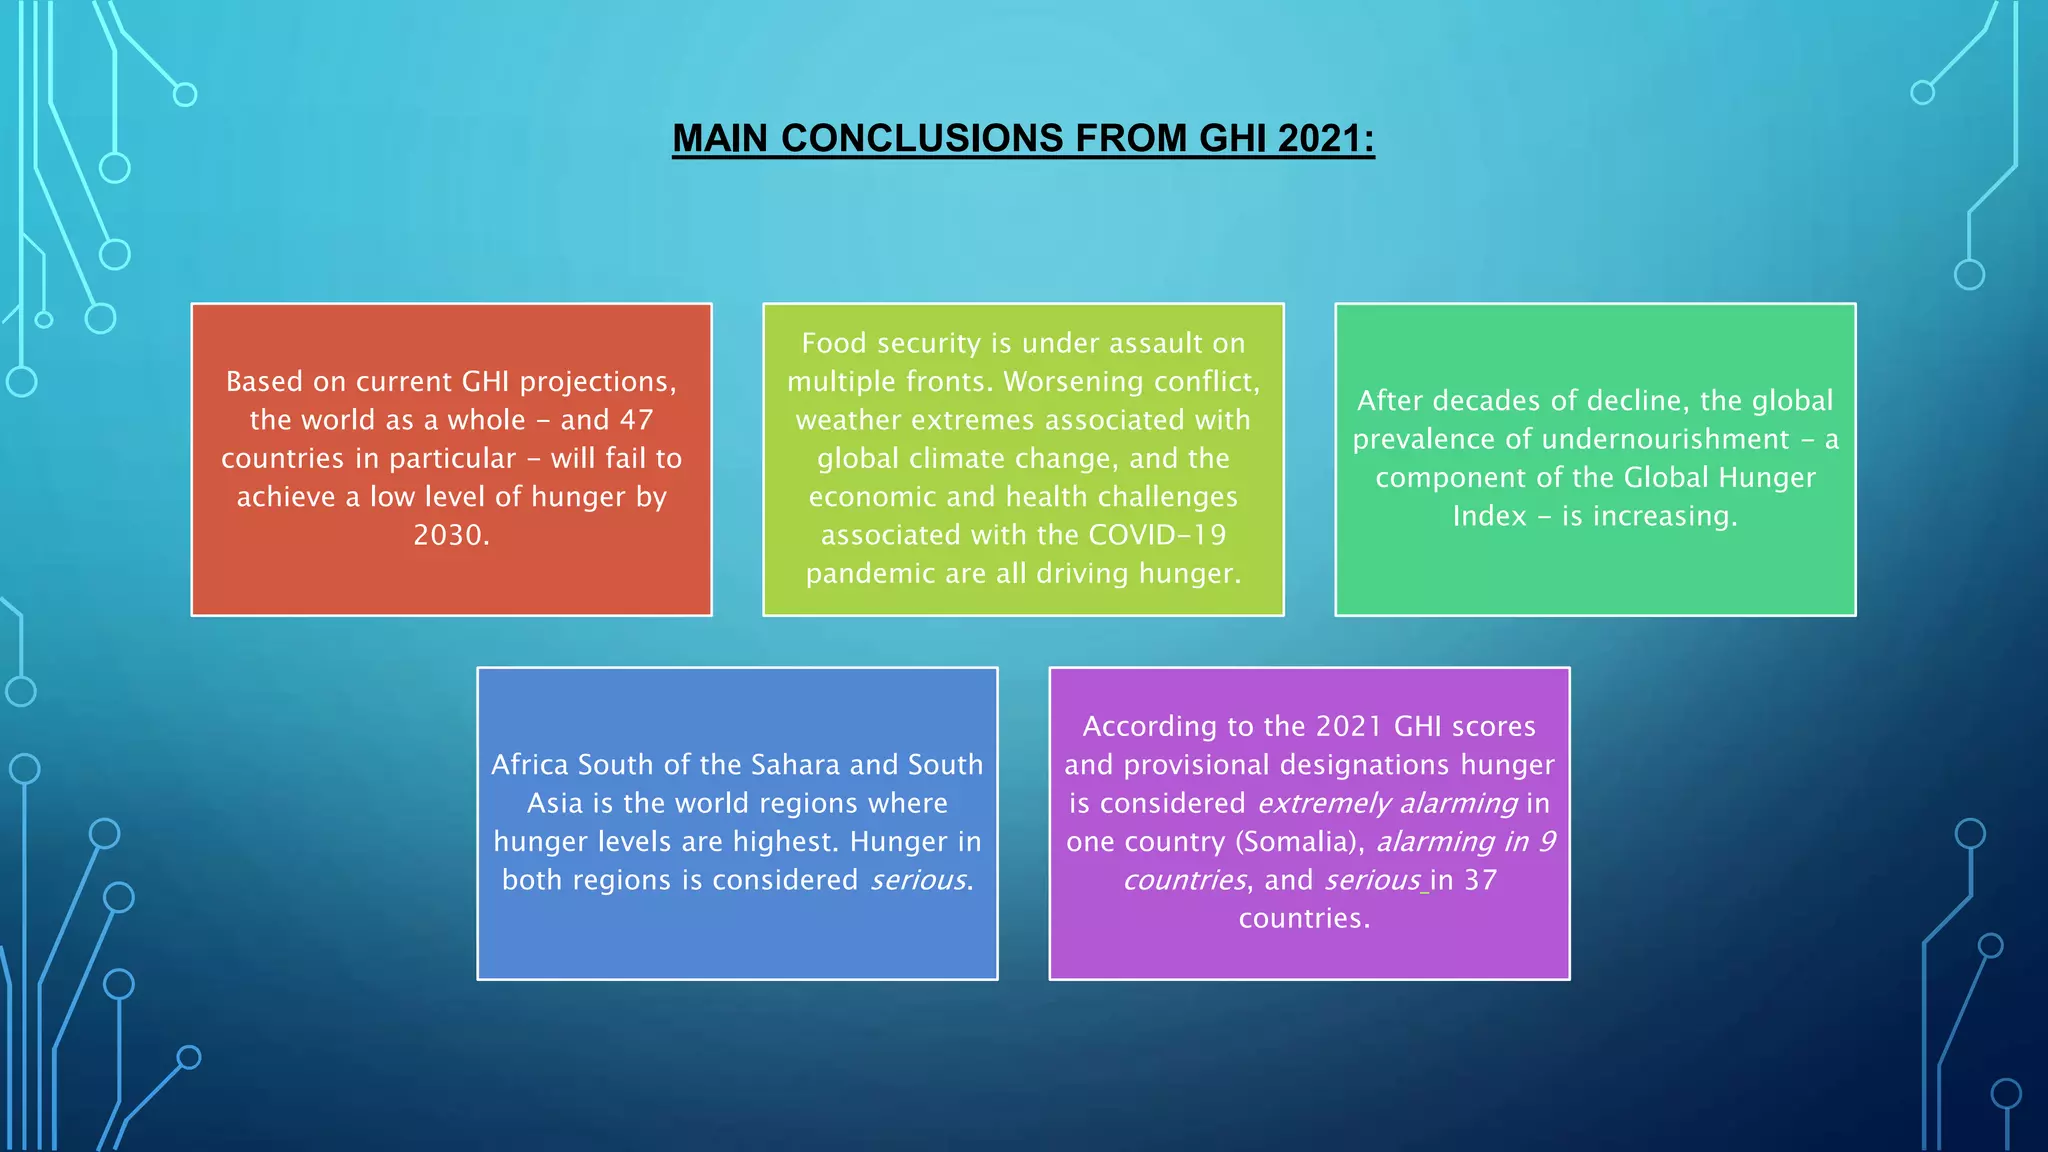
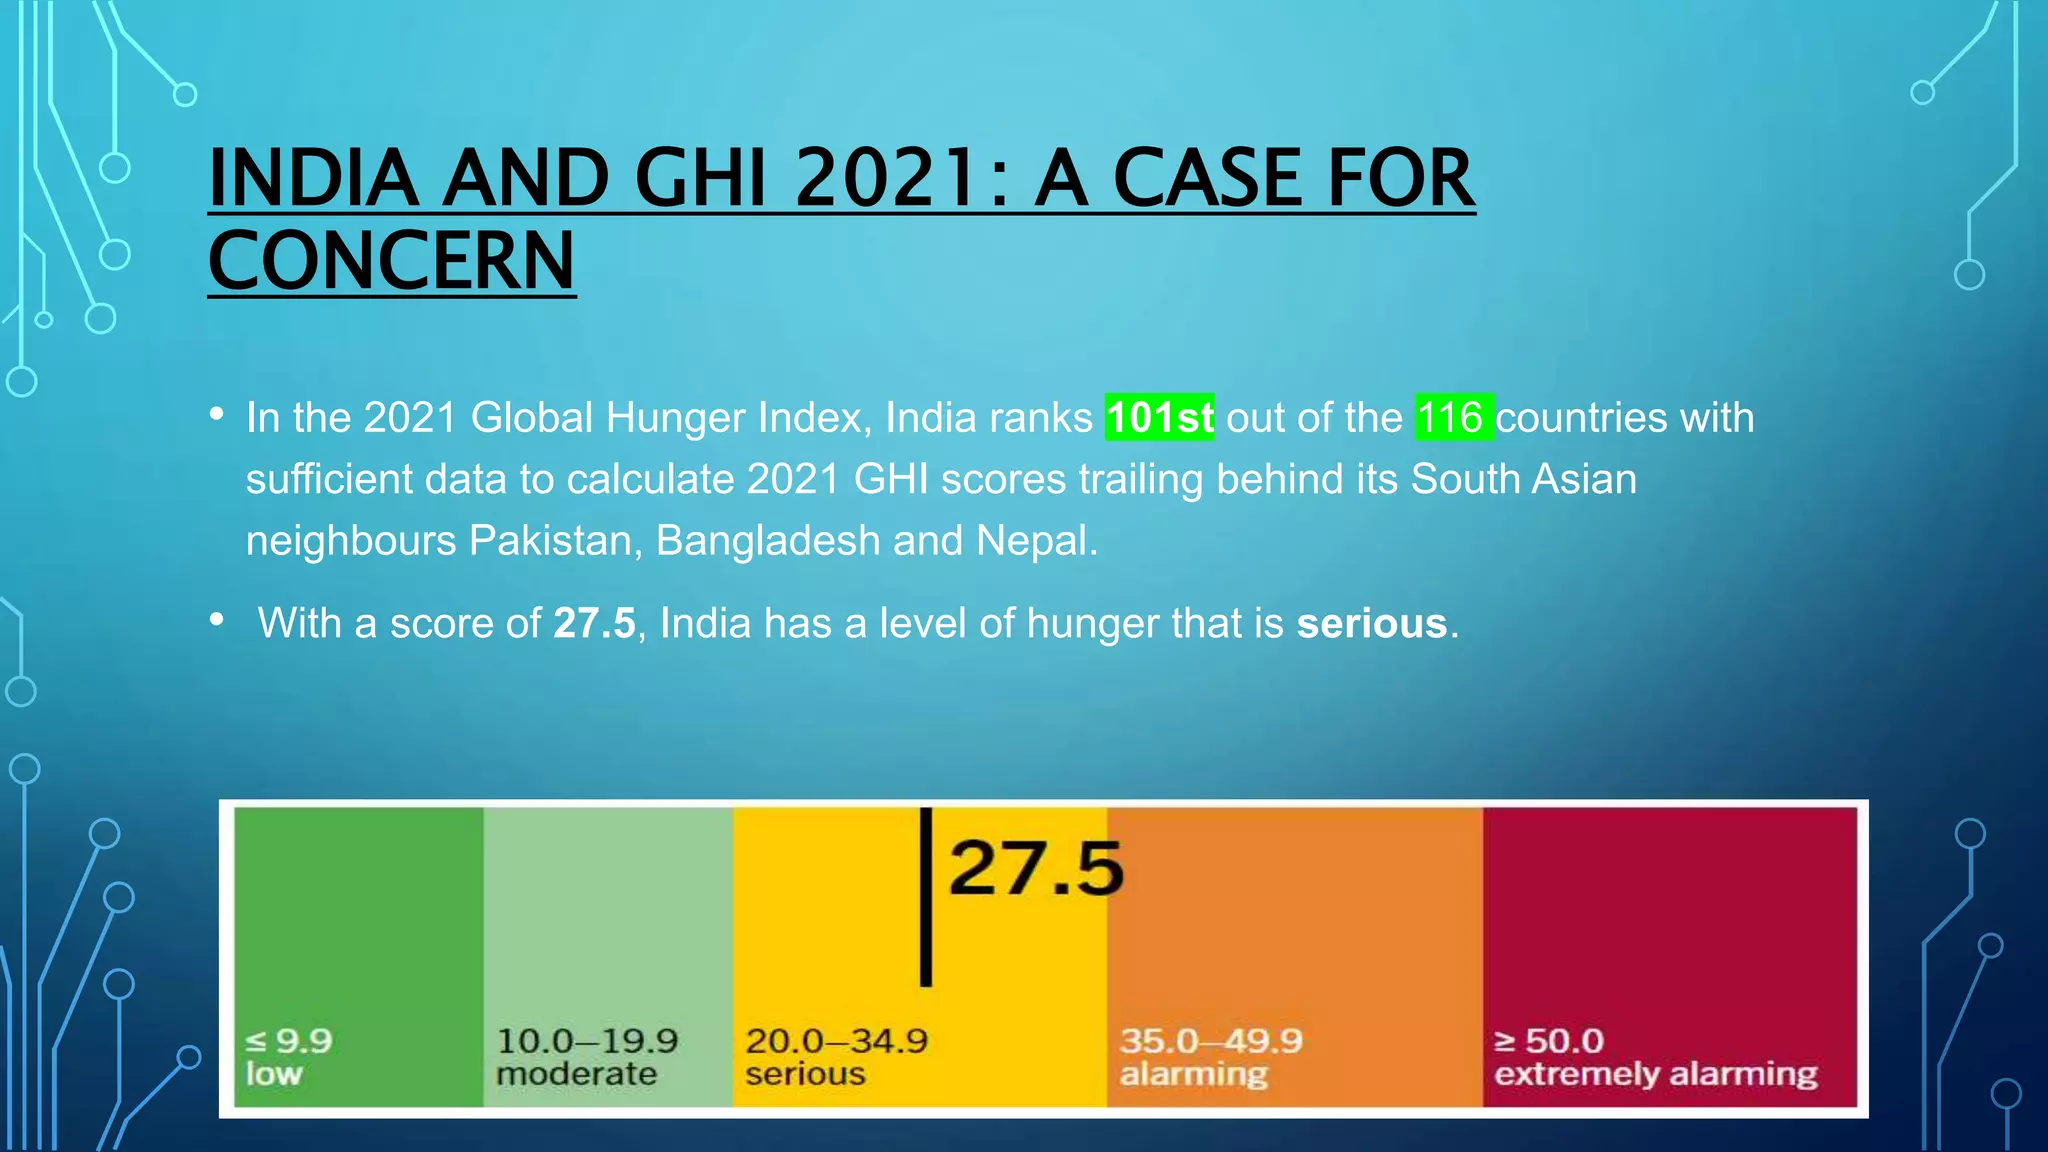
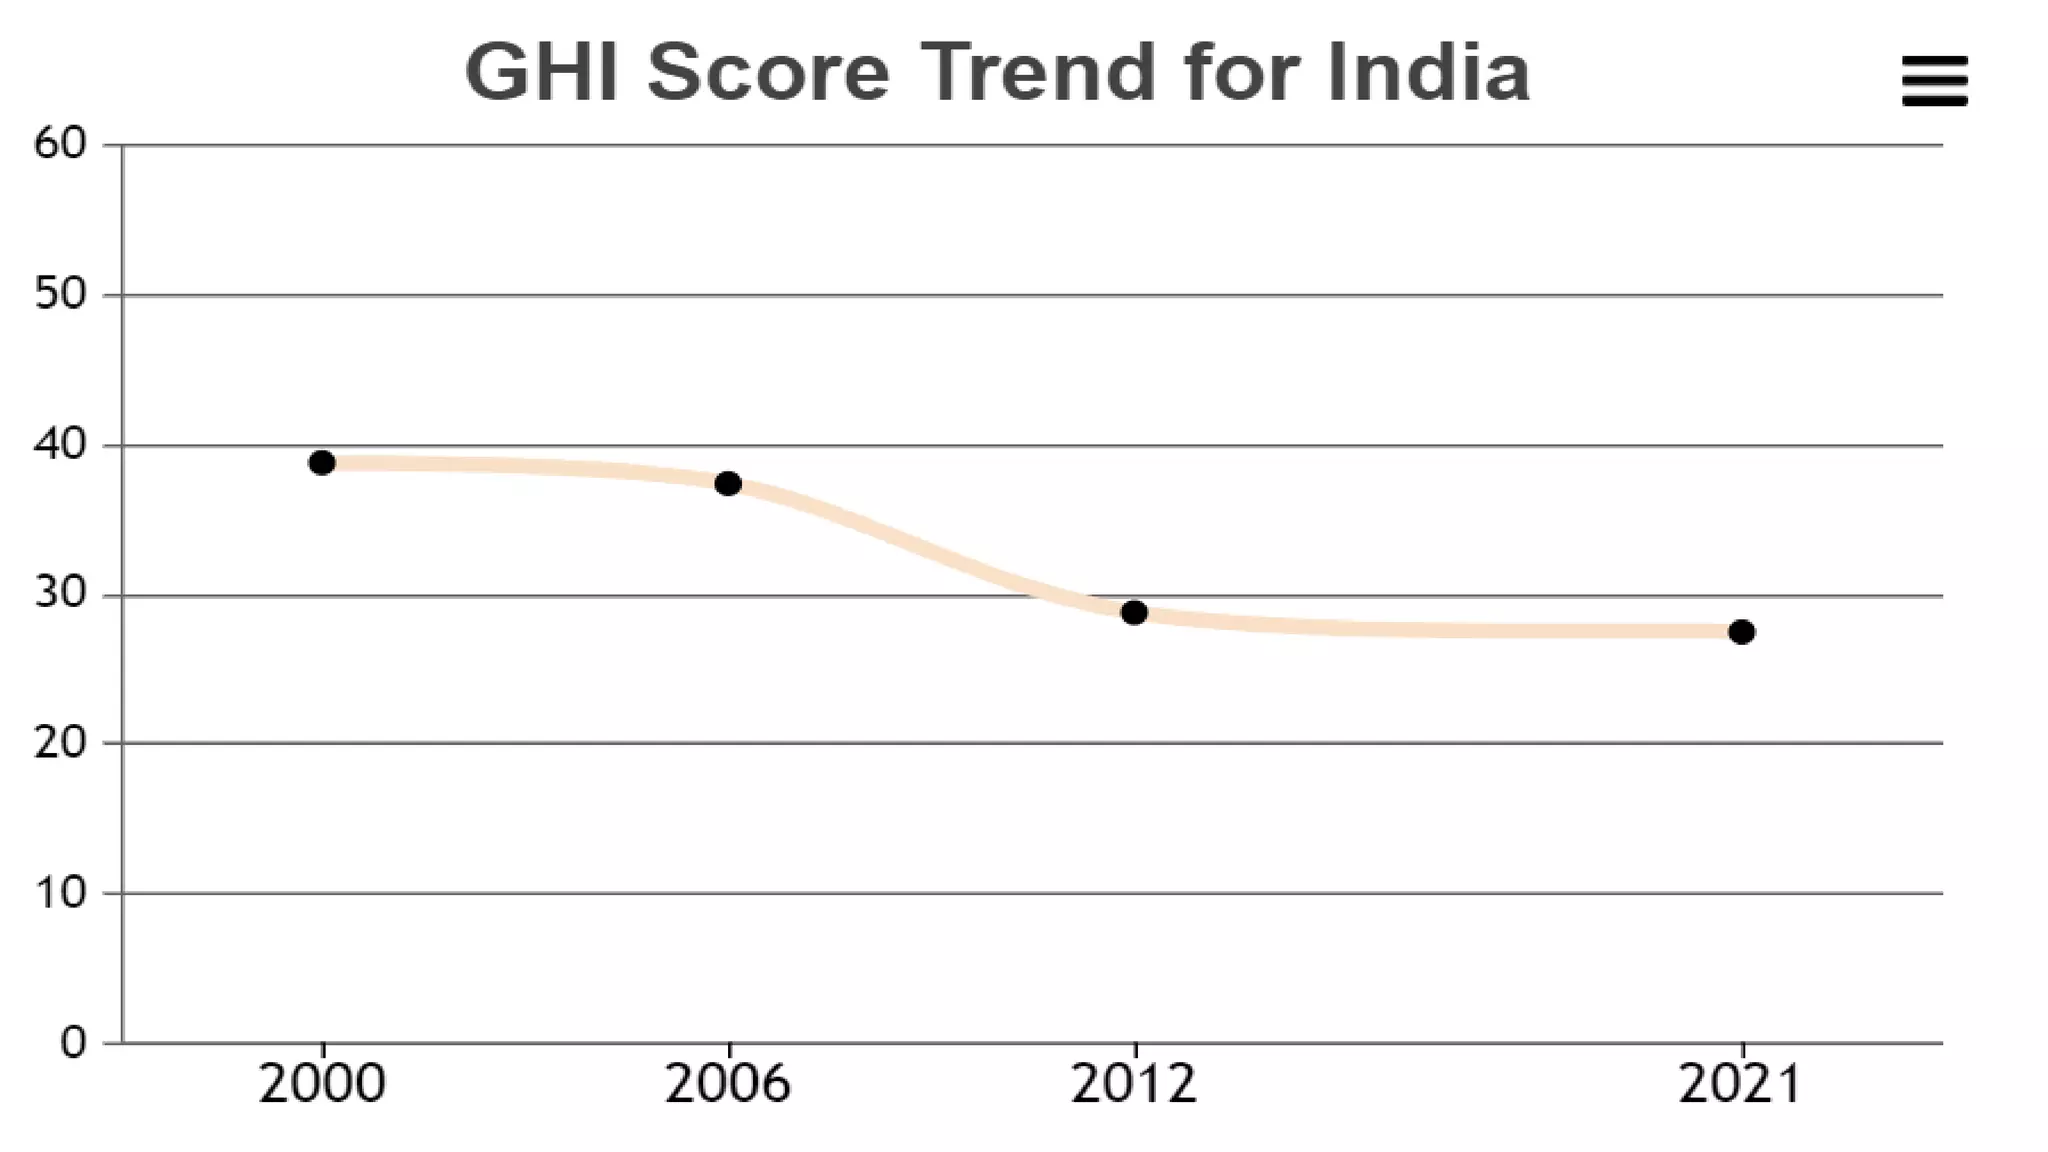
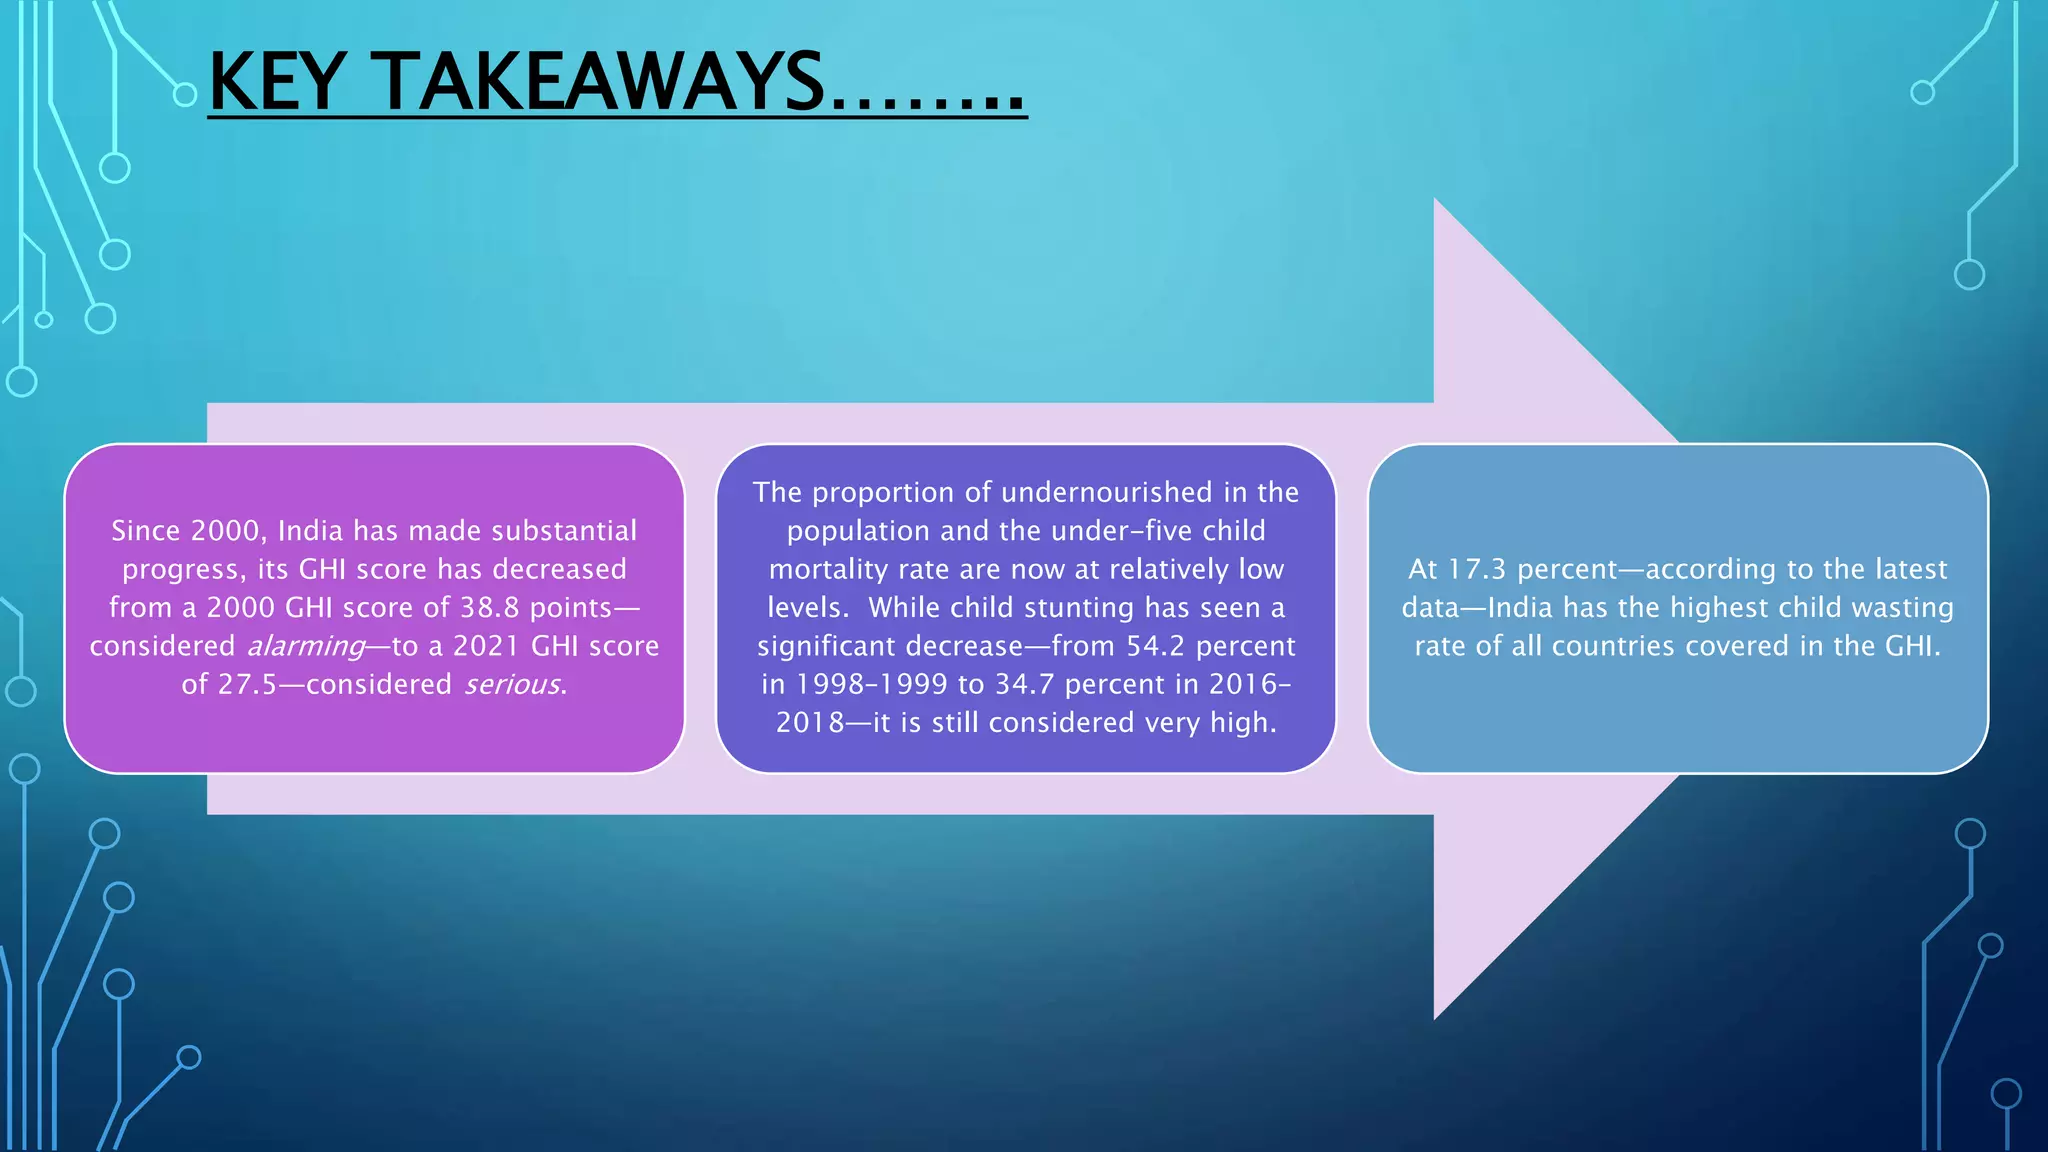
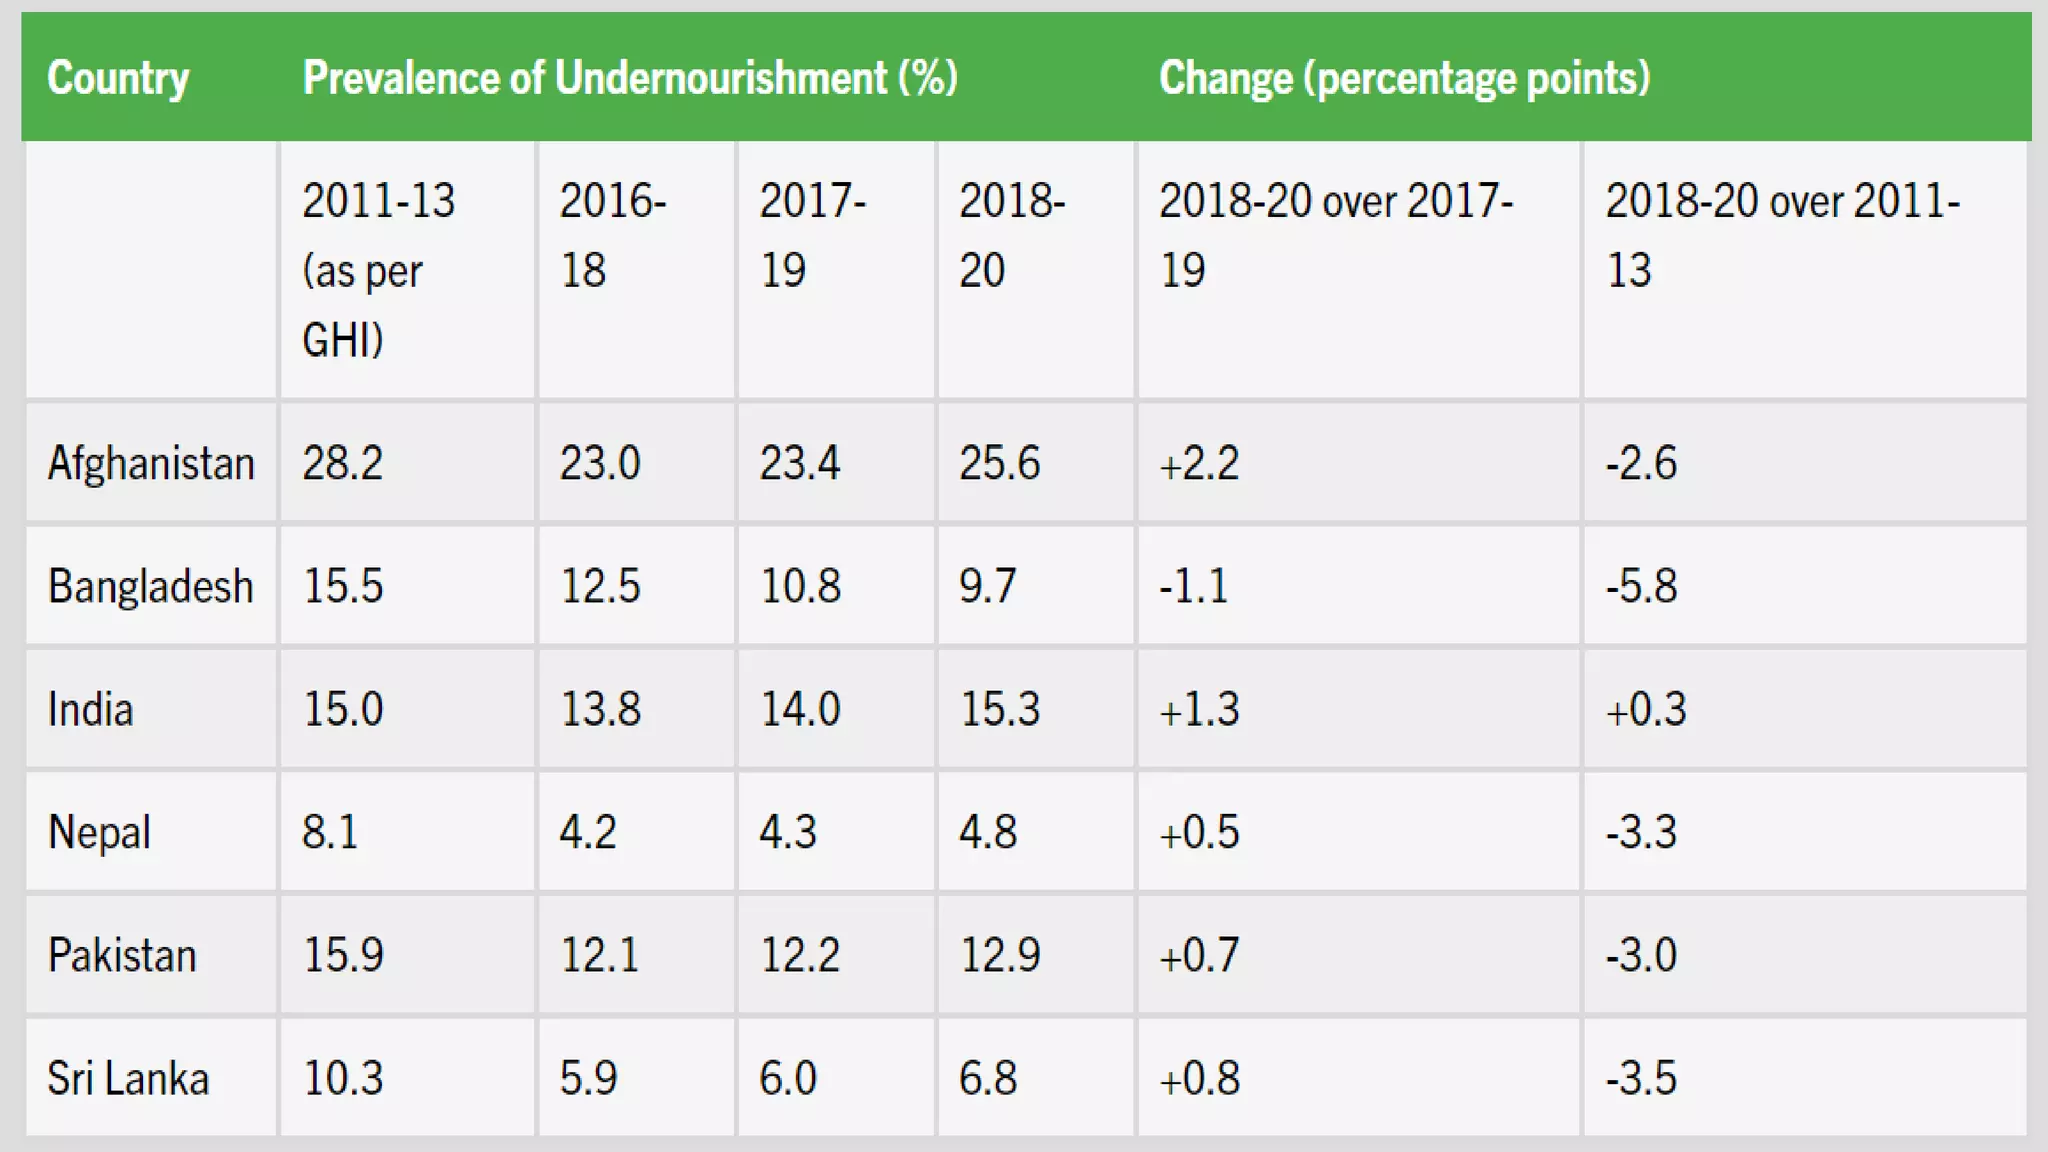
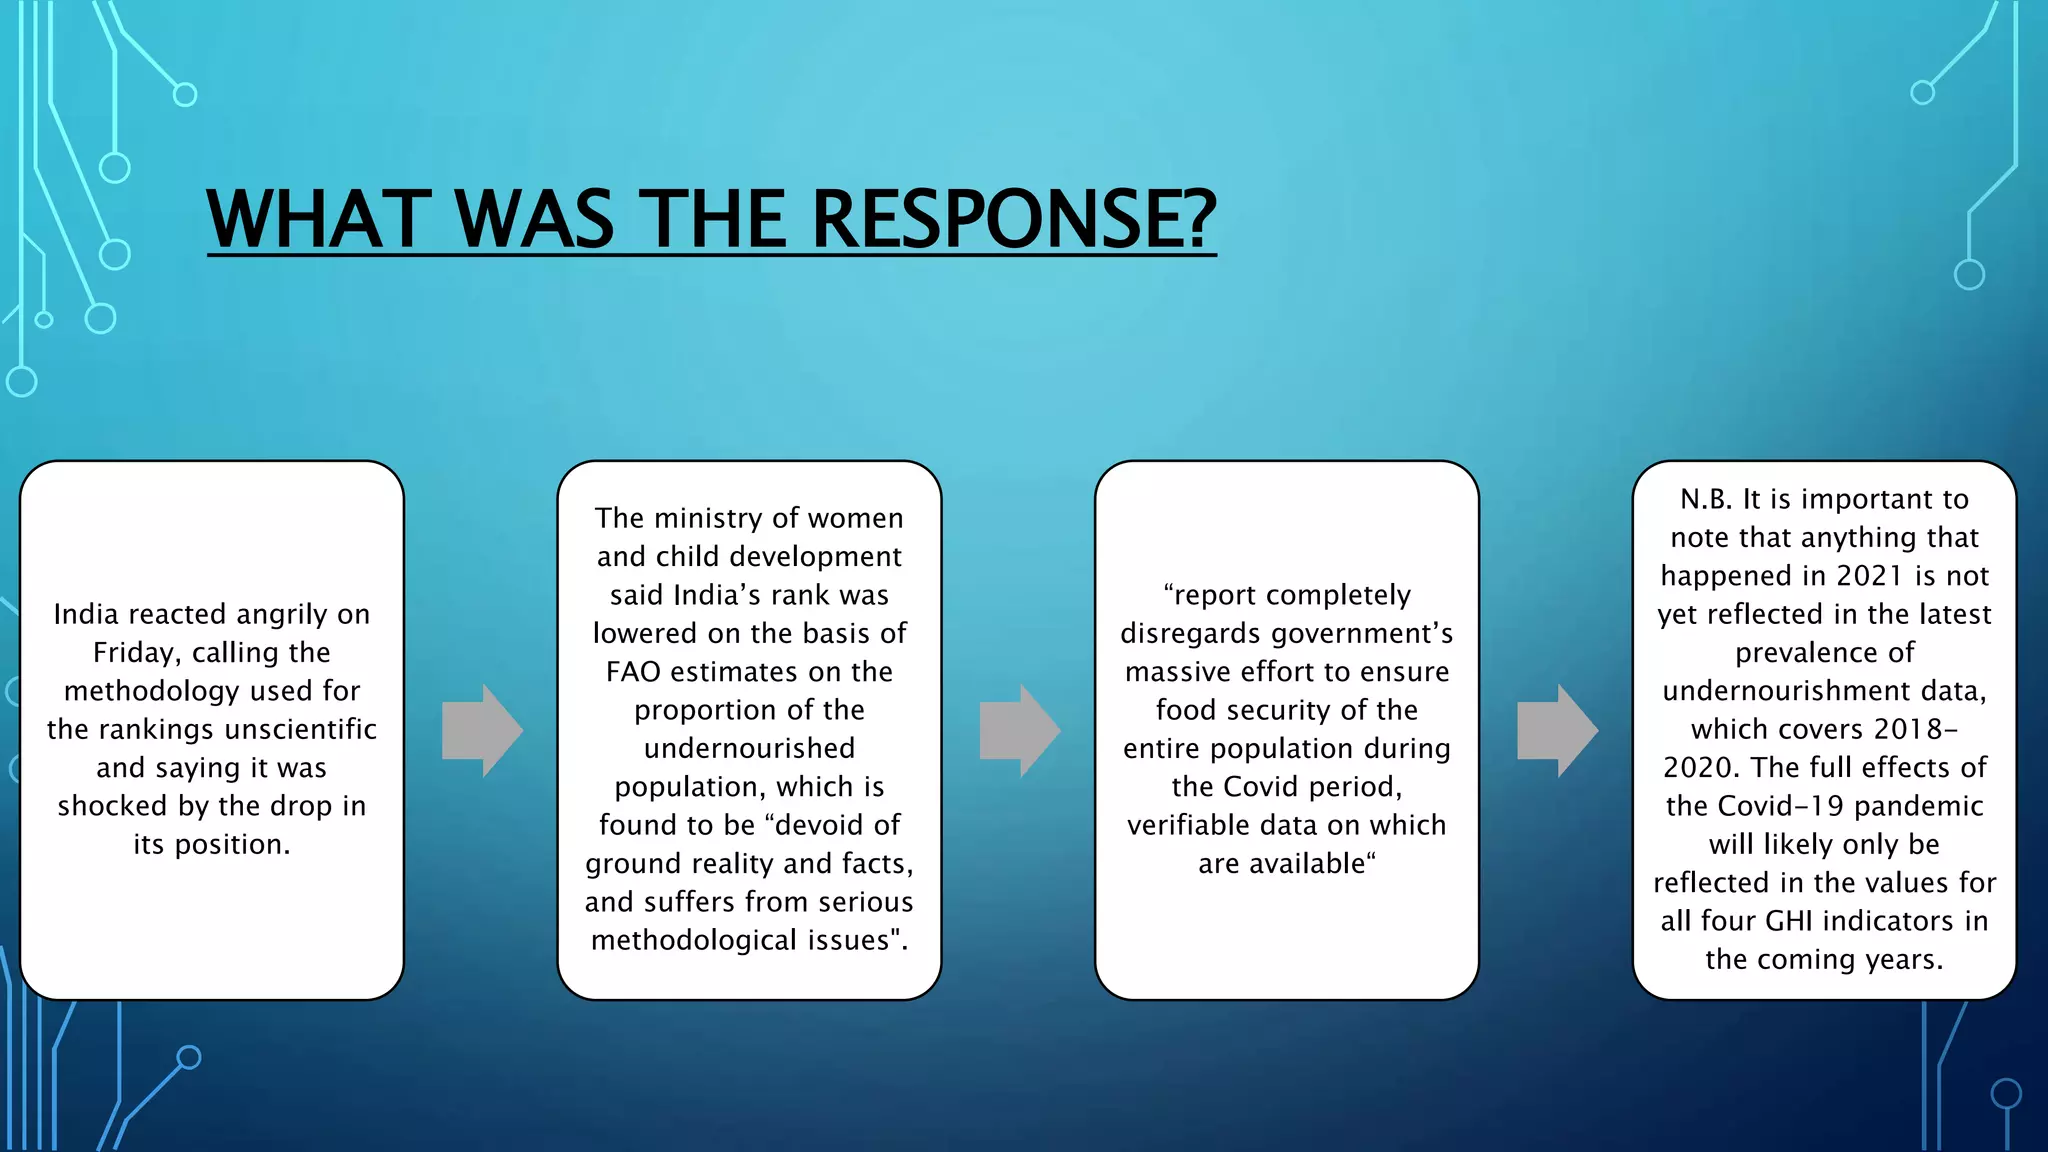
GLOBAL HUNGER INDEX
2021:
INDIA’S STRUGGLE WITH SDG 02
PRESENTED BY : ATHUL JOSEPH
DATE : 05/11/2021
ISDG PG CERTIFICATE PROGRAMME
INTRODUCTION……….
The Global Hunger Index (GHI) is a
tool that measures and tracks
hunger globally as well as by
region and by country, prepared by
European NGOs of Concern
Worldwide and Welthungerhilfe.
The GHI is calculated annually, and
its results appear in a report issued
in October each year.
The 2021 Global Hunger Index
report presents a multidimensional
measure of national, regional, and
global hunger by assigning a
numerical score based on several
aspects of hunger.
WHAT IS MEANT BY “HUNGER”?
Hunger/ Food Deprivation : FAO
defines food deprivation as the
consumption of too few calories to
provide the minimum amount of
dietary energy that each individual
requires to live a healthy and
productive life
Undernutrition : deficiencies in
any or all of the following:
energy, protein, and/ or
essential vitamins and minerals.
It is the result of inadequate
intake of food in terms of either
quantity or quality, poor
utilization of nutrients due to
infections or other illnesses, or
a combination of these.
Malnutrition : refers to both
undernutrition and
overnutrition (problems caused
by unbalanced diets, such as
consuming too many calories in
relation to requirements with or
without the low intake of
micronutrient-rich foods).
How are the GHI scores calculated?
GHI scores are calculated using a
three-step process that draws on
available data from various sources
to capture the multidimensional
nature of hunger.
for each country, values are
determined for four indicators:
UNDERNOURISHMENT: the share
of the population that is
undernourished (that is, whose
caloric intake is insufficient);
CHILD WASTING: the share of
children under the age of five who
are wasted (that is, who have low
weight for their height, reflecting
acute undernutrition);
CHILD STUNTING: the share of
children under the age of five who
are stunted (that is, who have low
height for their age, reflecting
chronic undernutrition); and
CHILD MORTALITY: the mortality
rate of children under the age of
five (in part, a reflection of the fatal
mix of inadequate nutrition and
unhealthy environments).
Step 1 Determine values for each of the
component indicators:
PUN: proportion of the population that is
undernourished (in %)
CWA: prevalence of wasting in children
under five years old (in %)
CST: prevalence of stunting in children
under five years old (in %)
CM: proportion of children dying before
the age of five (in %)
Step 2 Standardize
component indicators
Standardized PUN =
PUN/ 80× 100
Standardized CWA =
CWA/30× 100
Standardized CST =
CST/ 70 × 100
Standardized CM =
CM /70 × 100
Step 3 Aggregate component
indicators:
1 /3 × Standardized PUN +
1 /6 × Standardized CWA +
1 /6 × Standardized CST +
1 /3 × Standardized CM
= GHI score
WHY DOES THE GHI INCORPORATE FOUR DIFFERENT INDICATORS?
Using this combination of indicators to measure hunger offers several
advantages. The indicators included in the GHI formula reflect caloric
deficiencies as well as poor nutrition. The undernourishment indicator
captures the nutrition situation of the population as a whole, while the
indicators specific to children reflect the nutrition status within a
particularly vulnerable subset of the population for whom a lack of
dietary energy, protein, and/or micronutrients (essential vitamins and
minerals) leads to a high risk of illness, poor physical and cognitive
development, and death. The inclusion of both child wasting and child
stunting allows the GHI to document both acute and chronic
undernutrition. By combining multiple indicators, the index reduces
the effects of random measurement errors.
MAIN CONCLUSIONS FROM GHI 2021:
Based on current GHI projections,
the world as a whole - and 47
countries in particular - will fail to
achieve a low level of hunger by
2030.
Food security is under assault on
multiple fronts. Worsening conflict,
weather extremes associated with
global climate change, and the
economic and health challenges
associated with the COVID-19
pandemic are all driving hunger.
After decades of decline, the global
prevalence of undernourishment - a
component of the Global Hunger
Index - is increasing.
Africa South of the Sahara and South
Asia is the world regions where
hunger levels are highest. Hunger in
both regions is considered serious.
According to the 2021 GHI scores
and provisional designations hunger
is considered extremely alarming in
one country (Somalia), alarming in 9
countries, and serious in 37
countries.
INDIA AND GHI 2021: A CASE FOR
CONCERN
• In the 2021 Global Hunger Index, India ranks 101st out of the 116 countries with
sufficient data to calculate 2021 GHI scores trailing behind its South Asian
neighbours Pakistan, Bangladesh and Nepal.
• With a score of 27.5, India has a level of hunger that is serious.
KEY TAKEAWAYS……..
Since 2000, India has made substantial
progress, its GHI score has decreased
from a 2000 GHI score of 38.8 points—
considered alarming—to a 2021 GHI score
of 27.5—considered serious.
The proportion of undernourished in the
population and the under-five child
mortality rate are now at relatively low
levels. While child stunting has seen a
significant decrease—from 54.2 percent
in 1998–1999 to 34.7 percent in 2016–
2018—it is still considered very high.
At 17.3 percent—according to the latest
data—India has the highest child wasting
rate of all countries covered in the GHI.
WHAT WAS THE RESPONSE?
India reacted angrily on
Friday, calling the
methodology used for
the rankings unscientific
and saying it was
shocked by the drop in
its position.
The ministry of women
and child development
said India’s rank was
lowered on the basis of
FAO estimates on the
proportion of the
undernourished
population, which is
found to be “devoid of
ground reality and facts,
and suffers from serious
methodological issues".
“report completely
disregards government’s
massive effort to ensure
food security of the
entire population during
the Covid period,
verifiable data on which
are available“
N.B. It is important to
note that anything that
happened in 2021 is not
yet reflected in the latest
prevalence of
undernourishment data,
which covers 2018-
2020. The full effects of
the Covid-19 pandemic
will likely only be
reflected in the values for
all four GHI indicators in
the coming years.
Global hunger index 2021

Global hunger index 2021

  • 1.
    GLOBAL HUNGER INDEX 2021: INDIA’SSTRUGGLE WITH SDG 02 PRESENTED BY : ATHUL JOSEPH DATE : 05/11/2021 ISDG PG CERTIFICATE PROGRAMME
  • 2.
    INTRODUCTION………. The Global HungerIndex (GHI) is a tool that measures and tracks hunger globally as well as by region and by country, prepared by European NGOs of Concern Worldwide and Welthungerhilfe. The GHI is calculated annually, and its results appear in a report issued in October each year. The 2021 Global Hunger Index report presents a multidimensional measure of national, regional, and global hunger by assigning a numerical score based on several aspects of hunger.
  • 3.
    WHAT IS MEANTBY “HUNGER”? Hunger/ Food Deprivation : FAO defines food deprivation as the consumption of too few calories to provide the minimum amount of dietary energy that each individual requires to live a healthy and productive life Undernutrition : deficiencies in any or all of the following: energy, protein, and/ or essential vitamins and minerals. It is the result of inadequate intake of food in terms of either quantity or quality, poor utilization of nutrients due to infections or other illnesses, or a combination of these. Malnutrition : refers to both undernutrition and overnutrition (problems caused by unbalanced diets, such as consuming too many calories in relation to requirements with or without the low intake of micronutrient-rich foods).
  • 4.
    How are theGHI scores calculated? GHI scores are calculated using a three-step process that draws on available data from various sources to capture the multidimensional nature of hunger. for each country, values are determined for four indicators: UNDERNOURISHMENT: the share of the population that is undernourished (that is, whose caloric intake is insufficient); CHILD WASTING: the share of children under the age of five who are wasted (that is, who have low weight for their height, reflecting acute undernutrition); CHILD STUNTING: the share of children under the age of five who are stunted (that is, who have low height for their age, reflecting chronic undernutrition); and CHILD MORTALITY: the mortality rate of children under the age of five (in part, a reflection of the fatal mix of inadequate nutrition and unhealthy environments).
  • 5.
    Step 1 Determinevalues for each of the component indicators: PUN: proportion of the population that is undernourished (in %) CWA: prevalence of wasting in children under five years old (in %) CST: prevalence of stunting in children under five years old (in %) CM: proportion of children dying before the age of five (in %) Step 2 Standardize component indicators Standardized PUN = PUN/ 80× 100 Standardized CWA = CWA/30× 100 Standardized CST = CST/ 70 × 100 Standardized CM = CM /70 × 100 Step 3 Aggregate component indicators: 1 /3 × Standardized PUN + 1 /6 × Standardized CWA + 1 /6 × Standardized CST + 1 /3 × Standardized CM = GHI score
  • 7.
    WHY DOES THEGHI INCORPORATE FOUR DIFFERENT INDICATORS? Using this combination of indicators to measure hunger offers several advantages. The indicators included in the GHI formula reflect caloric deficiencies as well as poor nutrition. The undernourishment indicator captures the nutrition situation of the population as a whole, while the indicators specific to children reflect the nutrition status within a particularly vulnerable subset of the population for whom a lack of dietary energy, protein, and/or micronutrients (essential vitamins and minerals) leads to a high risk of illness, poor physical and cognitive development, and death. The inclusion of both child wasting and child stunting allows the GHI to document both acute and chronic undernutrition. By combining multiple indicators, the index reduces the effects of random measurement errors.
  • 9.
    MAIN CONCLUSIONS FROMGHI 2021: Based on current GHI projections, the world as a whole - and 47 countries in particular - will fail to achieve a low level of hunger by 2030. Food security is under assault on multiple fronts. Worsening conflict, weather extremes associated with global climate change, and the economic and health challenges associated with the COVID-19 pandemic are all driving hunger. After decades of decline, the global prevalence of undernourishment - a component of the Global Hunger Index - is increasing. Africa South of the Sahara and South Asia is the world regions where hunger levels are highest. Hunger in both regions is considered serious. According to the 2021 GHI scores and provisional designations hunger is considered extremely alarming in one country (Somalia), alarming in 9 countries, and serious in 37 countries.
  • 10.
    INDIA AND GHI2021: A CASE FOR CONCERN • In the 2021 Global Hunger Index, India ranks 101st out of the 116 countries with sufficient data to calculate 2021 GHI scores trailing behind its South Asian neighbours Pakistan, Bangladesh and Nepal. • With a score of 27.5, India has a level of hunger that is serious.
  • 12.
    KEY TAKEAWAYS…….. Since 2000,India has made substantial progress, its GHI score has decreased from a 2000 GHI score of 38.8 points— considered alarming—to a 2021 GHI score of 27.5—considered serious. The proportion of undernourished in the population and the under-five child mortality rate are now at relatively low levels. While child stunting has seen a significant decrease—from 54.2 percent in 1998–1999 to 34.7 percent in 2016– 2018—it is still considered very high. At 17.3 percent—according to the latest data—India has the highest child wasting rate of all countries covered in the GHI.
  • 14.
    WHAT WAS THERESPONSE? India reacted angrily on Friday, calling the methodology used for the rankings unscientific and saying it was shocked by the drop in its position. The ministry of women and child development said India’s rank was lowered on the basis of FAO estimates on the proportion of the undernourished population, which is found to be “devoid of ground reality and facts, and suffers from serious methodological issues". “report completely disregards government’s massive effort to ensure food security of the entire population during the Covid period, verifiable data on which are available“ N.B. It is important to note that anything that happened in 2021 is not yet reflected in the latest prevalence of undernourishment data, which covers 2018- 2020. The full effects of the Covid-19 pandemic will likely only be reflected in the values for all four GHI indicators in the coming years.