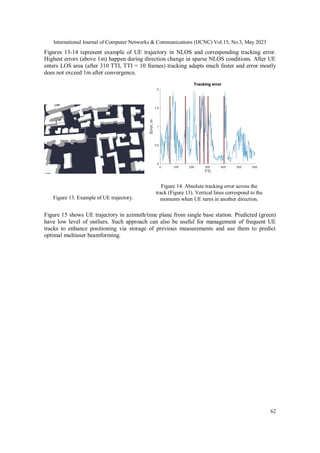
This document summarizes a paper that proposes using ray tracing for 5G positioning, channel estimation, and multi-user precoding. It describes using ray tracing to estimate the angles of arrival of uplink signals from user equipment at distributed base stations. The estimated angles are then used in a joint positioning technique run in the cloud to determine the user's location. Simulation results show meter-level accuracy can be achieved even in non-line-of-sight conditions. Ray tracing tracking is also used for channel prediction and improves spectral efficiency. Practical considerations for achieving high positioning accuracy with this approach are also discussed.
![International Journal of Computer Networks & Communications (IJCNC) Vol.15, No.3, May 2023
DOI: 10.5121/ijcnc.2023.15304 51
ENABLING RAY TRACING FOR 5G
Vladislav Ryzhov
Department of Multimedia Technologies and Telecommunications,
Moscow Institute of Physics and Technology, Moscow, Russia
Yadro Telecom, Saint Petersburg, Russia
ABSTRACT
RT (Ray Tracing) models are widely used in RAN for channel modelling. Another possible application in
processing chain of base station with multiple purposes: positioning, channel estimation/prediction, radio
resources scheduling and others. In this paper RT positioning technique is addressed for Urban Outdoor
scenario. Proposed robust approach achieves several meters accuracy even in NLOS and multipath
conditions. Developed RT tracking was used for multiuser (MU) precoder prediction and demonstrated
significant capacity gain. Also, this paper discloses practical aspects for achieving high accuracy.
KEYWORDS
Positioning, Ray Tracing, UL-AoA, multiuser precoder, GPS measurement, channel prediction, channel
reciprocity.
1. INTRODUCTION
Positioning is an old task for wireless communications. The roughest and low-complex methods
include identification by Cell-ID and RSS (Received Signal Strength). With high synchronization
requirements [1] GPS and TDoA (Time Difference of Arrival) measurements increase
positioning accuracy up to dozens of meters. Nowadays, base stations are equipped with large
antenna arrays (e.g., 32T32R) and the current trend is to split panels into several ones [2-3] or use
the single panel with the increased number of elements. Under these assumptions, angular
domain represents most accurate method for positioning [4]. At the same time the most of the
classic algorithms suffer from multipath propagation, LOS blockage, and variable channel
conditions. Another future concept is cooperative MIMO, which is expected to improve spectral
efficiency and coverage mostly by increasing a number of degrees of freedom and channel
diversity [5].
The Proposed RT (Ray Tracing) positioning approach exploits multipoint reception and angular
spectrum estimation. It is robust to complex propagation conditions and partly benefits from large
scattering and multipoint reception. Due to joint RT processing of distributed AoA measurements
proposed method is the most suitable for C-RAN (Cloud Radio Access Network) architecture.
Also, such an approach can be used for real-time CSI (Channel State Information) or digital
precoder prediction or provide more information for dynamic scheduling for operators.
RT requires high-precision maps for accurate localization. In this paper, we omit issues related to
accumulation data for accurate map reconstruction. With multiple of automotive sensors,
satellite images, cameras, etc. this map can be found. Although our approach does not require
additional distributed synchronization, it assumes only intra-panel synchronization and
calibration for angular spectrum estimation. Problems related to imperfect calibration,](https://image.slidesharecdn.com/15323cnc04-230621061625-81d2d0c7/85/Enabling-Ray-Tracing-for-5G-1-320.jpg)
![International Journal of Computer Networks & Communications (IJCNC) Vol.15, No.3, May 2023
DOI: 10.5121/ijcnc.2023.15304 51
ENABLING RAY TRACING FOR 5G
Vladislav Ryzhov
Department of Multimedia Technologies and Telecommunications,
Moscow Institute of Physics and Technology, Moscow, Russia
Yadro Telecom, Saint Petersburg, Russia
ABSTRACT
RT (Ray Tracing) models are widely used in RAN for channel modelling. Another possible application in
processing chain of base station with multiple purposes: positioning, channel estimation/prediction, radio
resources scheduling and others. In this paper RT positioning technique is addressed for Urban Outdoor
scenario. Proposed robust approach achieves several meters accuracy even in NLOS and multipath
conditions. Developed RT tracking was used for multiuser (MU) precoder prediction and demonstrated
significant capacity gain. Also, this paper discloses practical aspects for achieving high accuracy.
KEYWORDS
Positioning, Ray Tracing, UL-AoA, multiuser precoder, GPS measurement, channel prediction, channel
reciprocity.
1. INTRODUCTION
Positioning is an old task for wireless communications. The roughest and low-complex methods
include identification by Cell-ID and RSS (Received Signal Strength). With high synchronization
requirements [1] GPS and TDoA (Time Difference of Arrival) measurements increase
positioning accuracy up to dozens of meters. Nowadays, base stations are equipped with large
antenna arrays (e.g., 32T32R) and the current trend is to split panels into several ones [2-3] or use
the single panel with the increased number of elements. Under these assumptions, angular
domain represents most accurate method for positioning [4]. At the same time the most of the
classic algorithms suffer from multipath propagation, LOS blockage, and variable channel
conditions. Another future concept is cooperative MIMO, which is expected to improve spectral
efficiency and coverage mostly by increasing a number of degrees of freedom and channel
diversity [5].
The Proposed RT (Ray Tracing) positioning approach exploits multipoint reception and angular
spectrum estimation. It is robust to complex propagation conditions and partly benefits from large
scattering and multipoint reception. Due to joint RT processing of distributed AoA measurements
proposed method is the most suitable for C-RAN (Cloud Radio Access Network) architecture.
Also, such an approach can be used for real-time CSI (Channel State Information) or digital
precoder prediction or provide more information for dynamic scheduling for operators.
RT requires high-precision maps for accurate localization. In this paper, we omit issues related to
accumulation data for accurate map reconstruction. With multiple of automotive sensors,
satellite images, cameras, etc. this map can be found. Although our approach does not require
additional distributed synchronization, it assumes only intra-panel synchronization and
calibration for angular spectrum estimation. Problems related to imperfect calibration,](https://image.slidesharecdn.com/15323cnc04-230621061625-81d2d0c7/75/Enabling-Ray-Tracing-for-5G-1-2048.jpg)
![International Journal of Computer Networks & Communications (IJCNC) Vol.15, No.3, May 2023
52
interference directions, and inaccurate maps are solved via probabilistic weighting and clustering.
Anyway, the map inaccuracy and antenna calibration are discussed in this paper.
The contribution of this paper is that it complements an approach for precise and robust RT
positioning presented in [6] with practical restrictions. Also, it demonstrates performance gain
from the use of RT tracking for channel prediction.
2. SYSTEM MODEL
2.1. Channel Model
The Uplink channel is modeled via RT in a certain outdoor environments, obtained from parsed
3D OSM (Open Street Map) with typically located UEs (User Equipment) and RRUs (Remote
Radio Units) from open-source maps with mobile operator towers and their frequency bands.
2.2. Layout
Cooperating RRUs (with 1200
sector antenna) are placed to satisfy ISD ≈ 150 m, tilt ≈ 100
, a
height ≈ 15-25 m. UEs are evenly spaced in the street at height of 1.5 m. For simplicity, each UE
is equipped with one antenna with a uniform pattern, while RRU has a (4x8) horizontal antenna
array with a 3GPP antenna element radiation pattern [7].
ISD=150m
Figure 1. Layout with 3-sector antenna.
2.3. Signals
Each UE is configured [8] to send SRS (Sounding Reference Signal) in TDD mode with
granularity K_TC = 2 and N_RB = 272 PRBs.](https://image.slidesharecdn.com/15323cnc04-230621061625-81d2d0c7/85/Enabling-Ray-Tracing-for-5G-2-320.jpg)
![International Journal of Computer Networks & Communications (IJCNC) Vol.15, No.3, May 2023
53
2.4. Overall Positioning Model
High-resolution
angular spectrum
estimation
Joint positioning
Instant
position
CU
RT positioning
Launch rays
Probability-
weighted
positioning
Candidates
selection
DU
Θ,φ
UL signal
DU
Θ,φ
UL signal
DU
Θ,φ
UL signal
UE transmit
UL signal
OFDM
RRU-2
RRU-1
Signal reception
tracked
position
Clustering
Angular and
space domain
tracking
Non-arbitrary
steps
Figure 2. System model for positioning.
Multiple distributed RRUs cooperatively receive SRS, passed through the RT channel. After that,
each DU (Distributed Unit) independently finds AoAs (Angles of Arrival) from the estimated
angular spectrum. These estimates are reported to CU (Central Unit), which contains precise
outdoor model. CU localizes UE from current instantaneous measurement via RT search in a
direction of received angles. At this steps position represents a probabilistic estimate. Discarding
and clustering of estimated positions is done to cope with outliers from imperfect angle
estimation and map errors. Also, CU tracks measurements in the angular domain and expectation
of positions for each cluster in the space domain in order to additionally discard false positions
and smooth UE trajectory. To keep a trade-off between required accuracy and complexity we can
exchange additional clustering or tracking complexity for higher accuracy.
3. RT CHANNEL MODEL
RT channel modeling has good accuracy [9] and papers [10-12] describe RT positioning. The
developed C++ RT simulator has two main operating options: channel modeling and positioning.
In both cases, it contains the following propagation patterns:
Load buildings, roads,
etc. (OSM)
Locate UEs, RRUs,
define arrays and
patterns
Outdoor environment
Launch rays
Channel modeling
Trace rays
Free space propagation
Reflection
Diffraction
Scattering
IR update
Figure 3. Concept of developed channel modelling via RT.](https://image.slidesharecdn.com/15323cnc04-230621061625-81d2d0c7/85/Enabling-Ray-Tracing-for-5G-3-320.jpg)
![International Journal of Computer Networks & Communications (IJCNC) Vol.15, No.3, May 2023
54
● Free space propagation
Solution of Helmholtz wave equation for point source in far field is a spherical wave, which
defines phase and amplitude of propagating ray:
( 1 )
Reflection
When interfered with by building, ground, etc. ray is reflected according to geometrical optics
and reflection coefficients. From a Fresnel’s equation reflection coefficients can be found from
angles of incidence and reflection and electrical properties of material:
( 2 )
● Scattering
Due to the roughness of surface, ray is scattered around the direction of reflection. Authors of
[13] performed measurement campaign for scattering pattern of typical buildings and concluded
that single-lobe directive model was the closest:
( 3 )
● Diffraction
Paper [14] defines the most common Knife Edge Diffraction (KED) model:
Figure 4. For definition v [14].
( 4 )
where electric field can be found from:
( 5 )
and approximation ( ) for diffraction loss in dB:](https://image.slidesharecdn.com/15323cnc04-230621061625-81d2d0c7/85/Enabling-Ray-Tracing-for-5G-4-320.jpg)
![International Journal of Computer Networks & Communications (IJCNC) Vol.15, No.3, May 2023
55
( 6 )
For detailed maps prediction accuracy of RT, channel modeling is high [15]. The main hardship
is complexity, which can be reduced with minimum storage and computation techniques. For
these reasons, the following methods were used for the acceleration of tracing in the C++
simulator:
BVH (Bounding Volume Hierarchy) is a method [16] used for compact storage and
reduced intersection testing. To decrease the number of objects to compare, each object
and UE are mapped to a spatial grid, so that ray has interfered only with objects in a
current grid cell.
● Parallelepiped wrappers are utilized to perform fast initial intersection tests and discard
objects without complex surface processing.
● Fast implementation of 3D geometry for ray tracing [17-18] with an extensive application
of fast ray-triangle intersection [19].
4. POSITIONING
4.1. Independent AoA Estimation
Firstly, each RRU estimates independently high-resolution angular spectrum from received SRS,
e.g., via MUSIC algorithm [20] or smoothing modifications [21].
( 7 )
( 8 )
( 9 )
where – matrix whose columns are noise eigenvectors, – steering vector of antenna
panel with – tilt and – rotation of antenna array in the horizontal plane. AoAs are estimated
from the spectrum via CA-CFAR (Cell Averaging Constant False Alarm Rate) detector:
( 10 )
4.2. Joint Estimation of Spatial Probability Density
Cloud CU receives noisy estimates of angles from each DU and searches for
the positions by launching rays in close directions . Intersections of multiple rays
from several RRUs define possible emitter locations. Each of positions is associated
with probabilities of received rays and the expectation-maximization leads to:
( 11 )](https://image.slidesharecdn.com/15323cnc04-230621061625-81d2d0c7/85/Enabling-Ray-Tracing-for-5G-5-320.jpg)
![International Journal of Computer Networks & Communications (IJCNC) Vol.15, No.3, May 2023
57
4.4. Clustering of Probabilistic Estimates of Position
In general cases, erroneous angle acquisition may cause tracking extra directions (e.g., in music
algorithm it is caused by interference) or direction miss (e.g., small search area). These errors
lead to the decomposition of all positions into several remote clusters. Despite the probability of
fake clusters is typically low, it slightly decreases the accuracy of estimation. To increase
accuracy, we need to perform simple clustering of all positions and exclude fake clusters from
consideration.
First step of proposed clustering approach has complexity , while the second and third
steps are linear. In order to exclude storage of large table (memory ~ of distances this
algorithm can be replaced with similar with storage of logical vector of added positions (memory
~ .
If the following tracking is not being exploited the most likely cluster is used for selection of
optimal position (weighted with probabilities / max posterior position / combining / more
sophisticated with RT outputs).
4.5. Tracking in Angular Domain
AoA knowledge is equivalent to knowledge about position for accurate 3D maps. Tracking of
direct measurement (angles) is more appropriate than mediated because the error distribution for
the first one is more understandable, while the second one may produce biased trajectory. Due to
calibration residuals, interference and scattering estimate for azimuth/elevation is close to
mixture of uniform and normal/cauchy distributions or contaminated ones. For these reasons L2
optimization is less appropriate for tracking [22] rather then Lp (1<p<2) which is closer to
median (L1). Another reason to choose L1 were simulations, resulted in better error reduction
mainly due to ability to cope with outliers.
Clustering algorithm
1. Estimate table of distances. Initialize minimum
distance between clusters .
2. Perform DF (Depth-First search) of connected
subgraphs with condition of connectivity:
3. Find clusters’ centers from formula (11) and
corresponding variances.
AoA tracking algorithm
Do for each TTI with new AoA estimate:
1. Start trend from new angle estimate.
2. Check whether new estimate can be used to
update current trends.
3. Fit each single trend to a new estimate.
4. Check for redundant trends.
5. Erase noisy, redundant and outdated trends,
shrink buffers.
6. Predict angles with corresponding trend
deviations.](https://image.slidesharecdn.com/15323cnc04-230621061625-81d2d0c7/85/Enabling-Ray-Tracing-for-5G-7-320.jpg)
![International Journal of Computer Networks & Communications (IJCNC) Vol.15, No.3, May 2023
58
( 14 )
Figure 6 represents assumptions for the developed AoA tracking system. It includes a linear
change of noised AoA between TTI (from steering vectors (9) and long distance to tracking
object (14)), AoA estimation miss, false AoA detection, sudden AoA change (UE changed
traveling direction or got around the corner of the building) and irregular TTI structure. AoA
tracking is done for each antenna array and azimuth/elevation independently. Lp fit for a single
trend is described in [23].
TTI
azimuth/
elevation
Missed AoA
estimation
New angle
Estimation/
calibration
errors
AoA estimation
at TTI-0
AoA estimation
at TTI-1
AoA estimation
at TTI-2
Missed TTI
False
interference
angles
Direction change
Out of the range
Figure 6. Assumptions for angle tracking model.
Angle predictions are used then for RT positioning with probabilistic weights (13) and additional
weights from trend deviations from azimuth and elevation:
( 15 )
The same tracking system without separation for several trends is used for main cluster tracking.
Figure 7 reveals the idea for cluster tracking.
RRU-1
RRU-2
RRU-3
Fake instant
cluster
Fake instant cluster
Fake instant
cluster
False
untracked
cluster
False
untracked
cluster
True cluster
Figure 7. Representation of clusters tracking.](https://image.slidesharecdn.com/15323cnc04-230621061625-81d2d0c7/85/Enabling-Ray-Tracing-for-5G-8-320.jpg)
![International Journal of Computer Networks & Communications (IJCNC) Vol.15, No.3, May 2023
61
Position with maximum posterior probability
Most expected position, averaged in cluster
Figure 11. CDF of error of joint estimation of expected position with main cluster selection (after step 4.4).
Both of these strategies are presented in graph as well as their combination. Optimal clustering
provides positioning error with Pr = 0.9 less than 1.3m for typical mixed LOS/NLOS Urban
Outdoor scenario while without clustering 1.3m is reached with Pr = 0.5. In case of more accurate
phase synchronization (+/- 10
@3σ) at the same probability level localization accuracy reaches
0.9m, which perfectly fits 5G NR requirements for accuracy [24-25].
True positioning error is highly correlated to interim assessment of position variance among a set
of possible positions with Pearson correlation coefficient = 0.7, which means that the most of
predicted positions can be estimated with very close errors. Better error control as mentioned
earlier can be achieved by matching positions with exact patterns from RT outputs.
Figure 12. Example of clustering of candidates for UE position](https://image.slidesharecdn.com/15323cnc04-230621061625-81d2d0c7/85/Enabling-Ray-Tracing-for-5G-11-320.jpg)
![International Journal of Computer Networks & Communications (IJCNC) Vol.15, No.3, May 2023
64
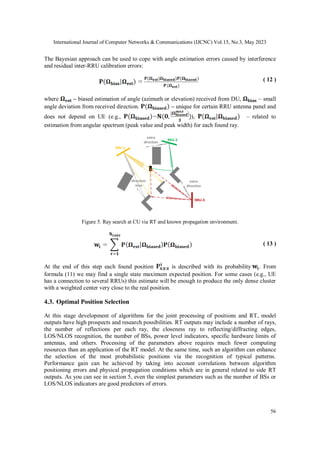
Figure 16. Representation of ray tracing for a new object state.
Table 2 represents decrease of positioning error in inaccurate map with proposed calibration
procedure. Generally, it allows to decrease additional error with relatively small residual one. It
was noticed that in cases with poor distribution of UEs in space or its small amount
corresponding object was overfitted, which influenced map, but not positioning accuracy. Also,
final variances of estimates after calibration were much better correlated with true positioning
error (Pearson correlation is up to 0.9).
Table 2. Contribution of map inaccuracy to localization error and map calibration procedure.
Deviation from true
value
Map without calibration
Calibrated
map
median 90% percentile 90% percentile
no 0.7 m 1.3 m 1.3 m
Transmission
coefficient
1 m 1.7 m 1.5 m
0.8 m 1.5 m 1.4 m
Building, walls
position
1.2 m 2.1 m 1.5 m
1.5 m 2.5 m 1.5 m
The most of increase of position error from inaccurate map came from UE with a little number of
rays or served by the only base station. Also ray search area has to be increased to partly mitigate
error.
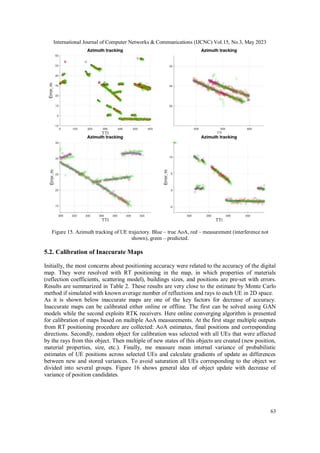
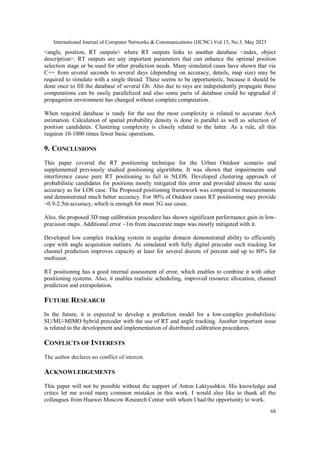
5.3. Comparison of Measurements and Simulations
Simulation results above were compared [26] with real GPS measurements in the same outdoor
positions as simulated. About 1000 measurements were done both via Samsung Galaxy Note 8
(GPS Test software) and iPhone SE (GPS Data Smart software). The following metrics were
collected for each measurement:
Horizontal accuracy
Internal software estimate of positioning accuracy corresponding to 68% confidence interval.
Measured accuracy
Absolute difference of positions in Google or Yandex maps and real environment (compared to
surrounding buildings)](https://image.slidesharecdn.com/15323cnc04-230621061625-81d2d0c7/85/Enabling-Ray-Tracing-for-5G-14-320.jpg)
![International Journal of Computer Networks & Communications (IJCNC) Vol.15, No.3, May 2023
65
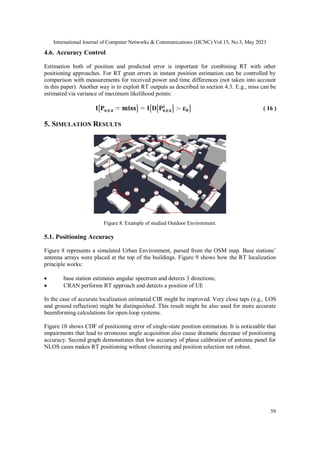
Table 3 provides results of experiment and compares with simulations (with combined cluster
selection, but without tracking). On average proposed approach has a several times higher
accuracy than GNSS one.
Table 3. Comparison between accuracy of measurements and simulations.
median 90% percentile
Note 8
Horizontal accuracy 5.2 m 8.9 m
Measured accuracy 4.7 m 8.6 m
iPhone SE
Horizontal accuracy 5.0 m 7.9 m
Measured accuracy 7.6 m 11..2 m
Simulated
10
@3σ 0.5 m 1.2 m
30
@3σ 0.7 m 1.5 m
Figure 17. Example of usage GPS Test and Yandex Maps for single measurement.
6. APPLICATION OF RT FOR CHANNEL PREDICTION
One of possible applications of Ray Tracing model apart from pure positioning is
precoder/channel tracking. Predicted position of UE can be used for beamforming calculation.
Article [27] contains generalized MU precoder design, which was used for sum rate calculation.
UEs channel matrices are merged together:
to find orthogonal projection:
.
UE channel matrix is projected into it:
.
And the final precoder is:
.
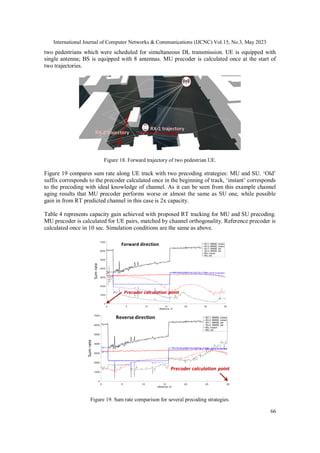
Under the assumption of full-digital of hybrid [28-29] beamforming predicted position of UE was
converted to CIR and was used for beamforming calculation. Figure 18 represents trajectory of](https://image.slidesharecdn.com/15323cnc04-230621061625-81d2d0c7/85/Enabling-Ray-Tracing-for-5G-15-320.jpg)
![International Journal of Computer Networks & Communications (IJCNC) Vol.15, No.3, May 2023
67
Prediction of SU precoder in NLOS gives up to 30%, which is good result, but under practical
implementation does not seem so desirable. Despite SU precoder in LOS shows better results
than in NLOS, tracking in this case might be much less complex than with RT. The most sum
rate gain corresponds to MU precoding. Reduction of allocated resources for channel sounding
was not taken into account here. Thus, MU precoder calculation in advance with RT predictions
seems the most promising application.
Table 4. Average approximate simulated sum rate gain from utilization of RT tracking.
AoA accuracy 10
@3σ 20
@3σ
SU, LOS
MMSE 40% 35%
ZF 60% 40%
SU, NLOS
MMSE 15% 15%
ZF 30% 25%
MU --- 80% 60%
Apart from TDD channel prediction RT approach may improve theoretical lower bound of FDD
channel extrapolation [30] and reduce receiver complexity.
7. ANTENNA CALIBRATION
In order to achieve high accuracy of the angular spectrum estimation, precise installation of base
station antennas is required as well as stricter requirements for wind load and accuracy of
positions of base stations. These issues require to remove bias from estimated AoA and location
of UE by correction with averaged by UE estimates of obtained via RT weighted rays and
positions. This correction values are calculated at CPU and reported to DU.
One of the main advantages of proposed positioning approach is that network time
synchronization between different units is enough as well as no extra requirements for frequency
synchronization needed. At the same time each 10 ns delays difference in tx/rx chains adds 4.2
meters error for 1 BS and 2.4 for 3 BSs with TDOA positioning, which is much higher than with
proposed approach. But according to [31] time alignment error might be up to 65 ns between
antenna ports, which makes impossible accurate AoA estimation and requires calibration
procedure.
Typical 8T8R antenna includes additional calibration port [32] to remove phase and amplitude
differences between RF signals. Self-calibration with embedded transmission lines accuracy is
about 6 degrees [33], which is much lower than required to overcome GPS accuracy. Over-the-
Air calibration [34-35] provides desired phase accuracy [36] with group-based methods.
8. RT IMPLEMENTATION
The Proposed RT approach for positioning is beneficial for future RAN at least because it
produces new independent estimates for joint filters exploiting GPS, sensors, TDoA from base
stations, etc. It transfers the main load to the server and does not burden edges with large
computations and has minimum backhaul traffic.
Another important issue to mention is the fast, low-complex, and memory-efficient RT model.
For the only purpose of positioning, it can be effectively stored in a database containing sets](https://image.slidesharecdn.com/15323cnc04-230621061625-81d2d0c7/85/Enabling-Ray-Tracing-for-5G-17-320.jpg)
![International Journal of Computer Networks & Communications (IJCNC) Vol.15, No.3, May 2023
69
REFERENCES
[1] Sand, S.; Dammann, A.; Mensing, C. Positioning in Wireless Communication Systems; John Wiley
& Sons Ltd.: Hoboken, NJ, USA, 2014.
[2] C. Shepard, H. Yu, N. Anand, E. Li, T. Marzetta, R. Yang, and L. Zhong, “Argos: Practical Many-
antenna Base Stations,” in Proc. of the 18th Annual Intl. Conf. on Mobile Computing and
Networking, Aug. 2012, pp. 53–64.
[3] K. Li, R. R. Sharan, Y. Chen, T. Goldstein, J. R. Cavallaro and C. Studer, "Decentralized Baseband
Processing for Massive MU-MIMO Systems," in IEEE Journal on Emerging and Selected Topics in
Circuits and Systems, vol. 7, no. 4, pp. 491-507, Dec. 2017, doi: 10.1109/JETCAS.2017.2775151.
[4] Y. Wang, Z. Shi, Y. Yu, S. Huang and L. Chen, "Enabling Angle-based Positioning to 3GPP NR
Systems," 2019 16th Workshop on Positioning, Navigation and Communications (WPNC), 2019,
pp. 1-7, doi: 10.1109/WPNC47567.2019.8970182.
[5] Marsch, P., & Fettweis, G. (Eds.). Coordinated Multi-Point in Mobile Communications: From
Theory to Practice. 2011. Cambridge: Cambridge University Press.
doi:10.1017/CBO9780511783029
[6] Vladislav Ryzhov, "Robust Outdoor Positioning via Ray Tracing," Computer Science &
Information Technology pp. 149-164, https://doi.org/10.5121/csit.2023.130513.
[7] 3GPP, TR 138 901, Release 14, Study on channel model for frequencies from 0.5 to 100 GHz,
2017-05
[8] 3GPP, TS 38.211, Release 15, Physical channels and modulation, 2018-07
[9] A. W. Mbugua, Y. Chen, L. Raschkowski, L. Thiele, S. Jaeckel and W. Fan, "Review on Ray
Tracing Channel Simulation Accuracy in Sub-6 GHz Outdoor Deployment Scenarios," in IEEE
Open Journal of Antennas and Propagation, vol. 2, pp. 22-37, 2021, doi:
10.1109/OJAP.2020.3041953.
[10] Kong, Fanzeng et al. “A GDOP-Weighted Intersection Method for Ray-Trace Based Target
Localization using AOA Measurements in Quasi-Specular Environment.” (2016).
[11] del Corte Valiente, Antonio & Gómez, José & Gutiérrez-Blanco, Oscar & Castillo-Sequera, Jose.
(2019). Localization Approach Based on Ray-Tracing Simulations and Fingerprinting Techniques
for Indoor–Outdoor Scenarios. Energies. 12. 2943. 10.3390/en12152943.
[12] Tayebi, Abdelhamid et al. “The Application of ray-tracing to mobile localization using the direction
of arrival and received signal strength in multipath indoor environments.” Progress in
Electromagnetics Research-pier 91 (2009): 1-15.
[13] V. Degli-Esposti, F. Fuschini, E. M. Vitucci and G. Falciasecca, "Measurement and Modelling of
Scattering From Buildings," in IEEE Transactions on Antennas and Propagation, vol. 55, no. 1, pp.
143-153, Jan. 2007, doi: 10.1109/TAP.2006.888422.
[14] Recommendation ITU-R P.526.11, Propagation by diffraction, The international telecommunication
union, 10/2009.
[15] T. Fugen, J. Maurer, T. Kayser and W. Wiesbeck, "Verification of 3D Ray-tracing with Non-
Directional and Directional Measurements in Urban Macrocellular Environments," 2006 IEEE 63rd
Vehicular Technology Conference, 2006, pp. 2661-2665, doi: 10.1109/VETECS.2006.1683351.
[16] Fabianowski, Bartosz & Dingliana, John. (2009). Compact BVH Storage for Ray Tracing and
Photon Mapping.
[17] Andrew S. Glassner, James Arvo, David Kirk. Graphics Gems, I, II, III, Academic Press, 1990-
1992.
[18] Daniel Sunday. Practical Geometry Algorithms: with C++ Code, 2021
[19] Möller, Tomas & Trumbore, Ben. (2005). Fast, Minimum Storage Ray-Triangle Intersection.
Journal of Graphics Tools. 2. 10.1145/1198555.1198746.
[20] R. Schmidt, "Multiple emitter location and signal parameter estimation," in IEEE Transactions on
Antennas and Propagation, vol. 34, no. 3, pp. 276-280, March 1986, doi:
10.1109/TAP.1986.1143830.
[21] V. Molodtsov, A. Kureev and E. Khorov, "Experimental Study of Smoothing Modifications of the
MUSIC Algorithm for Direction of Arrival Estimation in Indoor Environments," in IEEE Access,
vol. 9, pp. 153767-153774, 2021, doi: 10.1109/ACCESS.2021.3127861.
[22] Narula, S.C. (1987). The Minimum Sum of Absolute Errors Regression. Journal of Quality
Technology, 19, 37-45.](https://image.slidesharecdn.com/15323cnc04-230621061625-81d2d0c7/85/Enabling-Ray-Tracing-for-5G-19-320.jpg)
![International Journal of Computer Networks & Communications (IJCNC) Vol.15, No.3, May 2023
70
[23] Sposito, V.A., Kennedy, W.J., & Gentle, J.E. (1977). Algorithm AS 110: L p Norm Fit of a Straight
Line. Applied statistics, 26, 114-118.
[24] Service requirements for the 5G system, 3GPP TS 122 261 - V16.14.0
[25] Study on NR positioning support, 3GPP TR 38.855 V1600
[26] Yan, W., Zhang, Q., Zhang, Y., Wang, A., Zhao, C. (2021). The Validation and Performance
Assessment of the Android Smartphone Based GNSS/INS Coupled Navigation System. In: Yang,
C., Xie, J. (eds) China Satellite Navigation Conference (CSNC 2021) Proceedings. Lecture Notes in
Electrical Engineering, vol 772. Springer, Singapore. https://doi.org/10.1007/978-981-16-3138-2_30
[27] Stankovic, Veljko; Haardt, Martin (2008). Generalized Design of Multi-User MIMO Precoding
Matrices. IEEE Transactions on Wireless Communications, 7(3), 953–961.
doi:10.1109/LCOMM.2008.060709
[28] X. Yu, J. -C. Shen, J. Zhang and K. B. Letaief, "Alternating Minimization Algorithms for Hybrid
Precoding in Millimeter Wave MIMO Systems," in IEEE Journal of Selected Topics in Signal
Processing, vol. 10, no. 3, pp. 485-500, April 2016, doi: 10.1109/JSTSP.2016.2523903.
[29] Z. Wang, M. Li, Q. Liu and A. L. Swindlehurst, "Hybrid Precoder and Combiner Design With Low-
Resolution Phase Shifters in mmWave MIMO Systems," in IEEE Journal of Selected Topics in
Signal Processing, vol. 12, no. 2, pp. 256-269, May 2018, doi: 10.1109/JSTSP.2018.2819129.
[30] F. Rottenberg, R. Wang, J. Zhang and A. F. Molisch, "Channel Extrapolation in FDD Massive
MIMO: Theoretical Analysis and Numerical Validation," 2019 IEEE Global Communications
Conference (GLOBECOM), Waikoloa, HI, USA, 2019, pp. 1-7, doi:
10.1109/GLOBECOM38437.2019.9013411.
[31] 3GPP TS 38.104 version 17.5.0 Release 17
[32] 8T8R Antenna Beamforming Technology Introduction, Huawei WP
[33] C. Guo, L. Tian, Z. H. Jiang and W. Hong, "A Self-Calibration Method for 5G Full-Digital TDD
Beamforming Systems Using an Embedded Transmission Line," in IEEE Transactions on Antennas
and Propagation, vol. 69, no. 5, pp. 2648-2659, May 2021, doi: 10.1109/TAP.2020.3030980.
[34] M. Jokinen, O. Kursu, N. Tervo, J. Saloranta, M. E. Leinonen and A. Pärssinen, "Over-the-Air
Phase Measurement and Calibration Method for 5G mmW Phased Array Radio Transceiver," 2019
93rd ARFTG Microwave Measurement Conference (ARFTG), Boston, MA, USA, 2019, pp. 1-4,
doi: 10.1109/ARFTG.2019.8739190.
[35] D. Glamocic and S. Tomasin, "Calibration of mmWave Antenna Arrays for Initial Access in
Massive MIMO 5G Cellular Networks," 2019 IEEE 20th International Workshop on Signal
Processing Advances in Wireless Communications (SPAWC), Cannes, France, 2019, pp. 1-5, doi:
10.1109/SPAWC.2019.8815507.
[36] Cao, Yang & Wang, Pan & Zheng, Kang & Liang, Xianghu & Liu, Dongjie & Lou, Mengting &
Jin, Jing & Wang, Qixing & Wang, Dongming & Huang, Yongming & Xiaohu, You & Wang,
Jiangzhou. (2022). Experimental Performance Evaluation of Cell-free Massive MIMO Systems
Using COTS RRU with OTA Reciprocity Calibration and Phase Synchronization.
AUTHORS
Vladislav Ryzhov is a researcher and developer in the field of LTE/5G. He received B.S.
degree in MIPT in the field of applied mathematics and physics in 2021 and continued his
studies towards M.S. He has an industry experience in Huawei Technologies Co. Ltd. and
Yadro.](https://image.slidesharecdn.com/15323cnc04-230621061625-81d2d0c7/85/Enabling-Ray-Tracing-for-5G-20-320.jpg)