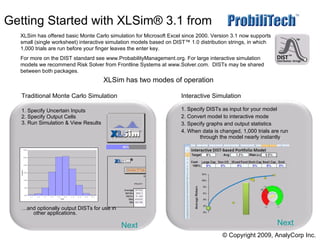
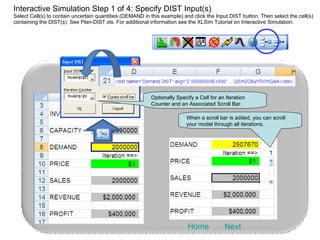
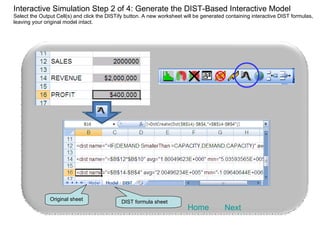
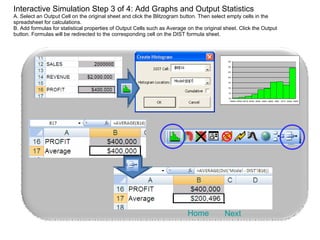
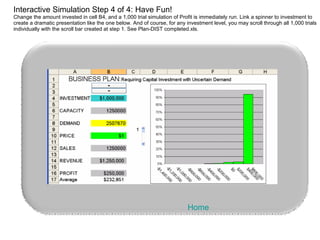
bis 155 week 5 ilab data analysis with spreadsheets with lab,bis 155,bis 155 entire course,bis 155 devry,devry bis 155,bis 155 ilabs,bis 155 exercise, bis 155 final exam,devry bis 155 course project,bis155 week 5 ilab,bis 155 week 5 quiz
Building Positive Employment Relations in India: The Way Forwardchikatisrinu
There has been a persistent and pervasive incidence of poverty, unemployment and social exclusion and the resultant social turbulence all over the developing world even after their following neo-liberal policies. The employment relations and labor market institutions have been undergoing sweeping changes since last two decades all over the world and more particularly in the developing countries like India due to the ongoing globalization and the resultant hyper-competition, rapid technological and product innovations and the ICT revolution. Under the influence of new world order, the employers in India both pub-lic and private sector have resorted to massive restructuring of their businesses in order to gain competitive advantage and to survive and grow in the competitive global markets. This has also resulted in restructuring of their internal labor markets.
Module CSimulationQNT 5160 Data Driven Decision MakingMo.docxgilpinleeanna
Module C
Simulation
QNT 5160
Data Driven Decision Making
Module PowerPoints (rev 1.2)
1
Explain the basic concept of computer simulation.
Describe the role computer simulation plays in many management science studies.
Use RSPE to perform various basic computer simulations.
Interpret the results generated by RSPE when performing a computer simulation.
Describe the characteristics of some of the probability distributions that can be incorporated into a computer simulation when using RSPE.
Use an RSPE procedure that identifies the continuous distribution that best fits historical data.
Use RSPE to generate a parameter analysis report and a trend chart as a aid to decision making.
Module Learning Objectives
Structure the Decision
(Define the Problem)
Select, Build and Run a Model (if applicable)
Gather Information,
Collect Data
Make the Decision
Data Driven Decision Making
Simulation Models
A simulation is an imitation of reality
Simulation models can represent complex and dynamic situations
Many other models are static – they only represent a single point in time
They can “speed up time” to show long-term effects
Stochastic Simulation
“Stochastic” = involving chance or probability
A stochastic simulation can model the uncertain aspects of a decision – to show how uncertain events might affect outcomes
We’ll be using RSPE software to build simulation models
Once a simulation model is set up, we can run experiments to see what might happen in the future … actually for thousands of futures … “in the long run”
Decision
Uncertainty
Consequence
RSPE Input Variables
Simulation Experiments
RSPE Output Variables
Analyzing Risk With Simulation
Risk =~ Uncertainty x Consequence
6
The Essence of Computer Simulation
A stochastic system is a system that evolves over time according to one or more probability distributions.
Computer simulation imitates the operation of such a system by using the corresponding probability distributions to randomly generate the various events that occur in the system.
Rather than literally operating a physical system, the computer just records the occurrences of the simulated events and the resulting performance of the system.
Computer simulation is typically used when the stochastic system involved is too complex to be analyzed satisfactorily by analytical models.
Outline of a Major Computer Simulation Study (1 of 3)
Step 1: Formulate the Problem and Plan the Study
What is the problem that management wants studied?
What are the overall objectives for the study?
What specific issues should be addressed?
What kinds of alternative system configurations should be considered?
What measures of performance of the system are of interest to management?
What are the time constraints for performing the study?
Step 2: Collect the Data and Formulate the Simulation Model
The probability distributions of the relevant quantities are needed.
Generally it will only be possible to estimate these distributio ...
Data > Consolidate provides a way to combine data from two or more ranges of cells into a new range while running one of several functions (such as Sum or Average) on the data. During consolidation, the contents of cells from several sheets can be combined into one place. The effect is that copies of the identified ranges are stacked with their top left corners at the specified result position, and the selected operation is used in each cell to calculate the result value.
Data Analysis
Creating subtotals
Sharing documents
Saving versions
Calc Macros
For sales data analysis, by creating data breakdowns and filters (example by region, product, salesperson, etc). Objective of Easy Pivot is to provide alternative, easier to understand Pivot Table.
This is a presentation by Dada Robert in a Your Skill Boost masterclass organised by the Excellence Foundation for South Sudan (EFSS) on Saturday, the 25th and Sunday, the 26th of May 2024.
He discussed the concept of quality improvement, emphasizing its applicability to various aspects of life, including personal, project, and program improvements. He defined quality as doing the right thing at the right time in the right way to achieve the best possible results and discussed the concept of the "gap" between what we know and what we do, and how this gap represents the areas we need to improve. He explained the scientific approach to quality improvement, which involves systematic performance analysis, testing and learning, and implementing change ideas. He also highlighted the importance of client focus and a team approach to quality improvement.
How to Create Map Views in the Odoo 17 ERPCeline George
The map views are useful for providing a geographical representation of data. They allow users to visualize and analyze the data in a more intuitive manner.
The Roman Empire A Historical Colossus.pdfkaushalkr1407
The Roman Empire, a vast and enduring power, stands as one of history's most remarkable civilizations, leaving an indelible imprint on the world. It emerged from the Roman Republic, transitioning into an imperial powerhouse under the leadership of Augustus Caesar in 27 BCE. This transformation marked the beginning of an era defined by unprecedented territorial expansion, architectural marvels, and profound cultural influence.
The empire's roots lie in the city of Rome, founded, according to legend, by Romulus in 753 BCE. Over centuries, Rome evolved from a small settlement to a formidable republic, characterized by a complex political system with elected officials and checks on power. However, internal strife, class conflicts, and military ambitions paved the way for the end of the Republic. Julius Caesar’s dictatorship and subsequent assassination in 44 BCE created a power vacuum, leading to a civil war. Octavian, later Augustus, emerged victorious, heralding the Roman Empire’s birth.
Under Augustus, the empire experienced the Pax Romana, a 200-year period of relative peace and stability. Augustus reformed the military, established efficient administrative systems, and initiated grand construction projects. The empire's borders expanded, encompassing territories from Britain to Egypt and from Spain to the Euphrates. Roman legions, renowned for their discipline and engineering prowess, secured and maintained these vast territories, building roads, fortifications, and cities that facilitated control and integration.
The Roman Empire’s society was hierarchical, with a rigid class system. At the top were the patricians, wealthy elites who held significant political power. Below them were the plebeians, free citizens with limited political influence, and the vast numbers of slaves who formed the backbone of the economy. The family unit was central, governed by the paterfamilias, the male head who held absolute authority.
Culturally, the Romans were eclectic, absorbing and adapting elements from the civilizations they encountered, particularly the Greeks. Roman art, literature, and philosophy reflected this synthesis, creating a rich cultural tapestry. Latin, the Roman language, became the lingua franca of the Western world, influencing numerous modern languages.
Roman architecture and engineering achievements were monumental. They perfected the arch, vault, and dome, constructing enduring structures like the Colosseum, Pantheon, and aqueducts. These engineering marvels not only showcased Roman ingenuity but also served practical purposes, from public entertainment to water supply.
Welcome to TechSoup New Member Orientation and Q&A (May 2024).pdfTechSoup
In this webinar you will learn how your organization can access TechSoup's wide variety of product discount and donation programs. From hardware to software, we'll give you a tour of the tools available to help your nonprofit with productivity, collaboration, financial management, donor tracking, security, and more.
Ethnobotany and Ethnopharmacology:
Ethnobotany in herbal drug evaluation,
Impact of Ethnobotany in traditional medicine,
New development in herbals,
Bio-prospecting tools for drug discovery,
Role of Ethnopharmacology in drug evaluation,
Reverse Pharmacology.
The French Revolution, which began in 1789, was a period of radical social and political upheaval in France. It marked the decline of absolute monarchies, the rise of secular and democratic republics, and the eventual rise of Napoleon Bonaparte. This revolutionary period is crucial in understanding the transition from feudalism to modernity in Europe.
For more information, visit-www.vavaclasses.com
How to Split Bills in the Odoo 17 POS ModuleCeline George
Bills have a main role in point of sale procedure. It will help to track sales, handling payments and giving receipts to customers. Bill splitting also has an important role in POS. For example, If some friends come together for dinner and if they want to divide the bill then it is possible by POS bill splitting. This slide will show how to split bills in odoo 17 POS.
2. Traditional Monte Carlo Step 1 of 3: Specify Input Distribution from Function Dialog See Plan-Traditional MC.xls. For additional information see the XLSim Tutorial on Traditional Simulation. Next Home
3. Traditional Monte Carlo Step 2 of 3: Specify Output Cell Next Home Optionally Specify DIST Output
5. Interactive Simulation Step 1 of 4: Specify DIST Input(s) Select Cell(s) to contain uncertain quantities (DEMAND in this example) and click the Input DIST button. Then select the cell(s) containing the DIST(s). See Plan-DIST.xls. For additional information see the XLSim Tutorial on Interactive Simulation. Next Home When a scroll bar is added, you can scroll your model through all iterations. Optionally Specify a Cell for an Iteration Counter and an Associated Scroll Bar.
6. Interactive Simulation Step 2 of 4: Generate the DIST-Based Interactive Model Select the Output Cell(s) and click the DISTify button. A new worksheet will be generated containing interactive DIST formulas, leaving your original model intact. Next Home DIST formula sheet Original sheet
7. Interactive Simulation Step 3 of 4: Add Graphs and Output Statistics A. Select an Output Cell on the original sheet and click the Blitzogram button. Then select empty cells in the spreadsheet for calculations. B. Add formulas for statistical properties of Output Cells such as Average on the original sheet. Click the Output button. Formulas will be redirected to the corresponding cell on the DIST formula sheet. Next Home
8. Interactive Simulation Step 4 of 4: Have Fun! Change the amount invested in cell B4, and a 1,000 trial simulation of Profit is immediately run. Link a spinner to investment to create a dramatic presentation like the one below. And of course, for any investment level, you may scroll through all 1,000 trials individually with the scroll bar created at step 1. See Plan-DIST completed.xls. Home