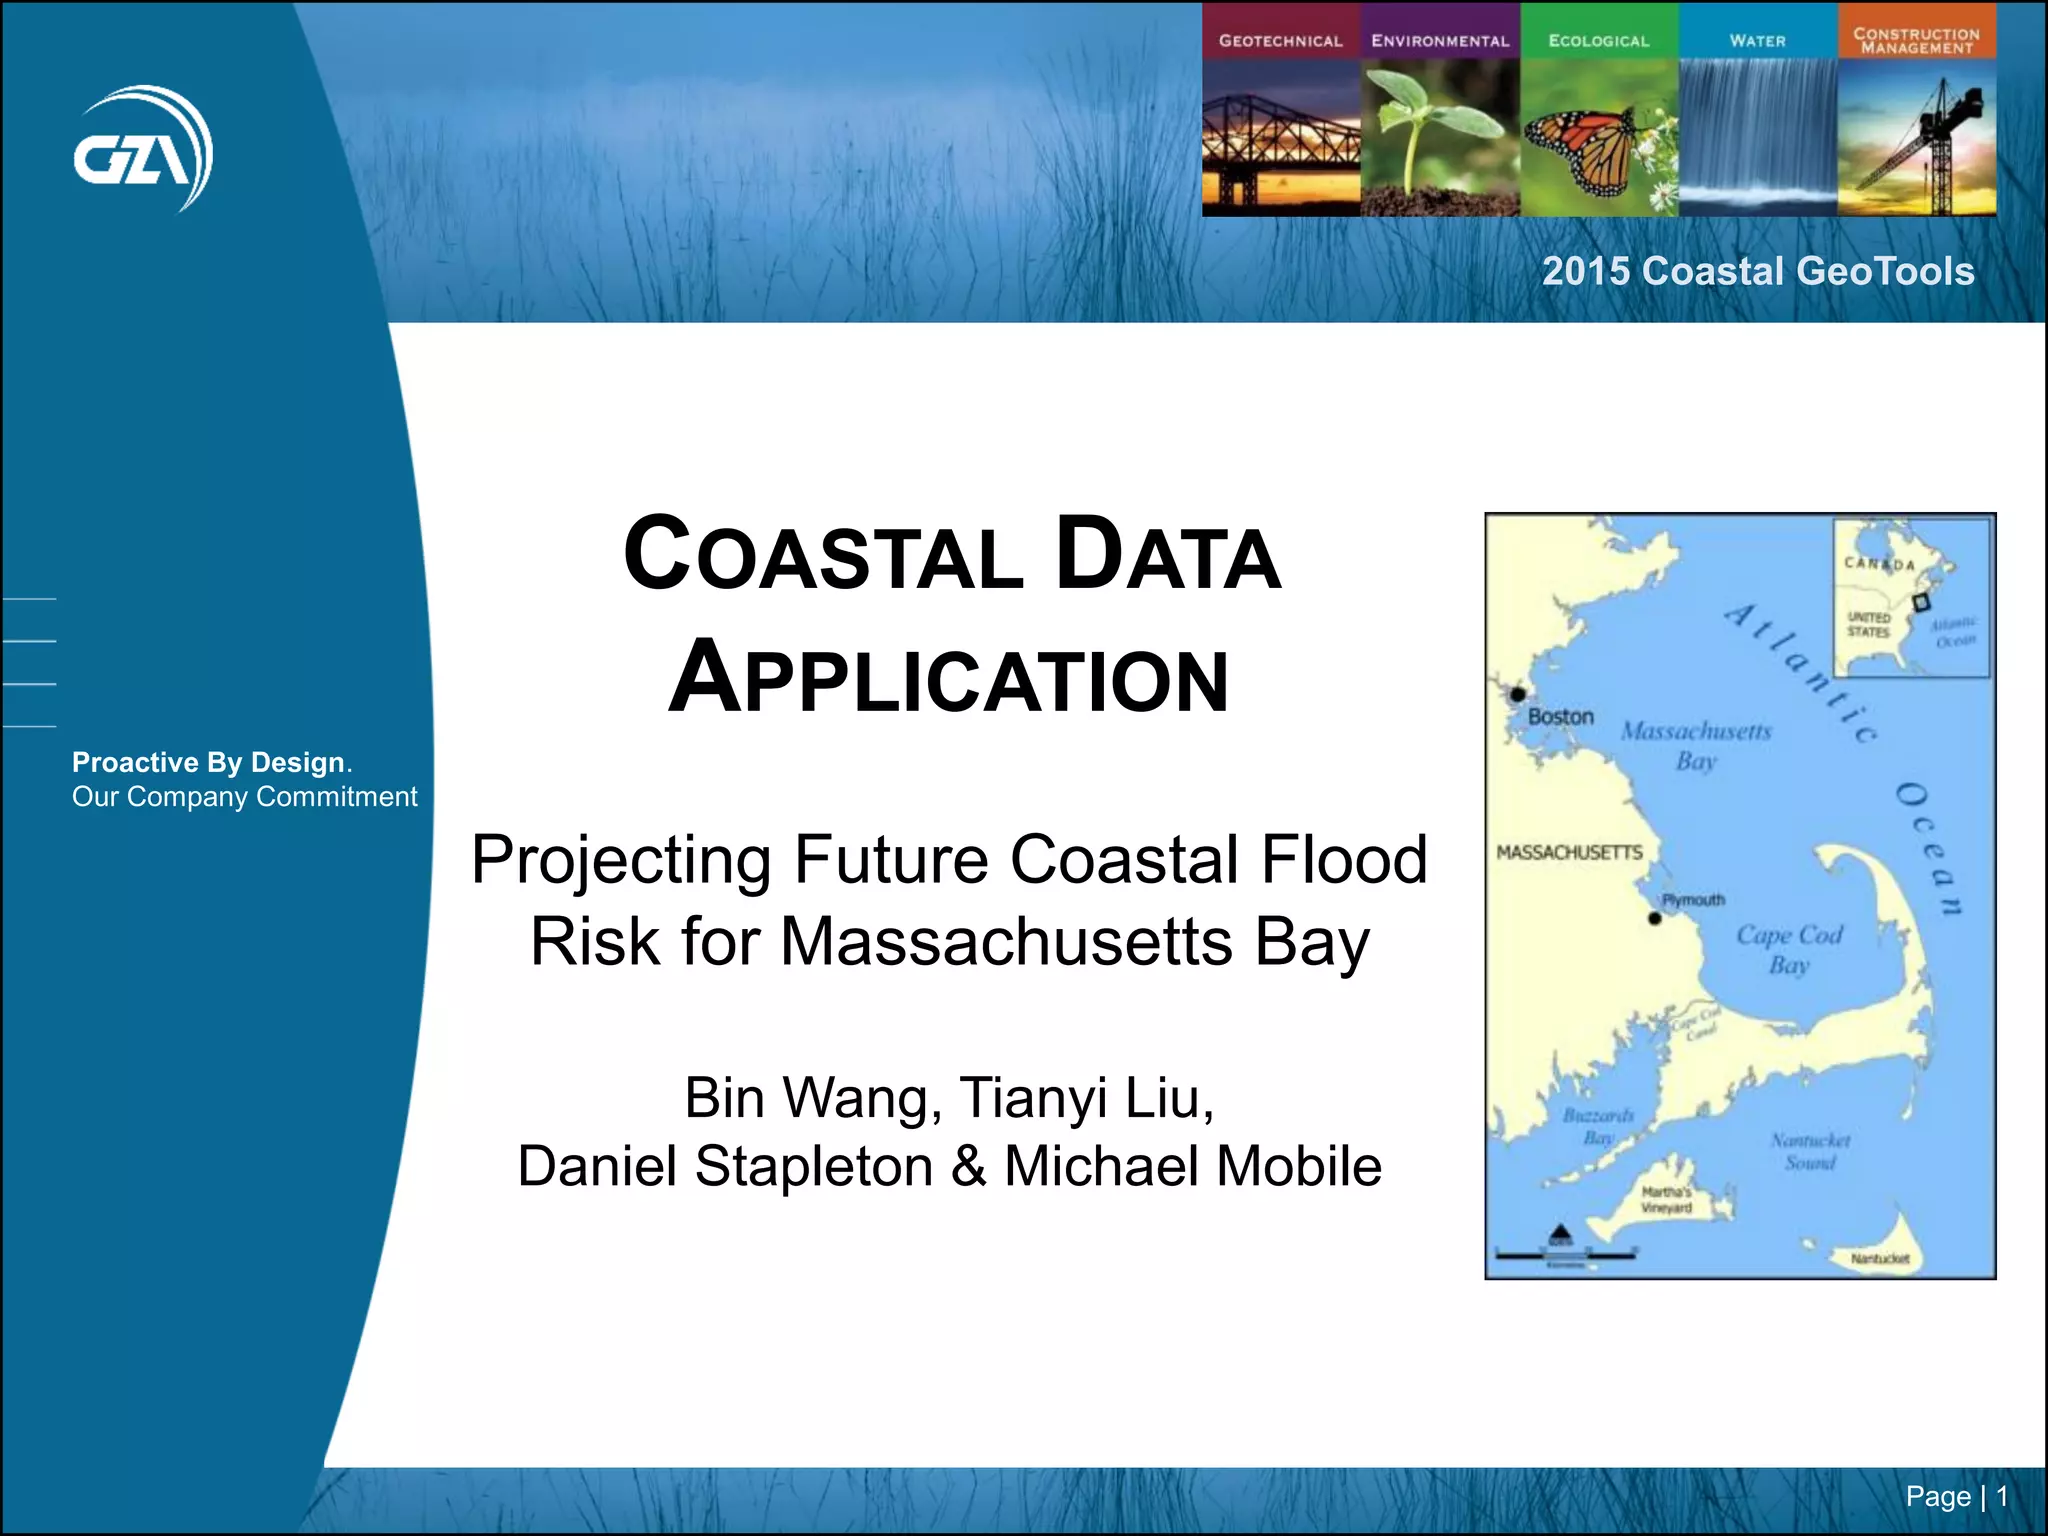
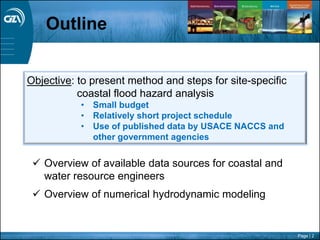
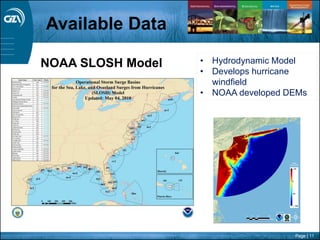
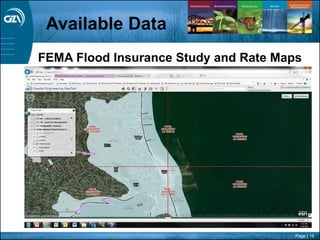
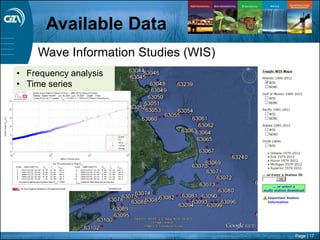
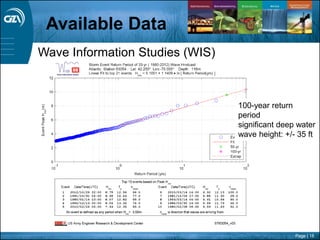
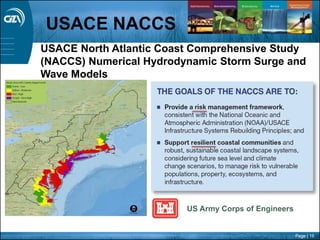
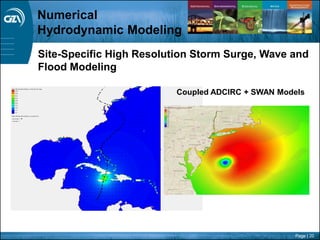
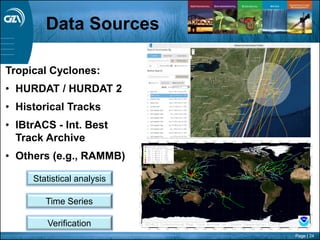
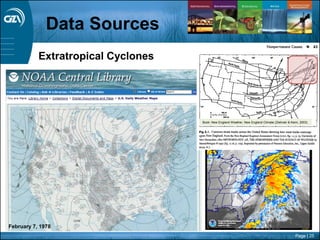
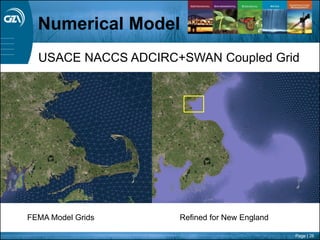
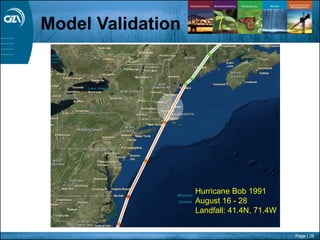
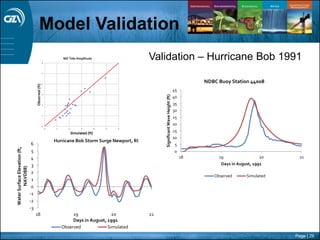
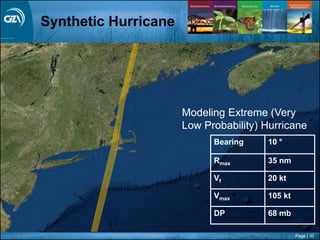
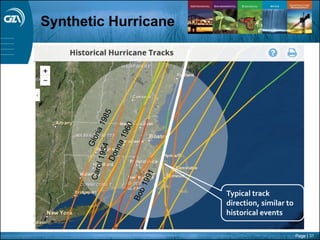
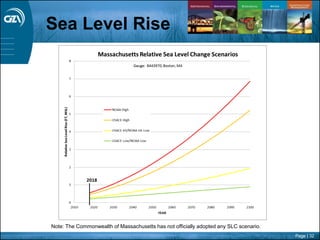
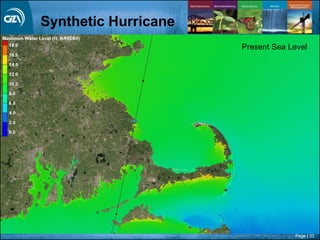
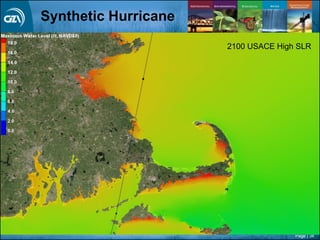
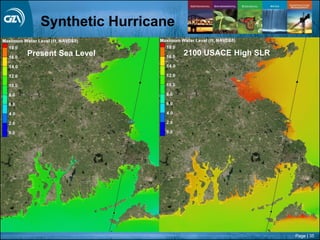
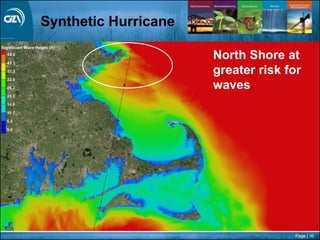
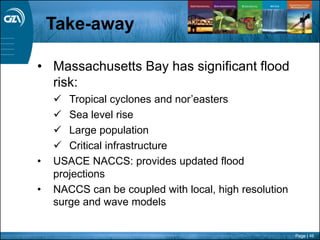
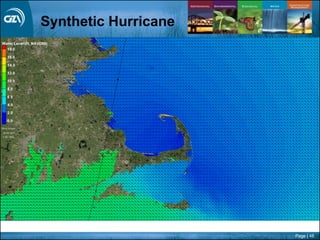
SlideShare a Scribd company logo
1 of 48
Download to read offline
Page | 1
Proactive By Design.
Our Company Commitment
COASTAL DATA
APPLICATION
Projecting Future Coastal Flood
Risk for Massachusetts Bay
Bin Wang, Tianyi Liu,
Daniel Stapleton & Michael Mobile
2015 Coastal GeoTools
Page | 2
 Overview of available data sources for coastal and
water resource engineers
 Overview of numerical hydrodynamic modeling
Outline
Objective: to present method and steps for site-specific
coastal flood hazard analysis
• Small budget
• Relatively short project schedule
• Use of published data by USACE NACCS and
other government agencies
Page | 3
Background
Coastal Flooding
Erosion
Flood Damage Structural Damage
Page | 4
Background
Need to identify/quantify flood hazards:
 stillwater elevations
 wave action
 environmental loads
 shoreline and nearshore response
To achieve coastal resiliency:
 critical infrastructure
 communities
 biohabitats
 natural resources
Coastal Resiliency
Page | 5
Massachusetts Bay &
Cape Cod Bay
• Total Number of Cities/Towns = 53
• Population = 1.90 M (2010 Census)
• Historical Coastal Towns
Background
Page | 6
Massachusetts Bay
Coastal Flood
Hazard
Background
“Nor-Easters”
Page | 7
Hurricanes
Background
Massachusetts Bay
Coastal Flood
Hazard
Page | 8
Available Data
South Shore Coastal Geomorphology: Beaches, Estuaries, Marsh,
Structures
GZA Coastal Engineering GeoTool
Page | 9
Available Data
South Shore Coastal Geomorphology: Shoreline Change
Page | 10
Available Data
North Shore Coastal Geomorphology: Beaches, Estuaries, Rocky
Shore, Scarps, Structures
Page | 11
NOAA SLOSH Model • Hydrodynamic Model
• Develops hurricane
windfield
• NOAA developed DEMs
Available Data
Page | 12
Available Data
Page | 13
NOAA/NOS/CO-OPS Tide Gages
• Observed water levels, e.g., time series
for model validation/verification; extreme
value analysis; empirical simulation
technique (EST);
• Predicted tides and tidal constituents;
• Datum conversions (w/ Vdatum);
• Sea level trend
Available Data
Page | 14
NOAA/NOS/CO-OPS 8443970: Boston Harbor
5
6
7
8
9
10
11
12
1 10 100 1,000
StillwaterElevation(feet,NAVD88)
Return Period (Years)
Observed Annual Maximum - Original Tide Data (ft, NAVD88) Observed Annual Maximum Adjusted w/ Sea Level Rise
Calculated Stage-Frequency Curve w/ Original Tide Data Calculated Stage-Frequency Curve w/ Sea Level Rise-Adjusted Tide Data
Hingham Harbor (FEMA 2012)
Generalized
Extreme
Value (GEV)
Available Data
Page | 15
Available Data
FEMA Flood Insurance Study and Rate Maps
Page | 16
Available Data
FEMA Flood Insurance Study and Rate Maps
Page | 17
Wave Information Studies (WIS)
• Frequency analysis
• Time series
Available Data
Page | 18
Wave Information Studies (WIS)
100-year return
period
significant deep water
wave height: +/- 35 ft
Available Data
Page | 19
USACE North Atlantic Coast Comprehensive Study
(NACCS) Numerical Hydrodynamic Storm Surge and
Wave Models
USACE NACCS
Page | 20
Site-Specific High Resolution Storm Surge, Wave and
Flood Modeling
Coupled ADCIRC + SWAN Models
Numerical
Hydrodynamic Modeling
Page | 21
• NOAA or State GIS topographic &
hydrographic data layers (DEM)
• National or state land cover database
• NOAA COOPS tide gages – water levels
and other data;
• USACE Wave Information System (WIS)
– wave & wind gages
• National Climate Data Center - ground
climate/weather stations
• NHC Hurricane Re-analysis project – best
track data
• Other (e.g., USGS stream gage data)
Model inputs
and calibration
Model construction
Data Sources
Page | 22
U.S. Coastal Relief Model (30-m)LiDAR Terrain Data (2009 Boston @ 1-m)
Note: datum conversions & units
Data Sources
Page | 23
Land Use – building nodal attributes, Manning’s friction
values, surface roughness coefficients …
Data Sources
State: MassGIS LU2005 National: NLCD 2011 (v.2014)
Page | 24
Tropical Cyclones:
• HURDAT / HURDAT 2
• Historical Tracks
• IBtrACS - Int. Best
Track Archive
• Others (e.g., RAMMB)
Data Sources
Time Series
Verification
Statistical analysis
Page | 25
Extratropical Cyclones
Data Sources
Book: New England Weather, New England Climate (Zielinski & Keim, 2003)
February 7, 1978
Page | 26
USACE NACCS ADCIRC+SWAN Coupled Grid
Numerical Model
FEMA Model Grids Refined for New England
Page | 27
GZA High Resolution, Locally-Refined ADCIRC+SWAN
Coupled Grid
GZA High
Resolution Local Model
FEMA Region II Refined for Southern New England
Page | 28
Model Validation
Hurricane Bob 1991
August 16 - 28
Landfall: 41.4N, 71.4W
Page | 29
Validation – Hurricane Bob 1991
Model Validation
0
5
10
15
20
25
30
35
40
45
18 19 20 21
SignificantWaveHeight(ft)
Days in August, 1991
NDBC Buoy Station 44008
Observed Simulated
-3
-2
-1
0
1
2
3
4
5
6
18 19 20 21
WaterSurfaceElevation(ft,
NAVD88)
Days in August, 1991
Hurricane Bob Storm Surge Newport, RI
Observed Simulated
Page | 30
Bearing 10 °
Rmax 35 nm
Vf 20 kt
Vmax 105 kt
DP 68 mb
Modeling Extreme (Very
Low Probability) Hurricane
Synthetic Hurricane
Page | 31
Typical track
direction, similar to
historical events
Synthetic Hurricane
Page | 32
Sea Level Rise
Note: The Commonwealth of Massachusetts has not officially adopted any SLC scenario.
Page | 33
Synthetic Hurricane
Present Sea Level
Page | 34
Synthetic Hurricane
2100 USACE High SLR
Page | 35
Synthetic Hurricane
Present Sea Level 2100 USACE High SLR
Page | 36
North Shore at
greater risk for
waves
Synthetic Hurricane
Page | 37
1
2
3
4
5 -10
-5
0
5
10
15
0 1 2 3 4
ADCIRC+SWANCalculated
WL(ft,NAVD88)
Simulation Time (days)
Station 1 - Salem
Station 3 - Boston
Station 5 - Scituate
Peak storm tide
• varies in space
• synchronized
• Boston at greater risk
Synthetic Hurricane
Page | 38
Impact of
Sea Level Rise
Peak Storm Tides for Selected Sea Level Scenarios
0
2
4
6
8
10
12
14
16
18
Salem Revere Boston Quincy Scituate
CalculatedStillwaterLevel(ft,
NAVD88)
Present
SLR Int.
SLR High
North South
Page | 39
- Slightly nonlinear storm tide response to sea level rise;
- For non-extreme cases, approximation by linear superposition;
- For more extreme cases, numerical modeling needed
1.5
1.6
1.7
1.8
Salem Revere Boston Quincy Scituate
CalculatedStillwaterLevel
Increase(ft)
SLR Int. - Present
Input SLR Int.
4.8
4.9
5.0
5.1
Salem Revere Boston Quincy Scituate
CalculatedStillwaterLevel
Increase(ft)
SLR High - Present
Input SLR High
Impact of
Sea Level Rise
Page | 40
USACE NACCS Data Output “Save” Points
Comparison with
USACE NACCS
Page | 41
3
6
9
12
15
1 10 100 1,000 10,000
StillwaterElevation(feet,
NAVD88)
Return Period (Years)
Observed Annual Maximum Adjusted w/ Sea Level Rise Calculated Stage-Frequency Curve w/ Sea Level Rise-Adjusted Tide Data
Hingham Harbor (FEMA 2012) NACCS Boston Harbor MT
NACCS Boston Harbor HT
NOAA/NOS/CO-OPS 8443970: Boston Harbor; NACCS-
predicted flood-frequency curve
Comparison with
USACE NACCS
MT ~ HT
Page | 42
Overland Wave Inundation:
CEDAS: ACES Module
Applying Model
Output
Page | 43
Flood Inundation Models
Hydrodynamic Loads on
Protective Barrier
Maximum Flow Depth
(ft)
1.9
MaximumVelocity (ft/s) 1.7
Impact Force (pounds)
per linear feet
7.7
Applying Model
Output
Page | 44
Estuary Circulation; sediment
transport
Applying Model
Output
Shoreline Processes
Beach Erosion
Page | 45
Applying Model
Output
Resiliency Design
Page | 46
Take-away
• Massachusetts Bay has significant flood
risk:
 Tropical cyclones and nor’easters
 Sea level rise
 Large population
 Critical infrastructure
• USACE NACCS: provides updated flood
projections
• NACCS can be coupled with local, high resolution
surge and wave models
Page | 47
Bin Wang, P.E.
Technical Specialist
Norwood, MA
781-278-5809
Bin.Wang@gza.com
Daniel C. Stapleton, P.E.
Principal
Norwood, MA 02062
781-278-5743
Daniel.Stapleton@gza.com
Tianyi Liu, Ph.D.
Coastal Engineer Specialist
Norwood, MA
781-278-3819
Tianyi.Liu@gza.com
Michael A. Mobile, Ph.D.
Technical Specialist
Bedford, NH
603-232-8738
Michael.Mobile@gza.com
Thank You!
Page | 48
Synthetic Hurricane

More Related Content

What's hot

Taurus Libra North Idku - slope channel 3D seismic modelling, Egypt
Taurus Libra North Idku - slope channel 3D seismic modelling, EgyptTaurus Libra North Idku - slope channel 3D seismic modelling, Egypt
Taurus Libra North Idku - slope channel 3D seismic modelling, EgyptRichard Vaughan
 
2016Spring_WC_WiseDisasters_Presentation_FD
2016Spring_WC_WiseDisasters_Presentation_FD2016Spring_WC_WiseDisasters_Presentation_FD
2016Spring_WC_WiseDisasters_Presentation_FDAbhijeet Baghel
 
2014 04 emerald siggery
2014   04 emerald siggery2014   04 emerald siggery
2014 04 emerald siggerySevernEstuary
 
DSD-INT 2016 The SFR-package in iMOD to support large-scale groundwater flow ...
DSD-INT 2016 The SFR-package in iMOD to support large-scale groundwater flow ...DSD-INT 2016 The SFR-package in iMOD to support large-scale groundwater flow ...
DSD-INT 2016 The SFR-package in iMOD to support large-scale groundwater flow ...Deltares
 
Drinkwater ice sheet symposium - tu delft climate inst., 17 oct 2013(1)
Drinkwater  ice sheet symposium - tu delft climate inst., 17 oct 2013(1)Drinkwater  ice sheet symposium - tu delft climate inst., 17 oct 2013(1)
Drinkwater ice sheet symposium - tu delft climate inst., 17 oct 2013(1)TU Delft Climate Institute
 
DSD-INT 2017 Pre-processing of forcing data for usage in a gridded model of t...
DSD-INT 2017 Pre-processing of forcing data for usage in a gridded model of t...DSD-INT 2017 Pre-processing of forcing data for usage in a gridded model of t...
DSD-INT 2017 Pre-processing of forcing data for usage in a gridded model of t...Deltares
 
TGS GPS- Labrador Interpretation
TGS GPS- Labrador Interpretation TGS GPS- Labrador Interpretation
TGS GPS- Labrador Interpretation TGS
 
DSD-INT 2017 Infragravity Period Oscillations In A Channel Harbor Near A Rive...
DSD-INT 2017 Infragravity Period Oscillations In A Channel Harbor Near A Rive...DSD-INT 2017 Infragravity Period Oscillations In A Channel Harbor Near A Rive...
DSD-INT 2017 Infragravity Period Oscillations In A Channel Harbor Near A Rive...Deltares
 
DSD-INT 2016 Hydrodynamic modeling and resource-device suitability analysis o...
DSD-INT 2016 Hydrodynamic modeling and resource-device suitability analysis o...DSD-INT 2016 Hydrodynamic modeling and resource-device suitability analysis o...
DSD-INT 2016 Hydrodynamic modeling and resource-device suitability analysis o...Deltares
 
DSD-INT 2017 Planetary-scale surface water detection from space - Donchyts
DSD-INT 2017  Planetary-scale surface water detection from space - DonchytsDSD-INT 2017  Planetary-scale surface water detection from space - Donchyts
DSD-INT 2017 Planetary-scale surface water detection from space - DonchytsDeltares
 
DSD-INT 2016 Integrating information sources for inland waters modelling - Ba...
DSD-INT 2016 Integrating information sources for inland waters modelling - Ba...DSD-INT 2016 Integrating information sources for inland waters modelling - Ba...
DSD-INT 2016 Integrating information sources for inland waters modelling - Ba...Deltares
 
IUKWC Workshop Nov16: Developing Hydro-climatic Services for Water Security –...
IUKWC Workshop Nov16: Developing Hydro-climatic Services for Water Security –...IUKWC Workshop Nov16: Developing Hydro-climatic Services for Water Security –...
IUKWC Workshop Nov16: Developing Hydro-climatic Services for Water Security –...India UK Water Centre (IUKWC)
 
On the channel head location using DEM
On the channel head location using DEMOn the channel head location using DEM
On the channel head location using DEMLia Romano
 
DBCP monthly report (July 2016
DBCP monthly report (July 2016DBCP monthly report (July 2016
DBCP monthly report (July 2016JCOMMOPS
 
TH3.L10.1: THE NASA SOIL MOISTURE ACTIVE PASSIVE (SMAP) MISSION: OVERVIEW
TH3.L10.1: THE NASA SOIL MOISTURE ACTIVE PASSIVE (SMAP) MISSION: OVERVIEWTH3.L10.1: THE NASA SOIL MOISTURE ACTIVE PASSIVE (SMAP) MISSION: OVERVIEW
TH3.L10.1: THE NASA SOIL MOISTURE ACTIVE PASSIVE (SMAP) MISSION: OVERVIEWgrssieee
 

What's hot (20)

Taurus Libra North Idku - slope channel 3D seismic modelling, Egypt
Taurus Libra North Idku - slope channel 3D seismic modelling, EgyptTaurus Libra North Idku - slope channel 3D seismic modelling, Egypt
Taurus Libra North Idku - slope channel 3D seismic modelling, Egypt
 
2016Spring_WC_WiseDisasters_Presentation_FD
2016Spring_WC_WiseDisasters_Presentation_FD2016Spring_WC_WiseDisasters_Presentation_FD
2016Spring_WC_WiseDisasters_Presentation_FD
 
2014 04 emerald siggery
2014   04 emerald siggery2014   04 emerald siggery
2014 04 emerald siggery
 
Pre-Injection Assessment of Time-Lapse Seismic Repeatability at the Aquistore...
Pre-Injection Assessment of Time-Lapse Seismic Repeatability at the Aquistore...Pre-Injection Assessment of Time-Lapse Seismic Repeatability at the Aquistore...
Pre-Injection Assessment of Time-Lapse Seismic Repeatability at the Aquistore...
 
DSD-INT 2016 The SFR-package in iMOD to support large-scale groundwater flow ...
DSD-INT 2016 The SFR-package in iMOD to support large-scale groundwater flow ...DSD-INT 2016 The SFR-package in iMOD to support large-scale groundwater flow ...
DSD-INT 2016 The SFR-package in iMOD to support large-scale groundwater flow ...
 
Miren sympo17oct13
Miren sympo17oct13Miren sympo17oct13
Miren sympo17oct13
 
Drinkwater ice sheet symposium - tu delft climate inst., 17 oct 2013(1)
Drinkwater  ice sheet symposium - tu delft climate inst., 17 oct 2013(1)Drinkwater  ice sheet symposium - tu delft climate inst., 17 oct 2013(1)
Drinkwater ice sheet symposium - tu delft climate inst., 17 oct 2013(1)
 
2013.10.17 ice sheet-symposium_ditmar
2013.10.17 ice sheet-symposium_ditmar2013.10.17 ice sheet-symposium_ditmar
2013.10.17 ice sheet-symposium_ditmar
 
DSD-INT 2017 Pre-processing of forcing data for usage in a gridded model of t...
DSD-INT 2017 Pre-processing of forcing data for usage in a gridded model of t...DSD-INT 2017 Pre-processing of forcing data for usage in a gridded model of t...
DSD-INT 2017 Pre-processing of forcing data for usage in a gridded model of t...
 
TGS GPS- Labrador Interpretation
TGS GPS- Labrador Interpretation TGS GPS- Labrador Interpretation
TGS GPS- Labrador Interpretation
 
DSD-INT 2017 Infragravity Period Oscillations In A Channel Harbor Near A Rive...
DSD-INT 2017 Infragravity Period Oscillations In A Channel Harbor Near A Rive...DSD-INT 2017 Infragravity Period Oscillations In A Channel Harbor Near A Rive...
DSD-INT 2017 Infragravity Period Oscillations In A Channel Harbor Near A Rive...
 
Flood Forecasting - Peter Gibbs
Flood Forecasting - Peter GibbsFlood Forecasting - Peter Gibbs
Flood Forecasting - Peter Gibbs
 
DSD-INT 2016 Hydrodynamic modeling and resource-device suitability analysis o...
DSD-INT 2016 Hydrodynamic modeling and resource-device suitability analysis o...DSD-INT 2016 Hydrodynamic modeling and resource-device suitability analysis o...
DSD-INT 2016 Hydrodynamic modeling and resource-device suitability analysis o...
 
DSD-INT 2017 Planetary-scale surface water detection from space - Donchyts
DSD-INT 2017  Planetary-scale surface water detection from space - DonchytsDSD-INT 2017  Planetary-scale surface water detection from space - Donchyts
DSD-INT 2017 Planetary-scale surface water detection from space - Donchyts
 
DSD-INT 2016 Integrating information sources for inland waters modelling - Ba...
DSD-INT 2016 Integrating information sources for inland waters modelling - Ba...DSD-INT 2016 Integrating information sources for inland waters modelling - Ba...
DSD-INT 2016 Integrating information sources for inland waters modelling - Ba...
 
IUKWC Workshop Nov16: Developing Hydro-climatic Services for Water Security –...
IUKWC Workshop Nov16: Developing Hydro-climatic Services for Water Security –...IUKWC Workshop Nov16: Developing Hydro-climatic Services for Water Security –...
IUKWC Workshop Nov16: Developing Hydro-climatic Services for Water Security –...
 
On the channel head location using DEM
On the channel head location using DEMOn the channel head location using DEM
On the channel head location using DEM
 
Extending rhem from hillslopes to watersheds
Extending rhem from hillslopes to watershedsExtending rhem from hillslopes to watersheds
Extending rhem from hillslopes to watersheds
 
DBCP monthly report (July 2016
DBCP monthly report (July 2016DBCP monthly report (July 2016
DBCP monthly report (July 2016
 
TH3.L10.1: THE NASA SOIL MOISTURE ACTIVE PASSIVE (SMAP) MISSION: OVERVIEW
TH3.L10.1: THE NASA SOIL MOISTURE ACTIVE PASSIVE (SMAP) MISSION: OVERVIEWTH3.L10.1: THE NASA SOIL MOISTURE ACTIVE PASSIVE (SMAP) MISSION: OVERVIEW
TH3.L10.1: THE NASA SOIL MOISTURE ACTIVE PASSIVE (SMAP) MISSION: OVERVIEW
 

Viewers also liked

Tuvalu Key Questions
Tuvalu Key QuestionsTuvalu Key Questions
Tuvalu Key Questionstonybattista
 
Sea Level Rising
Sea Level RisingSea Level Rising
Sea Level RisingMihex
 
Sea Level Rise and Disappearing Islands: Myth or Reality?
Sea Level Rise and Disappearing Islands: Myth or Reality?Sea Level Rise and Disappearing Islands: Myth or Reality?
Sea Level Rise and Disappearing Islands: Myth or Reality?Greg Briner
 
47004 global issues_presentation_1
47004 global issues_presentation_147004 global issues_presentation_1
47004 global issues_presentation_1shaista_khurshid
 
Rising Sea Levels
Rising Sea LevelsRising Sea Levels
Rising Sea LevelsTom McLean
 

Viewers also liked (7)

Tuvalu Key Questions
Tuvalu Key QuestionsTuvalu Key Questions
Tuvalu Key Questions
 
Pasapalabra catedral
Pasapalabra catedralPasapalabra catedral
Pasapalabra catedral
 
Climate Change
Climate ChangeClimate Change
Climate Change
 
Sea Level Rising
Sea Level RisingSea Level Rising
Sea Level Rising
 
Sea Level Rise and Disappearing Islands: Myth or Reality?
Sea Level Rise and Disappearing Islands: Myth or Reality?Sea Level Rise and Disappearing Islands: Myth or Reality?
Sea Level Rise and Disappearing Islands: Myth or Reality?
 
47004 global issues_presentation_1
47004 global issues_presentation_147004 global issues_presentation_1
47004 global issues_presentation_1
 
Rising Sea Levels
Rising Sea LevelsRising Sea Levels
Rising Sea Levels
 

Similar to GeoTool_2015_Coastal_Data_Application_BWang_Final

ASFPM_2015_Atlanta_Presentation_BWang
ASFPM_2015_Atlanta_Presentation_BWangASFPM_2015_Atlanta_Presentation_BWang
ASFPM_2015_Atlanta_Presentation_BWangBin Wang
 
Sea level rise and storm surge tools and datasets supporting Municipal Resili...
Sea level rise and storm surge tools and datasets supporting Municipal Resili...Sea level rise and storm surge tools and datasets supporting Municipal Resili...
Sea level rise and storm surge tools and datasets supporting Municipal Resili...GrowSmart Maine
 
Visions for a Flood Resilient Waterfront: Examples from the Kingston Floodin...
Visions for a Flood Resilient Waterfront: Examples from the Kingston Floodin...Visions for a Flood Resilient Waterfront: Examples from the Kingston Floodin...
Visions for a Flood Resilient Waterfront: Examples from the Kingston Floodin...Libby Zemaitis
 
Visions for a flood resilient waterfront: examples from the Kingston Flooding...
Visions for a flood resilient waterfront: examples from the Kingston Flooding...Visions for a flood resilient waterfront: examples from the Kingston Flooding...
Visions for a flood resilient waterfront: examples from the Kingston Flooding...Climate Resilience in the Hudson Valley
 
Development of a Flood Warning Tool Set for Bandera, Texas - Doug Schnoebelen
Development of a Flood Warning Tool Set for Bandera, Texas - Doug SchnoebelenDevelopment of a Flood Warning Tool Set for Bandera, Texas - Doug Schnoebelen
Development of a Flood Warning Tool Set for Bandera, Texas - Doug SchnoebelenTWCA
 
Projected Climate Change Impacts for Rhode Island’s Coast: A Summary of the S...
Projected Climate Change Impacts for Rhode Island’s Coast: A Summary of the S...Projected Climate Change Impacts for Rhode Island’s Coast: A Summary of the S...
Projected Climate Change Impacts for Rhode Island’s Coast: A Summary of the S...riseagrant
 
An Introduction to the Environment Agency extreme offshore wave, water level ...
An Introduction to the Environment Agency extreme offshore wave, water level ...An Introduction to the Environment Agency extreme offshore wave, water level ...
An Introduction to the Environment Agency extreme offshore wave, water level ...Stephen Flood
 
Beach slopes from satellite-derived shorelines [Coast2Coast presentation]
Beach slopes from satellite-derived shorelines [Coast2Coast presentation]Beach slopes from satellite-derived shorelines [Coast2Coast presentation]
Beach slopes from satellite-derived shorelines [Coast2Coast presentation]Kilian Vos
 
City of Miami Beach SWMMP Presentation August17 2012-1
City of Miami Beach SWMMP Presentation August17 2012-1City of Miami Beach SWMMP Presentation August17 2012-1
City of Miami Beach SWMMP Presentation August17 2012-1Fernando Vazquez, P.E.
 
Presentation: Unit 1 Introduction to the hydrological cycle
Presentation: Unit 1 Introduction to the hydrological cyclePresentation: Unit 1 Introduction to the hydrological cycle
Presentation: Unit 1 Introduction to the hydrological cycleSERC at Carleton College
 
What You Need to Know About NOAA Atlas 14, Gregory Waller - National Oceanic ...
What You Need to Know About NOAA Atlas 14, Gregory Waller - National Oceanic ...What You Need to Know About NOAA Atlas 14, Gregory Waller - National Oceanic ...
What You Need to Know About NOAA Atlas 14, Gregory Waller - National Oceanic ...TWCA
 
Nichi.11 12-13.nasa.cynthia rosenzweig
Nichi.11 12-13.nasa.cynthia rosenzweigNichi.11 12-13.nasa.cynthia rosenzweig
Nichi.11 12-13.nasa.cynthia rosenzweigNICHI_USA
 
Introduction to USGS Arizona Program and Hydrology (Hoffman)
Introduction to USGS Arizona Program and Hydrology (Hoffman)Introduction to USGS Arizona Program and Hydrology (Hoffman)
Introduction to USGS Arizona Program and Hydrology (Hoffman)Iwl Pcu
 
The History of Coastal Flood Hazard Assessments in the Great Lakes
The History of Coastal Flood Hazard Assessments in the Great LakesThe History of Coastal Flood Hazard Assessments in the Great Lakes
The History of Coastal Flood Hazard Assessments in the Great LakesDaryl Shepard
 
ASFPM 2016: The History of Coastal Flood Hazard Assessments in the Great Lakes
ASFPM 2016: The History of Coastal Flood Hazard Assessments in the Great LakesASFPM 2016: The History of Coastal Flood Hazard Assessments in the Great Lakes
ASFPM 2016: The History of Coastal Flood Hazard Assessments in the Great LakesCDM Smith
 
Developing a Model to Validate the Use of Landsat and MODIS Data to Monitor C...
Developing a Model to Validate the Use of Landsat and MODIS Data to Monitor C...Developing a Model to Validate the Use of Landsat and MODIS Data to Monitor C...
Developing a Model to Validate the Use of Landsat and MODIS Data to Monitor C...daileya
 
vdatum_webinar_lesson information2013.pdf
vdatum_webinar_lesson information2013.pdfvdatum_webinar_lesson information2013.pdf
vdatum_webinar_lesson information2013.pdfkmarticio9
 
Modelling extreme conditions for wave overtopping at Weymouth - Oliver Way (H...
Modelling extreme conditions for wave overtopping at Weymouth - Oliver Way (H...Modelling extreme conditions for wave overtopping at Weymouth - Oliver Way (H...
Modelling extreme conditions for wave overtopping at Weymouth - Oliver Way (H...Stephen Flood
 
Coastal Landcover Trends & Applications in the NW
Coastal Landcover Trends & Applications in the NWCoastal Landcover Trends & Applications in the NW
Coastal Landcover Trends & Applications in the NWEric Morris
 

Similar to GeoTool_2015_Coastal_Data_Application_BWang_Final (20)

ASFPM_2015_Atlanta_Presentation_BWang
ASFPM_2015_Atlanta_Presentation_BWangASFPM_2015_Atlanta_Presentation_BWang
ASFPM_2015_Atlanta_Presentation_BWang
 
Sea level rise and storm surge tools and datasets supporting Municipal Resili...
Sea level rise and storm surge tools and datasets supporting Municipal Resili...Sea level rise and storm surge tools and datasets supporting Municipal Resili...
Sea level rise and storm surge tools and datasets supporting Municipal Resili...
 
Visions for a Flood Resilient Waterfront: Examples from the Kingston Floodin...
Visions for a Flood Resilient Waterfront: Examples from the Kingston Floodin...Visions for a Flood Resilient Waterfront: Examples from the Kingston Floodin...
Visions for a Flood Resilient Waterfront: Examples from the Kingston Floodin...
 
Visions for a flood resilient waterfront: examples from the Kingston Flooding...
Visions for a flood resilient waterfront: examples from the Kingston Flooding...Visions for a flood resilient waterfront: examples from the Kingston Flooding...
Visions for a flood resilient waterfront: examples from the Kingston Flooding...
 
Development of a Flood Warning Tool Set for Bandera, Texas - Doug Schnoebelen
Development of a Flood Warning Tool Set for Bandera, Texas - Doug SchnoebelenDevelopment of a Flood Warning Tool Set for Bandera, Texas - Doug Schnoebelen
Development of a Flood Warning Tool Set for Bandera, Texas - Doug Schnoebelen
 
Projected Climate Change Impacts for Rhode Island’s Coast: A Summary of the S...
Projected Climate Change Impacts for Rhode Island’s Coast: A Summary of the S...Projected Climate Change Impacts for Rhode Island’s Coast: A Summary of the S...
Projected Climate Change Impacts for Rhode Island’s Coast: A Summary of the S...
 
An Introduction to the Environment Agency extreme offshore wave, water level ...
An Introduction to the Environment Agency extreme offshore wave, water level ...An Introduction to the Environment Agency extreme offshore wave, water level ...
An Introduction to the Environment Agency extreme offshore wave, water level ...
 
Beach slopes from satellite-derived shorelines [Coast2Coast presentation]
Beach slopes from satellite-derived shorelines [Coast2Coast presentation]Beach slopes from satellite-derived shorelines [Coast2Coast presentation]
Beach slopes from satellite-derived shorelines [Coast2Coast presentation]
 
City of Miami Beach SWMMP Presentation August17 2012-1
City of Miami Beach SWMMP Presentation August17 2012-1City of Miami Beach SWMMP Presentation August17 2012-1
City of Miami Beach SWMMP Presentation August17 2012-1
 
Presentation: Unit 1 Introduction to the hydrological cycle
Presentation: Unit 1 Introduction to the hydrological cyclePresentation: Unit 1 Introduction to the hydrological cycle
Presentation: Unit 1 Introduction to the hydrological cycle
 
What You Need to Know About NOAA Atlas 14, Gregory Waller - National Oceanic ...
What You Need to Know About NOAA Atlas 14, Gregory Waller - National Oceanic ...What You Need to Know About NOAA Atlas 14, Gregory Waller - National Oceanic ...
What You Need to Know About NOAA Atlas 14, Gregory Waller - National Oceanic ...
 
Ccpca mineart
Ccpca mineartCcpca mineart
Ccpca mineart
 
Nichi.11 12-13.nasa.cynthia rosenzweig
Nichi.11 12-13.nasa.cynthia rosenzweigNichi.11 12-13.nasa.cynthia rosenzweig
Nichi.11 12-13.nasa.cynthia rosenzweig
 
Introduction to USGS Arizona Program and Hydrology (Hoffman)
Introduction to USGS Arizona Program and Hydrology (Hoffman)Introduction to USGS Arizona Program and Hydrology (Hoffman)
Introduction to USGS Arizona Program and Hydrology (Hoffman)
 
The History of Coastal Flood Hazard Assessments in the Great Lakes
The History of Coastal Flood Hazard Assessments in the Great LakesThe History of Coastal Flood Hazard Assessments in the Great Lakes
The History of Coastal Flood Hazard Assessments in the Great Lakes
 
ASFPM 2016: The History of Coastal Flood Hazard Assessments in the Great Lakes
ASFPM 2016: The History of Coastal Flood Hazard Assessments in the Great LakesASFPM 2016: The History of Coastal Flood Hazard Assessments in the Great Lakes
ASFPM 2016: The History of Coastal Flood Hazard Assessments in the Great Lakes
 
Developing a Model to Validate the Use of Landsat and MODIS Data to Monitor C...
Developing a Model to Validate the Use of Landsat and MODIS Data to Monitor C...Developing a Model to Validate the Use of Landsat and MODIS Data to Monitor C...
Developing a Model to Validate the Use of Landsat and MODIS Data to Monitor C...
 
vdatum_webinar_lesson information2013.pdf
vdatum_webinar_lesson information2013.pdfvdatum_webinar_lesson information2013.pdf
vdatum_webinar_lesson information2013.pdf
 
Modelling extreme conditions for wave overtopping at Weymouth - Oliver Way (H...
Modelling extreme conditions for wave overtopping at Weymouth - Oliver Way (H...Modelling extreme conditions for wave overtopping at Weymouth - Oliver Way (H...
Modelling extreme conditions for wave overtopping at Weymouth - Oliver Way (H...
 
Coastal Landcover Trends & Applications in the NW
Coastal Landcover Trends & Applications in the NWCoastal Landcover Trends & Applications in the NW
Coastal Landcover Trends & Applications in the NW
 

GeoTool_2015_Coastal_Data_Application_BWang_Final

  • 1. Page | 1 Proactive By Design. Our Company Commitment COASTAL DATA APPLICATION Projecting Future Coastal Flood Risk for Massachusetts Bay Bin Wang, Tianyi Liu, Daniel Stapleton & Michael Mobile 2015 Coastal GeoTools
  • 2. Page | 2  Overview of available data sources for coastal and water resource engineers  Overview of numerical hydrodynamic modeling Outline Objective: to present method and steps for site-specific coastal flood hazard analysis • Small budget • Relatively short project schedule • Use of published data by USACE NACCS and other government agencies
  • 3. Page | 3 Background Coastal Flooding Erosion Flood Damage Structural Damage
  • 4. Page | 4 Background Need to identify/quantify flood hazards:  stillwater elevations  wave action  environmental loads  shoreline and nearshore response To achieve coastal resiliency:  critical infrastructure  communities  biohabitats  natural resources Coastal Resiliency
  • 5. Page | 5 Massachusetts Bay & Cape Cod Bay • Total Number of Cities/Towns = 53 • Population = 1.90 M (2010 Census) • Historical Coastal Towns Background
  • 6. Page | 6 Massachusetts Bay Coastal Flood Hazard Background “Nor-Easters”
  • 8. Page | 8 Available Data South Shore Coastal Geomorphology: Beaches, Estuaries, Marsh, Structures GZA Coastal Engineering GeoTool
  • 9. Page | 9 Available Data South Shore Coastal Geomorphology: Shoreline Change
  • 10. Page | 10 Available Data North Shore Coastal Geomorphology: Beaches, Estuaries, Rocky Shore, Scarps, Structures
  • 11. Page | 11 NOAA SLOSH Model • Hydrodynamic Model • Develops hurricane windfield • NOAA developed DEMs Available Data
  • 13. Page | 13 NOAA/NOS/CO-OPS Tide Gages • Observed water levels, e.g., time series for model validation/verification; extreme value analysis; empirical simulation technique (EST); • Predicted tides and tidal constituents; • Datum conversions (w/ Vdatum); • Sea level trend Available Data
  • 14. Page | 14 NOAA/NOS/CO-OPS 8443970: Boston Harbor 5 6 7 8 9 10 11 12 1 10 100 1,000 StillwaterElevation(feet,NAVD88) Return Period (Years) Observed Annual Maximum - Original Tide Data (ft, NAVD88) Observed Annual Maximum Adjusted w/ Sea Level Rise Calculated Stage-Frequency Curve w/ Original Tide Data Calculated Stage-Frequency Curve w/ Sea Level Rise-Adjusted Tide Data Hingham Harbor (FEMA 2012) Generalized Extreme Value (GEV) Available Data
  • 15. Page | 15 Available Data FEMA Flood Insurance Study and Rate Maps
  • 16. Page | 16 Available Data FEMA Flood Insurance Study and Rate Maps
  • 17. Page | 17 Wave Information Studies (WIS) • Frequency analysis • Time series Available Data
  • 18. Page | 18 Wave Information Studies (WIS) 100-year return period significant deep water wave height: +/- 35 ft Available Data
  • 19. Page | 19 USACE North Atlantic Coast Comprehensive Study (NACCS) Numerical Hydrodynamic Storm Surge and Wave Models USACE NACCS
  • 20. Page | 20 Site-Specific High Resolution Storm Surge, Wave and Flood Modeling Coupled ADCIRC + SWAN Models Numerical Hydrodynamic Modeling
  • 21. Page | 21 • NOAA or State GIS topographic & hydrographic data layers (DEM) • National or state land cover database • NOAA COOPS tide gages – water levels and other data; • USACE Wave Information System (WIS) – wave & wind gages • National Climate Data Center - ground climate/weather stations • NHC Hurricane Re-analysis project – best track data • Other (e.g., USGS stream gage data) Model inputs and calibration Model construction Data Sources
  • 22. Page | 22 U.S. Coastal Relief Model (30-m)LiDAR Terrain Data (2009 Boston @ 1-m) Note: datum conversions & units Data Sources
  • 23. Page | 23 Land Use – building nodal attributes, Manning’s friction values, surface roughness coefficients … Data Sources State: MassGIS LU2005 National: NLCD 2011 (v.2014)
  • 24. Page | 24 Tropical Cyclones: • HURDAT / HURDAT 2 • Historical Tracks • IBtrACS - Int. Best Track Archive • Others (e.g., RAMMB) Data Sources Time Series Verification Statistical analysis
  • 25. Page | 25 Extratropical Cyclones Data Sources Book: New England Weather, New England Climate (Zielinski & Keim, 2003) February 7, 1978
  • 26. Page | 26 USACE NACCS ADCIRC+SWAN Coupled Grid Numerical Model FEMA Model Grids Refined for New England
  • 27. Page | 27 GZA High Resolution, Locally-Refined ADCIRC+SWAN Coupled Grid GZA High Resolution Local Model FEMA Region II Refined for Southern New England
  • 28. Page | 28 Model Validation Hurricane Bob 1991 August 16 - 28 Landfall: 41.4N, 71.4W
  • 29. Page | 29 Validation – Hurricane Bob 1991 Model Validation 0 5 10 15 20 25 30 35 40 45 18 19 20 21 SignificantWaveHeight(ft) Days in August, 1991 NDBC Buoy Station 44008 Observed Simulated -3 -2 -1 0 1 2 3 4 5 6 18 19 20 21 WaterSurfaceElevation(ft, NAVD88) Days in August, 1991 Hurricane Bob Storm Surge Newport, RI Observed Simulated
  • 30. Page | 30 Bearing 10 ° Rmax 35 nm Vf 20 kt Vmax 105 kt DP 68 mb Modeling Extreme (Very Low Probability) Hurricane Synthetic Hurricane
  • 31. Page | 31 Typical track direction, similar to historical events Synthetic Hurricane
  • 32. Page | 32 Sea Level Rise Note: The Commonwealth of Massachusetts has not officially adopted any SLC scenario.
  • 33. Page | 33 Synthetic Hurricane Present Sea Level
  • 34. Page | 34 Synthetic Hurricane 2100 USACE High SLR
  • 35. Page | 35 Synthetic Hurricane Present Sea Level 2100 USACE High SLR
  • 36. Page | 36 North Shore at greater risk for waves Synthetic Hurricane
  • 37. Page | 37 1 2 3 4 5 -10 -5 0 5 10 15 0 1 2 3 4 ADCIRC+SWANCalculated WL(ft,NAVD88) Simulation Time (days) Station 1 - Salem Station 3 - Boston Station 5 - Scituate Peak storm tide • varies in space • synchronized • Boston at greater risk Synthetic Hurricane
  • 38. Page | 38 Impact of Sea Level Rise Peak Storm Tides for Selected Sea Level Scenarios 0 2 4 6 8 10 12 14 16 18 Salem Revere Boston Quincy Scituate CalculatedStillwaterLevel(ft, NAVD88) Present SLR Int. SLR High North South
  • 39. Page | 39 - Slightly nonlinear storm tide response to sea level rise; - For non-extreme cases, approximation by linear superposition; - For more extreme cases, numerical modeling needed 1.5 1.6 1.7 1.8 Salem Revere Boston Quincy Scituate CalculatedStillwaterLevel Increase(ft) SLR Int. - Present Input SLR Int. 4.8 4.9 5.0 5.1 Salem Revere Boston Quincy Scituate CalculatedStillwaterLevel Increase(ft) SLR High - Present Input SLR High Impact of Sea Level Rise
  • 40. Page | 40 USACE NACCS Data Output “Save” Points Comparison with USACE NACCS
  • 41. Page | 41 3 6 9 12 15 1 10 100 1,000 10,000 StillwaterElevation(feet, NAVD88) Return Period (Years) Observed Annual Maximum Adjusted w/ Sea Level Rise Calculated Stage-Frequency Curve w/ Sea Level Rise-Adjusted Tide Data Hingham Harbor (FEMA 2012) NACCS Boston Harbor MT NACCS Boston Harbor HT NOAA/NOS/CO-OPS 8443970: Boston Harbor; NACCS- predicted flood-frequency curve Comparison with USACE NACCS MT ~ HT
  • 42. Page | 42 Overland Wave Inundation: CEDAS: ACES Module Applying Model Output
  • 43. Page | 43 Flood Inundation Models Hydrodynamic Loads on Protective Barrier Maximum Flow Depth (ft) 1.9 MaximumVelocity (ft/s) 1.7 Impact Force (pounds) per linear feet 7.7 Applying Model Output
  • 44. Page | 44 Estuary Circulation; sediment transport Applying Model Output Shoreline Processes Beach Erosion
  • 45. Page | 45 Applying Model Output Resiliency Design
  • 46. Page | 46 Take-away • Massachusetts Bay has significant flood risk:  Tropical cyclones and nor’easters  Sea level rise  Large population  Critical infrastructure • USACE NACCS: provides updated flood projections • NACCS can be coupled with local, high resolution surge and wave models
  • 47. Page | 47 Bin Wang, P.E. Technical Specialist Norwood, MA 781-278-5809 Bin.Wang@gza.com Daniel C. Stapleton, P.E. Principal Norwood, MA 02062 781-278-5743 Daniel.Stapleton@gza.com Tianyi Liu, Ph.D. Coastal Engineer Specialist Norwood, MA 781-278-3819 Tianyi.Liu@gza.com Michael A. Mobile, Ph.D. Technical Specialist Bedford, NH 603-232-8738 Michael.Mobile@gza.com Thank You!
  • 48. Page | 48 Synthetic Hurricane