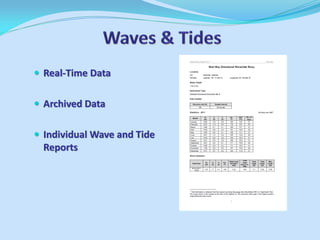
Download to read offline
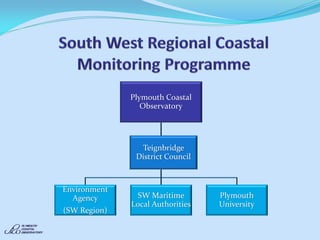
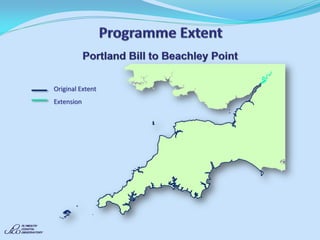
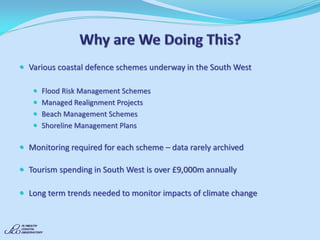
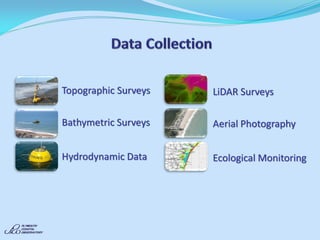
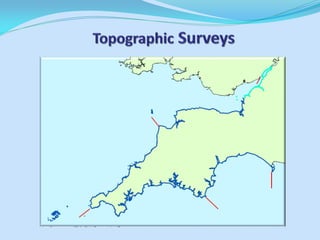


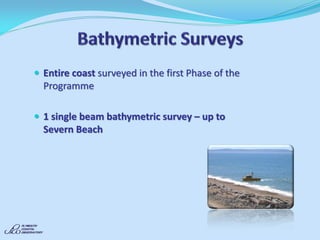
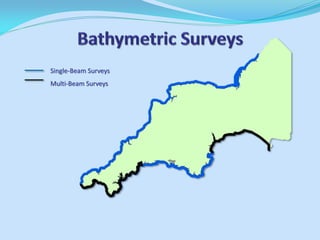
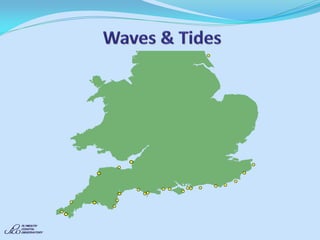
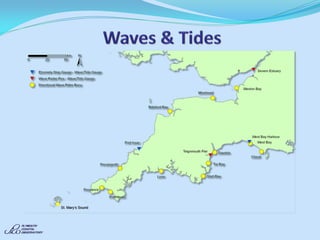


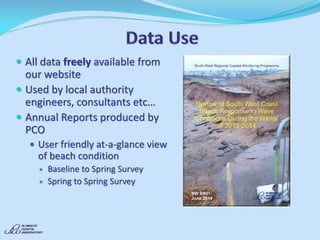


The South West Regional Coastal Monitoring Programme conducts coastal monitoring in the southwest of England to standardize data collection and understand long term trends from climate change. The program utilizes various surveys including topographic and bathymetric surveys, LiDAR, aerial photography, and hydrodynamic instrumentation. Data is made freely available to support coastal management and research. Future efforts include securing additional funding and exploring new monitoring technologies.
![Beach slopes from satellite-derived shorelines [Coast2Coast presentation]](https://cdn.slidesharecdn.com/ss_thumbnails/coast2coastkvosslideshare-200513061851-thumbnail.jpg?width=640&height=640&fit=bounds)


