Download as PDF, PPTX
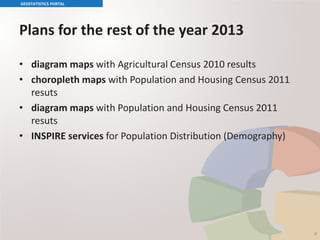
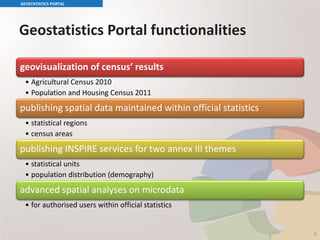
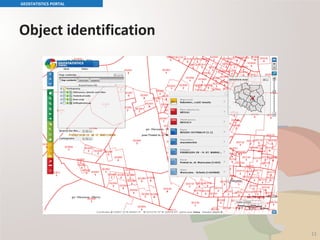
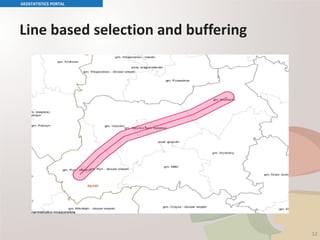
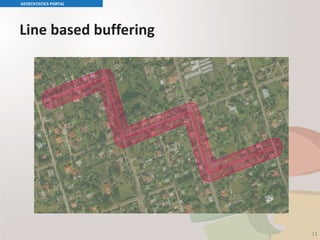
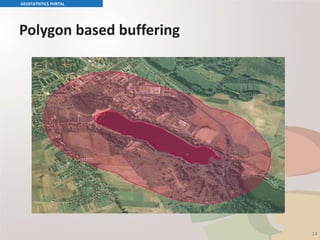
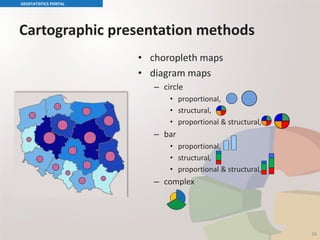
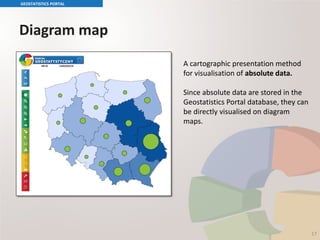
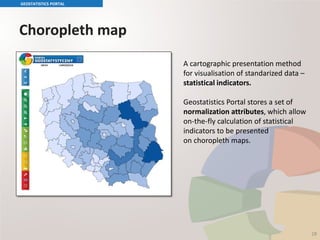
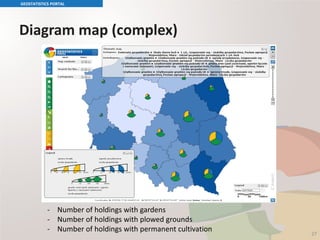
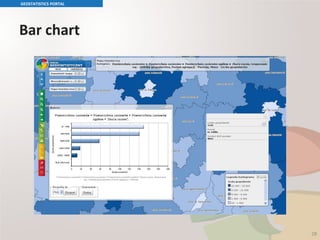
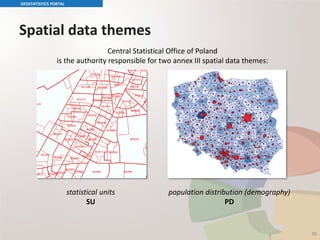

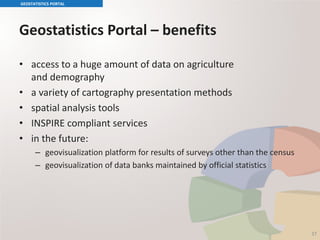

The Geostatistics Portal is a platform launched by the Central Statistical Office of Poland in June 2013 for visualizing and analyzing census data using maps and spatial analysis tools. It provides choropleth and diagram maps of agriculture and demographic census results. INSPIRE compliant services include a discovery service, view service for statistical units, and download service. The portal aims to improve access to statistical data and make aggregated census results more spatially understandable for users.