1. Landslides cause significant amounts of damage and economic loss in mountainous regions throughout the world. The continuous
growth of population and resulting urban sprawl creates an outcome where people are forced to live in areas that are more
vulnerable to landslides and other disturbances. Therefore, there is a growing need to understand what areas are most likely to be
affected by landslides and who will be impacted. Landslides can vary in shape, rate of movement and how the surface is affected
depending on the type of movement and material (Dahal 2008, Dai 2001, Wachel 2000).
Landslide hazard is defined as the probability of occurrence of a potentially damaging landslide within a given area (Hadmoko
2010). The main factors that affect the landslide hazard for any area include: lithology, geomorphology, soil depth, soil type, slope
gradient, elevation, land use, and drainage patters. Other external variables include, heavy rainfall, earthquakes and volcanic
activity. An expert based heuristic approach is used to establish a direct relationship between slope failures and the relevant terrain
parameters during the landslide inventory (Dahal 2008).
A Landslide Economic Risk Map is commonly produced when evaluating landslide susceptibility to determine individuals most
vulnerable in an area. Landslide Economic Risk is defined by the landslide potential along with the expected losses to life and
property during the event. The main goal here is to understand the areas where the greatest likelihood of landslides is to be
expected and the resulting damage from landslides (USGS 2014).
A Social-Vulnerability Map helps us understand the demographic and socio-economic status of the community in relation to the
landslide risk map. Loss in an event varies geographically, over time, among different social groups, and over time and space
(Cutter 2003). Vulnerability can be defined as the likelihood of being harmed by unforeseen events or as susceptibility to
exogenous shocks, which extends the traditional view on poverty. The susceptibility to a shock depends on the ability of avoidance
which is another aspect of risk management (Holzmann 2001).
The information provided by this work would be valuable to the local government in order to support decisions concerning land use
planning and future expansion in South Carolina. Detailed information on the specific types of properties, and infrastructures is
recommended to be included for future research. This project could help governmental agencies plan, coordinate and standardize
their approach to disaster management.
A GIS Based Modeling of Landslide Hazards and Potential Impacts on the Local Communities in the Upstate of South Carolina
Katie Caulfield and Suresh Muthukrishnan
Department of Earth and Environmental Sciences, Furman University, Greenville, SC 29613
III. Results
I. Introduction
II. Methodology
VI. Acknowledgements
V. Future Research
VII. References/ Data Sources
IV. Conclusion
The data collected from various sources were first re-projected (to UTM GCS 1983 17N) and clipped to the extent of the study area.
The data used for this study includes slope, aspect, land use, lithology, faults, rivers, roads, and precipitation. All of the data layers
were converted to raster format to facilitate carrying out spatial analysis. Thematic raster layers were reclassified and individual
classes were ranked based on their importance on a scale of 1-6, with 6 corresponding to a more favorable condition for occurrence
of landslide. The spatial database was constructed through a weighted overlay analysis (figure 3 and table 1).
In the Landslide Economic Risk Map, the main steps follow the Landslide Hazard Map in data collection from various sources and
construction of the spatial database from ArcGIS layers. This map uses four variables (slope, urban infrastructure, land use,
transportation infrastructure) that were weighted with a 1-6 parameter, with 6 being the highest risk using a heuristic method (figure 4
and table 2).
The Social-Vulnerability Map was created by intersecting data in census block group to analyze where the majority race, mean
income by race and percentage of age 18-25 and over 85 overlap spatially in the study area. This intersection created Population
Groups which was then given a corresponding number for easier reference (figure 5 and table 3). This map is viewed in conjunction
with previous work done on Landslide Hazards to see which Population Groups are living in different hazard areas, with particular
focus on the High Hazard areas.
The Landslide Hazard Map for the Upstate of South Carolina revealed that 0.001% of the study area is within the very high hazard (5)
area, while 6.4% of the study area falls within the very low hazard (1) area. The high hazard (4) area is 1.2% of the study area, 22.1%
of the study area falls within the medium hazard (3) area, and 70.3% fall into the low hazard (2) area of the study area (Table 1, Figure
3). The areas that have the highest percentage of high hazard are located in Pickens and Oconee Counties.
The Landslide Economic Risk Map for the Upstate of South Carolina revealed that 0.1% of the study area is within the high risk (6)
area, while 8.1% of the study area falls within the low risk (1) area. The medium-high risk (5) area is 0.6% of the study area, 0.3% and
4.6% of the study area falls within the two medium hazard (3 and 4) areas, and 86.4% fall into the medium-low hazard (2) area of the
study area (Figure 4, Table 2). In comparing the high risk (Risk 6) with the Landslide Hazard Map, 0% are in high hazard (5) areas, with
0.01% in the low hazard (1) area. There are 1.4% is in the medium-high (4) area, 54.9% is in the medium hazard (3) area, and 43.7%
in the medium-low hazard (2) area.
In the Social-Vulnerability Map, only two Population Groups live in the Very High Hazard Area (5), with Group 1 having a higher
percentage than Group 2. Every other Hazard Area has all the Population Groups living in them. Comparing the High Age categories to
one another, Group 2 is the higher percentage in the study area in the lower hazards (1-3) areas and in medium-high hazard (4) areas
Group 1 becomes the higher percentage in the study area. In comparing the Black categories to one another, Group 3 is the higher
percentage in the study area in the lower hazards (1-2) areas and Group 4 in the medium and medium-high hazards (3-4) areas.
Comparing income as a whole looks a little skewed because of the higher numbers under Whites than Blacks or African Americans but
if the two races are compared separately before seeing if the trends are the same then it is much easier. Interestingly, ‘Mean Above’
has a higher percentage of the study area in the lower hazard (1-3 or 4) areas and ‘Mean Below’ has a higher percentage of the study
area in the higher hazard (3 or 4-4 or 5) areas. This trend holds for both mean income levels and across all categories except
Low/Medium Age and Black or African American which is reversed (Figure 5, Table 4).
Landslides cause tremendous loss of life and property damage every year in mountainous areas. In these areas, landslide hazard
mapping is important to outline landslide susceptible areas. This paper presents an applied ArcGIS approach for assessing potential
slope instability, which is valuable for the Upstate of South Carolina in land use planning and identifying where greatest hazard and
risk areas are to be expected. Using ArcGIS, three levels of susceptibility, low, medium, and high, were mapped based on degree of
slope, aspect, rock type, distance from faults, distance from roads, distance from rivers and land cover. Most landslide hazard areas
area in Oconee and Pickens Counties while most landslide economic risk areas are in Spartanburg and Greenville Counties. These
high levels are not in overlapping counties but with increased urban sprawl there is a potential for development in high hazard areas
which is important to recognize and prevent.
A special thank you to Mike Winiski for his support and assistance on this project, without him this research would not be possible. We
also would like to thank everyone in the EES 201 Geographic Information Systems class and 472 Research and Analysis class for
their insights, suggestions and moral support along the way. Thanks to Furman Advantage Funding for providing the resources to
complete this work.
• Durre, Imke, Michael F. Squires, Russell S. Vose, Xungang Yin, Anthony Arguez, and Scott Applequist, 2012, NOAA's 1981-2010
U.S. Climate Normals: Monthly Precipitation, Snowfall, and Snow Depth: Journal of Applied Meteorology and Climatology, 2013.
• Horton, J. Wright, Jr., and Connie L. Dicken, 2001, Preliminary Digital Geologic Map of the Appalachian Piedmont and Blue Ridge,
South Carolina Segment: U.S. Geological Survey Open-File Report 01-298.
• Gesch, D.B., 2007, The National Elevation Dataset, in Maune, D., ed., Digital Elevation Model Technologies and Applications: The
DEM Users Manual, 2nd Edition: Bethesda, Maryland, American Society for Photogrammetry and Remote Sensing, p. 99-118.
• Minnesota Population Center, 2011, National Historical Geographic Information System: v. 2.0, 2014.
• South Carolina Geological Survey South Carolina Department of Natural Resources, 2006, Statewide DEM for SC: South Carolina
Department of Natural Resources, 2014.
• US Geological Survey, 2011, Gap Analysis Program (GAP): National Land Cover, v 2.
Table 2: Landslide Economic Risk Map Data
Landslide Risk Percentage of Study Area Km2 in Study Area
6 (High) 0.087% 10.5
5 0.6% 76.1
4 (Medium) 0.2% 28.5
3 4.6% 551.6
2 86.4% 10473.9
1 (Low) 8.1% 975.3
Total 12116
Table 1: Landslide Hazard Map Data
Landslide Hazard Percentage of Study Area Km2 in Study Area
5 (High) 0.001% 0.12
4 1.2% 142.6
3 (Medium) 22.2% 2684.5
2 70.3% 8513.6
1 (Low ) 6.4% 777.2
Total 12116
Table 3: Social-Vulnerability Map Methodology Labels
Population Group Attributes Population Group Name
Low/Medium Age and White and Mean
Below $45,000
Group 1
Low/Medium Age and White and Mean
Above $45,000
Group 2
Low/Medium Age and Black/African
American and Mean Below $25,000
Group 3
Low/Medium Age and Black/ African
American and Mean Above $25,000
Group 4
High Age and White and Mean Below
$45,000
Group 5
High Age and White and Mean Above
$45,000
Group 6
High Age and Black/ African American and
Mean Below $25,000
Group 7
High Age and Black/ African American and
Mean Above $25,000
Group 8
Figure 1: The study area is located in the Upstate of South
Carolina and covers the counties of Spartanburg, Greenville,
Pickens, Oconee, Cherokee, Laurens, and Anderson. The
area is in the foothills of the Appalachian Mountains. The
area is subject to a number of factors that favor the
occurrence of landslides, which includes steep slopes in the
mountains, a humid climate with heavy rainfall, and growing
sprawl centered around Greenville City. The areas are in the
Blue Ridge Escarpment and Piedmont Ecoregion (SCDNR,
2014).
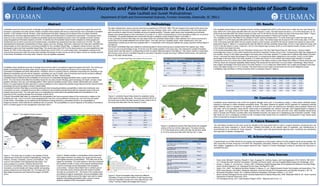
Figure 2: Spatial variation in precipitation shows areas that
have higher elevation and steep river gorges are the areas
with highest amounts of precipitation. This often acts as the
trigger for landslides. The area marked in dark blue represent
the conditions similar to many of the tropical rainforest areas
in terms of average annual precipitation and ecological
communities. Caesars Head State Park in northern part of
the Greenville county receives about 80 inches of rainfall
annually as compared to 40 – 55 inches in the coastal plains
and piedmont regions respectively. Annual precipitation data
from weather stations around the region was used to create
spatially interpolated precipitation data, using an inverse
distance weighted (IDW) interpolation method.
Figure 3: Landslide Hazard Map shows the weighted overlay
of the seven intrinsic data layers. The study showed 0.001% of
the study area is within the high hazard (5) area, while 6.4% of
the study area falls within the low hazard (1) area.
Figure 4: Landslide Economic Risk Map shows the weighted
overlay of the four intrinsic data layers. The study showed
0.1% of the study area is within the high risk (6) area, while
8.1% of the study area falls within the low risk (1) area.
Figure 5: Social-Vulnerability Map shows the different
Population Groups and their relation to high hazard areas.
Only two Population Groups live in the High Area (5), with
Group 1 having a higher percentage than Group 2.
Abstract
Landslides cause enormous amounts of damage and significant economic loss in mountainous regions throughout the world. An
increase in population and urban sprawl creates a situation where people start living in areas that are more vulnerable to landslide
hazards. In the Upstate of South Carolina, urban development has been creeping up the slopes of the mountains, therefore
addressing the concerns regarding safety of the communities and infrastructure is of paramount importance. The purpose of this
study is to use a heuristic model to evaluate the landslide hazard and landslide economic risk in the Upstate of South Carolina
using Geographical Information Systems (ArcGIS). To identify how the landslide hazard model compares to where people and
infrastructure are at risk to economic and societal losses, a landslide risk assessment was also carried out in ArcGIS. The data
representing the landscape characteristics of slope, aspect, land use, lithology, fault lines, roads and river lines were classified and
ranked based on their importance in promoting instability for the Landslide Hazard Map. A weighted overlay function was then
developed to derive the final Landslide Hazard Map. The results show that 0.001% of the study area is in an area classified as high
hazard, 22.148% of the study area is in medium hazard area, and 6.415% is in a low hazard area. Demographic analysis at the
census block group level within the study area indicates that people of mean income as well as higher income are equally exposed
to the threat of landslide in the study area, however, they are spatially separated.
Table 4: Socio-Economic Hazard Map Data
Percent of Group Populations by Hazard Group 1 Group 2 Group 3 Group 4 Group 5 Group 6 Group 7 Group 8
1 ( Very Low) 45.1% 49.0% 2.2% 0.5% 0.9% 2.1% 0.1% 0.1%
2 42.6% 51.9% 2.1% 1.2% 0.7% 1.2% 0.1% 0.1%
3 (Medium) 39.6% 54.4% 1.9% 1.9% 0.7% 1.2% 0.2% 0.1%
4 37.9% 59.2% 0.9% 0.9% 0.5% 0.5% 0.04% 0.03%
5 (Very High) 90.0% 10.0% 0.0% 0.0% 0.0% 0.0% 0.0% 0.0%