SlideShare a Scribd company logo
1 of 14
Download to read offline
Disasters, 2003, 27(2): 127–140
© Overseas Development Institute, 2003.
Published by Blackwell Publishing, 9600 Garsington Road, Oxford OX4 2DQ, UK and 350 Main Street, Malden, MA 02148,
USA.
The Application of Geographic Information
Systems and Global Positioning Systems in
Humanitarian Emergencies: Lessons Learned,
Programme Implications and Future Research
Reinhard Kaiser Paul B. Spiegel
Centers for Disease Control CDC
and Prevention (CDC)
Alden K. Henderson Michael L. Gerber
CDC CDC
Geographic information systems (GIS), global positioning systems and remote sensing
have been increasingly used in public health settings since the 1990s, but application
of these methods in humanitarian emergencies has been less documented. Recent
areas of application of GIS methods in humanitarian emergencies include hazard,
vulnerability, and risk assessments; rapid assessment and survey methods; disease
distribution and outbreak investigations; planning and implementation of health
information systems; data and programme integration; and programme monitoring
and evaluation. The main use of GIS in these areas is to provide maps for decision-
making and advocacy, which allow overlaying types of information that may not
normally be linked. GIS is also used to improve data collection in the field (for
example, for rapid health assessments or mortality surveys). Development of GIS
methods requires further research. Although GIS methods may save resources and
reduce error, initial investment in equipment and capacity building may be substantial.
Especially in humanitarian emergencies, equipment and methodologies must be
practical and appropriate for field use. Add-on software to process GIS data needs to
be developed and modified. As equipment becomes more user-friendly and costs
decrease, GIS will become more of a routine tool for humanitarian aid organisations in
humanitarian emergencies, and new and innovative uses will evolve.
Keywords: geographic information, global positioning systems, remote sensing,
satellite imagery, humanitarian emergencies.
Introduction
The last decades have seen the introduction of geographic information systems (GIS) in
diverse public health settings. GIS methods include global positioning systems (GPS)
and remote sensing. Long used as planning and data collection tools by military and
civilian institutions, these technologies are now widely applied to epidemiology and
public health in developed countries and, to a lesser extent, in underdeveloped
countries. Most international health applications of GIS methods have been in
R. Kaiser, P.B. Spiegel, A.K. Henderson and M.L. Gerber128
outbreak investigations and epidemiologic studies of infectious diseases. These uses
have been well documented in the literature and are gaining acceptance as valuable
epidemiologic tools (Vine et al., 1997; Moore and Carpenter, 1999; Robinson, 2000).
Applications of GIS methods in humanitarian emergencies (HE) are less well
documented. Use of GIS methods for resource allocation, planning and logistics has
become a standard component in major HE (in Kosovo, Sierra Leone and Afghanistan).
Recent work by the International Emergency and Refugee Health Branch (IERHB) at
the Division of Emergency and Environmental Health Services, Centers for Disease
Control and Prevention (CDC), and by other organisations have used GIS methods in
diverse ways to complement and enhance epidemiologic methods in HE, such as
conducting rapid health assessments or estimating mortality.
In this report, we document current uses of GIS methods in HE, and discuss
lessons learned, programme implications and future research needs.
Background
The most famous example linking the science of epidemiology with the use of
geographic information occurred almost 150 years ago, when John Snow investigated
London’s cholera outbreak in 1854 (Snow, 1855). Today, GIS and satellite data are
used to examine the relation between cholera epidemics and the changing patterns of
warm-water ocean currents (Colwell, 1996). A Medline search in January 2003
showed the first public health article using GIS published in 1986, coinciding with the
time GIS became available on personal computers; 94 per cent of the 255 articles in the
search were published in 1995 and later.
GIS and GPS are powerful computerised tools to examine the spatial location
component of epidemiology and link it with person and time information. GIS has
been defined as a computer system that stores and links non-geographic attributes or
geographically referenced data with graphic map features to allow for a wide range of
information processing and display operations, as well as map production, analysis and
modelling (Tim, 1995). GPS is a constellation of earth-orbiting US-government
satellites that transmit information to hand-held or built-in receivers that can calculate a
location with a potential precision of one square metre (longitude, latitude and
elevation) (CDC, 1993). Remote sensing or satellite imagery refers to the data
obtained by sensors on earth-orbiting satellites. Remote sensing data can be used in
GIS to show animal and vector habitats; surface areas of water, deserts and forests; and
human activity (settlements, roads, land usage) (CDC, 1993).
These technologies are now widely used in the developed world for
epidemiology and public health (Vine et al., 1997; Moore and Carpenter, 1999;
Robinson, 2000). Functions of GIS encompass mapping of the location and
distribution of disease in either endemic settings or outbreak investigations
(Wartenberg, 2001). GIS has added new ways of presenting information collected with
traditional epidemiologic methods. Simple thematic maps can be used for decision-
making and advocacy. GIS allows overlaying of maps to link information from various
diseases or health sectors that may not usually be linked and can help with
interpretation of data. A potential example is overlaying of information on food
distribution, acute malnutrition, micronutrient deficiencies and a measles outbreak.
GIS maps and satellite imagery have advantages over conventional maps because more
information can be updated frequently and distributed rapidly through electronic
The Application of GIS and GPS in Humanitarian Emergencies 129
devices including the Internet (Foresman, 1999). Data collection (for example, during
rapid assessments or surveys) can be faster, more accurate and may require fewer
resources once equipment has been purchased (Melnick and Fleming, 1999). GIS
methods may increase accuracy (through improving random sample selection) and
precision (time-saving methods may allow increasing sample size) (Roper and Mays,
1999). Other applications of GIS may not only improve data presentation, but enhance
epidemiologic methods; those include time series modelling (diffusion of disease,
changes in vector habitat, seasonality of cyclical patterns in incidence) and spatial
correlation to examine risk factors for disease, accessibility modelling for health
service planning (O’Dwyer and Burton, 1998).
GIS methods in international health have been used in the research, outbreak
investigation and control of vector-borne diseases (Kitron, 1994; Dale et al., 1997) with
the main focus on malaria (Hay et al., 2000), as well as tuberculosis (Porter, 1999;
Tanser and Wilkinson, 1999), helminthic infections, including schistosomiasis
(Brooker and Michael, 2000; Brooker et al., 2000), leptospirosis (Barcellos and
Sabroza, 2001), gonorrhea (Becker et al., 1998) and hepatitis C (Mujeeb et al., 2000).
Other applications in international settings included prevention of diarrhoeal disease
(Njemanze et al., 1999), access to primary health-care (Perry and Gesler, 2000),
mapping of population movements for public health management (Stern, 1998) and
health inequalities research (Szwarcwald et al., 2000; Mitchell et al., 2002). GIS
mapping and remotely sensed data also are being used to assess and model catastrophic
events such as earthquakes, toxic runoff, and toxic plumes (Croner et al., 1996). For
example, GIS mapping of earthquake-related deaths and hospital admissions from the
1994 earthquake in Northridge, California, showed that factors such as age and activity
of people during the earthquake may be as important as seismic features in predicting
injury from earthquakes (Peek-Asa et al., 2000).
Spatial statistics for public health application is now a rapidly evolving field.
Methods include calculation of crude, adjusted and smoothed rates; tests for spatial
randomness; and regression analysis to examine associations between geographic
distribution of exposure and disease (Kulldorff, 1999). Statistical models may include
distance-oriented measures (for example, distance to the nearest clinic or water source)
or geospatial smoothing techniques similar to those used in time-series modelling. An
example is inverse density-weighted smoothing, where more weight is given to closer
samples and less to those that are farther away, resulting in reduced variability of
estimates (Isaaks and Srivastava, 1989). Statistical techniques also are available to
analyse spatio-temporal data (Kulldorff, 1999) (for example, to examine distribution of
vector habitats and malaria over time (Dale et al., 1997)).
Uses of GIS in humanitarian emergencies
We define a humanitarian emergency as a situation affecting large civilian populations
and usually involving a combination of conflict, food insecurities and population
displacement resulting in significant excess mortality or morbidity. We have identified
different uses of GIS that support and enhance epidemiologic methods in humanitarian
emergencies. Hazard, vulnerability and risk assessments are used as early warning
systems to prevent or mitigate emergencies resulting from famine. GIS can be a
component of rapid assessments to identify the magnitude of and resources needed for
an emergency. GIS methods can also be used in site planning and to enhance survey
R. Kaiser, P.B. Spiegel, A.K. Henderson and M.L. Gerber130
methods, investigate disease outbreaks, establish health information systems, integrate
data and programmes and monitor and evaluate programmes. Both rapid assessment
and survey methods may use households as sampling units and be similar in outcomes
studied as well as GIS methods used.
The initial equipment and capacity building to use GPS/GIS technology in
emergency humanitarian activities can range from using the available computer and
printer, obtaining shareware from the internet and reallocating personnel to collect data
as the need arises, to acquiring state-of-the-art computers, printers and GIS
instruments, purchasing the most recent versions of sophisticated GIS software,
obtaining training to use these resources and having dedicated personnel to run the
system and collect data. Equipment, capacity building and personnel (assuming one
full salary) may currently cost up to US$100,000. At the low end, a user with some
knowledge of surveying and navigation could use a basic computer, a GIS instrument
that obtains latitude and longitude of features and GIS shareware software for less than
$2,000. Through our experience in working in HE, most organisations have a
computer with sufficient power to run GIS software that allows entry of latitude and
longitude of features and draws and prints maps, but may not have a GPS unit.
However, GIS/GPS have become more common over the years and the hardware and
software prices have dropped. It is hoped that more organisations will purchase and
use this equipment and software. We are currently developing shareware software that
will enable people to use GIS/GPS to enumerate the HE-affected population and, at a
later stage of software development, conduct rapid assessments of vaccine coverage,
malnutrition, health conditions and sanitation.
Use of GIS in HE encompasses work under extreme field conditions. Our
experience with several different types of GPS instruments is that they worked with
minimal performance loss under high temperatures (above 40°C for several hours),
through sandstorms and torrential rain, and after being dropped or bounced around in
cars and in backpacks. Data were not lost during these conditions or even when the
batteries expired.
GIS has now become essential to the planning for, response to, and monitoring
of HE for many organisations active in HE. Many United Nations (UN) organisations
now have specific GIS units: the WHO Health Map unit (WHO, 2002), the UN High
Commissioner for Refugees’ (UNHCR) geographic information and mapping unit
(UNHCR, 2002) and the World Food Program’s vulnerability assessment mapping unit
(WFP, 2002). The UN Office for the Coordination of Humanitarian Affairs (OCHA)
also provides mapping services in conflict areas (OCHA, 2002a). Recent information
systems in emergencies have been designed as inter-agency projects using GIS such as
the Sierra Leone Information System (UNHCR/OCHA, 2002), the Afghanistan
Information Management Service (AIMS) (UNAMA, 2002) and the Humanitarian
Information Centers (HIC) established by OCHA in several countries surrounding Iraq
(OCHA, 2003). Donor organisations are increasingly adding GIS capacity to their
programmes. In the US, both the State Department and the US Agency for
International Development (USAID) have added GIS capacity to their HE programmes
(one example is in Guinea (USAID, 2003)) and are increasingly providing funds to
build such capacity in NGOs and other implementing partners. Similar initiatives are
taking place in Europe (for example, European Commission Humanitarian Aid Office
(ECHO, 2003), UK Department for International Development (DFID, 2003), Swedish
International Development Cooperation Agency (SIDA, 2003)) and other donor
organisations active in HE. As the importance of GIS increasingly becomes
The Application of GIS and GPS in Humanitarian Emergencies 131
recognised, the way it is used in HE will quickly evolve. Below are documented the
following current uses of GIS in HE.
Hazard, vulnerability and risk assessments
Hazard assessment has been used on a continental scale in Africa to identify and
predict drought through the analysis of long-term trend in vegetation patterns and its
relation with the El Niño/Southern Oscillation (ENSO) weather pattern (Eastman et al.,
1997). GIS has also been a component of vulnerability assessments in many different
African countries such as the recent severe famine in southern Africa. Food security
mapping examines the degree to which a population or region is susceptible to a range
of hazards that threaten food supplies or for which food assistance is required. For
example, major parts of Africa are affected by a severe food crisis that was estimated in
December 2002 to affect 38 million people (WFP, 2002). The crisis is aggravated by
the HIV/AIDS epidemic that has a direct impact on food security and nutrition for
individuals, households and communities (OCHA, 2002b). Vulnerability mapping and
GIS risk assessment methods have been used to design and develop an integrated
computer system for famine early warning (Marsh et al., 1994). USAID is funding a
famine early warning system that is based mainly on two types of satellite imagery:
normalised difference vegetation index and meteorological satellite rainfall estimation
(FEWS, 2003). The normalised difference vegetation index provides an indication of
changes in vegetation in response to biophysical conditions, including plant type,
weather and soil, whose main use is to compare the current state of vegetation with
previous time periods to detect anomalous conditions (for example, the same time in an
average year or a reference year). Meteorological satellite rainfall estimation imagery
uses satellite data; global telecommunication systems (GTS) gauge rain reports; model
analyses of wind, topography and relative humidity; and an algorithm that takes into
account geography and seasonality. The result is a spatial estimate of rainfall. The
main use of these images is to compare the current state of rainfall with previous time
periods to detect anomalous conditions (FEWS, 2003). These tools assist decision-
makers to determine food security and predict how many people will need food aid to
prevent or mitigate famine emergencies.
Risk assessment makes predictions on the morbidity or mortality by
examining the interaction between a hazard and the vulnerability of a population. For
example, the number of people at risk for malnutrition and malnutrition-related death
expected from the estimated distribution of drought severity factors and individual
factors of vulnerability (for example, socio-economic factors, loss of food access) was
mapped during the Ethiopian famine in 1984 (Eastman et al., 1997). This project could
have benefited from GIS-based mapping techniques (for an example of GIS use in the
current context of Ethiopian drought and food insecurity see also section on ‘Data and
programme integration’).
Rapid assessments
In the acute phase of HE, rapid assessments help to determine the magnitude and
severity of the situation, the amount of resources needed, as well as the need and
feasibility of an intervention (MSF, 1997). GIS methods can be used to map an area
for site planning, including information about environmental conditions; transport
R. Kaiser, P.B. Spiegel, A.K. Henderson and M.L. Gerber132
routes; habitable land; and availability of water, food and fuel. Additional information,
such as distance from the household to nearest health clinic, food distribution site,
drinking-water source or latrines, can be used to assess access of the population to
essential services. Decision-makers can use this information for planning and resource
allocation (such as water and food distribution sites and latrines) as well as for
determining whether certain minimum standards and indicators are being met. Remote
sensing maps can also be used to help identify water and fuel sources.
In the acute phase of HE, population size estimates are necessary to determine
the scope of the emergency and the resources needed and to provide reasonably
accurate population denominators for health indicators. In this early stage, systematic
random sampling of housing units is usually not feasible. A method called the
quadrant has been used in several refugee camps (Henderson and Spiegel, 1999; Brown
et al., 2001). It consists of mapping the boundary of the camp, laying a grid of square
blocks or quadrants over the camp, randomly selecting square blocks, counting the
population in all households (Brown et al., 2001) or a random subsample of households
in each randomly selected block (Henderson and Spiegel, 1999). The number of
people estimated per square block can then be extrapolated to the total population. GIS
and GPS can be used for mapping the area, creating the grid, and locating the selected
square blocks. Modern GIS software allows obtaining accurate geographic coordinates
of key roads, trails, landmarks, plots and non-residential areas to create a map that
includes inhabited space with precise outer limits of the area. However, population
estimation methods have not been standardised, and only a few examples have been
validated using camp registration data (Henderson and Spiegel, 1999; Brown et al.,
2001). Future research questions include the optimal number and size of square blocks,
addressing heterogeneity in population density between the square blocks, and methods
to deal with partial square blocks at the limits of the camp area. An alternative
approach to estimate population size may be distance-based methods such as the T-
square method (Espie, 2000), which has not yet been used, in HE. During population
estimations, a simple questionnaire can be added for a rapid assessment of the health
status of the population (for example, morbidity, mortality, nutrition or vaccination
status).
Mapping population movements is becoming a standard application of GIS in
the acute phase of HE as well as during repatriation and resettlement. Spontaneous
population movements may require reassessment of the situation in any phase of an
HE. Before population transfers are planned, GIS mapping can help ensure that a
secure location is chosen, sufficient water and sanitation facilities exist or can be
developed and adequate human and material resources and programmes are in place.
For example, in Guinea 2001 an increase in death rates among Sierra Leonean and
Liberian refugees was documented after most of them were relocated to new camps,
possibly because some refugees were not relocated to individual family shelters as
quickly as planned, causing overcrowding of temporary shelters and overburdening of
existing facilities (CDC, 2001; UNHCR, 2001).
Remote sensing maps and aerial views can also provide rapid information to
estimate population sizes and movements in HE. This may be particularly relevant in
areas that are not covered by humanitarian agencies — for example, because insecurity
does not allow access. In 1994 in Goma, Democratic Republic of Congo, the
population size was underestimated when aerial views alone were used, most likely
because displaced people without shelter were not included (NAS, 1997). Modern
high-resolution remote sensing using thermal imaging can provide additional
information that may improve population estimation (for example, fires for cooking
The Application of GIS and GPS in Humanitarian Emergencies 133
and heating). Geographic and environmental conditions such as dense tree cover,
smoke plumes and topographic features in the area may limit the use of GPS and
satellite imagery. Figures 1 and 2 show a satellite image and the corresponding map of
the refugee camps and environmental conditions in the Goma area in 1994.
Survey methods
Two sampling methods have applied GIS and GPS to survey mortality in the
Democratic Republic of Congo (IRC, 2000). The first method, a modification of
the Expanded Programme on Immunisations (EPI) methodology (Henderson and
Figure 1 Spot satellite image and corresponding map (see Figure 2) of the
refugee camps and environmental conditions in the Goma area bordering
Virunga National Park, Democratic Republic of Congo, 1995
Source: UNHCR Geneva, Copyright: CNES, Eurimage, UNHCR, I-mage Consult, ADG, ICCN,
Commission Europeenne, Project Virunga. Illustration courtesy of UNHCR, 2003.
R. Kaiser, P.B. Spiegel, A.K. Henderson and M.L. Gerber134
Figure 2 The corresponding map (see Figure 1) of the refugee camps and
environmental conditions in the Goma area
Sundaresan, 1982) requires that the approximate population size and location of sub-
areas (villages or clinic referral areas) or clusters are known. In the first stage, clusters
are selected proportional to population size. In the second stage, boundaries of clusters
are mapped and a grid of square blocks is laid over the map, random numbers are
assigned to square blocks, and a square block is randomly selected as the location
where all selected or a sample of households are surveyed. GIS and GPS are used for
mapping and to locate the randomly selected square blocks (IRC, 2000). Main
questions for future research are the number of clusters (a minimum of 30 clusters has
been recommended (Binkin et al., 1995)), the size of the grids and heterogeneity in the
outcome of interest between clusters. Design effect and intraclass correlation indicate
heterogeneity that can be anticipated on the basis of the nature of the outcome (for
example, conflict-related mortality may vary considerably between villages because of
the intensity of military activities and destruction) and experiences from previous
surveys (Katz and Zeger, 1994). Studies are needed comparing this method with the
standard EPI method in terms of quality of the outcome estimate, cost and degree of
difficulty.
The second method is applied when the overall population can be estimated
but population sizes of sub-areas are not known. A random starting location is chosen
for sampling along a north-south road. Additional sampling locations are selected at
predefined increments to the east and the west, called east-west transects. The process
of sampling along east-west transects is repeated at predefined intervals to the north
The Application of GIS and GPS in Humanitarian Emergencies 135
and south until the whole survey area is covered. This method oversamples rural areas
and undersamples areas with high population density. The radius of each sampling
point, defined as the distance between the first and the farthest household of the
sampling location, can be used as a weight to adjust for this sampling bias (Roberts and
Despines, 1999). GPS are used to locate sampling locations and to measure the radius
of the sampling point. Main questions for future research are the number of sampling
locations (which also can be called systematic random clusters), and addressing
heterogeneity in population density between sampling locations. The distance between
sampling locations depends on the size of the survey area and the number of sampling
locations. The number of households per sampling location depends on the sample
size, the number of sampling locations and the average number of household members
eligible for the survey. Validation of this methodology is warranted using standard
methods.
GIS and palm-pilot-like devices with a GPS unit allow questionnaires to be
read and answers recorded electronically, reducing the use of paper. Data can be
transferred directly to a computer for analysis. This represents significant time savings
and reduces one potential source of error when data are transferred from paper to
computer (Roper and Mays, 1999; Selanikio et al., 2002). Furthermore, while doing
the survey, key landmarks, such as latrines, water points and health clinics, can be
recorded, mapped and used in conjunction with data recorded from households to aid in
interpretation.
Disease distribution/outbreak investigation
GIS improves our ability to investigate infectious disease outbreaks in HE. Clustering
can give first hints toward causality within neighbourhoods or according to geographic
features. On a larger scale, case distribution maps can help to direct vaccination
campaigns.
Health Information Systems
After a multinational UN force had restored peace in East Timor in 1999, UNHCR
asked CDC to implement a health information system in camps for East Timorese
refugees in West Timor. Fourteen sentinel sites in four districts were selected for
mortality surveillance by size, location and accessibility. The selected sites represented
approximately 50,000 (36 per cent) of the 140,000 refugees. The UNHCR geographic
information and mapping unit provided maps of the refugee camps in West Timor for
the selection process. These maps can be further used to show local or regional trends
in mortality over time and relate them to environmental conditions or disease outbreaks
(Friedman and Spiegel, 2000).
Data and programme integration
CDC collected information about nutrition surveys among children under five years of
age conducted by various NGOs from September 1999 through June 2000 during the
Ethiopian famine. The surveys provided overlaying maps showing where nutrition and
health organisations had operated, food had been distributed and acute malnutrition
R. Kaiser, P.B. Spiegel, A.K. Henderson and M.L. Gerber136
surveys had been conducted. The maps allowed decision-makers to modify
programmes and resource allocation by directing organisations and food delivery to
areas of greatest need, and conducting additional surveys where information was
lacking (Spiegel et al., 2000).
Monitoring and evaluation
GIS maps can be used to monitor and evaluate aid programmes in HE. Maps of
refugee populations in a camp, water distribution sites and latrines indicate whether or
not minimum standards in water supply and sanitation have been achieved (Sphere,
2000). Trends in malnutrition rates and locations of surveys, aid activities and food
distributions can show whether resources are adequately allocated or programmes need
adjustment according to changing needs of emergency-affected populations.
Lessons learned and future research
The documented uses of GIS in HE have a variety of programme implications. Many
of the documented applications need further methods development. To use GIS
methods effectively in HE, potential disadvantages and unanswered questions also have
to be addressed in future research. First, GIS/GPS equipment and software can be
expensive and require specific skills and training (Melnick and Fleming, 1999).
Limitations for developing countries or small organisations may be the costly nature of
resources required to generate useful GIS data. Hiring a GIS consultant may allow for
the costs associated with purchasing software and training an individual to perform GIS
work to be bypassed. Cost-effectiveness and time-saving studies are needed to
evaluate the use of GIS methods in HE. GIS users need to be trained in epidemiology
to understand that GIS is an enhancement rather than an alternative to traditional
epidemiologic methods (Vine et al., 1997). Users should be aware that data in HE may
be insufficient or inadequate. One of the main potential limitations of GIS is that of
‘masking’ the underlying problems of data with a cosmetic technology: everything
looks neat and tidy, while it is often not. In contrast to tables and graphs, maps do not
allow for cross-checking. Therefore, training must include appropriate presentation
and interpretation of data to make them comprehensible by decision-makers (Melnick
and Fleming, 1999) and to prevent over-emphasising or obscuring evidence (Scholten
and de Lepper, 1991). To examine causal relations between exposure and disease,
multivariate models are required that control for potential confounders and effect
modifiers (Melnick and Fleming, 1999). Maps based on those models can show the
predicted geographic variation of disease risk (Clarke et al., 1996). Second, equipment
and methodologies have to be practical, durable and appropriate for field use. GIS
methods for rapid assessments and surveys need further study, and add-on software
needs to be developed and modified to make this method easier to implement. Finally,
although geo-coded datasets and satellite imagery become increasingly available in the
public domain or commercially (Clarke et al., 1996), most GIS data in HE will still
require persons in the field to collect data and interpret it according to the
circumstances on the ground.
The Application of GIS and GPS in Humanitarian Emergencies 137
Conclusions
GIS methods provide improved ways of presenting traditional epidemiologic data as
well as new spatio-temporal information that has a variety of implications for
programmatic decision-making, monitoring and evaluation in HE. Main limitations
and future research needs are related to equipment and training development including
the appropriate presentation and interpretation of information. Future use of GIS in HE
will increase and become essential. As equipment becomes more user-friendly and
costs decrease, more and more humanitarian aid organisations will incorporate it into
their basic tools for programming, as well as monitoring and evaluation. New and
innovative uses for GIS in HE will also evolve.
Acknowledgements
We thank Dabo Brantly, Renata Caldwell, Carol Crawford, Thomas Handzel, Allan
Hightower, Mary Kay Larson and Sam Posner, all from CDC, for fruitful discussions
and inspirations that helped us in writing the paper. We also thank the WHO health
map unit and the UNHCR geographic information and mapping unit for providing GIS
maps. We also thank the UNHCR geographic information and mapping unit for
providing the satellite image and GIS map.
References
Barcellos, C. and P.C. Sabroza (2001) The Place Behind the Case: Leptospirosis Risks and
Associated Environmental Conditions in a Flood-related Outbreak in Rio de Janeiro.
Cadernos de Saude Publica 17 (Suppl): 59–67.
Becker, K.M., G.E. Glass, W. Brathwaite and J.M. Zenilman (1998) Geographic Epidemiology
of Gonorrhea in Baltimore, Maryland, Using a Geographic Information System. American
Journal of Epidemiology 147(7): 709–16.
Binkin, N., K. Sullivan, N. Staehling and P. Nieburg (1995) Rapid Nutrition Surveys: How Many
Clusters Are Enough? Disasters 16(2): 96–9.
Brooker, S. and E. Michael (2000) The Potential of Geographical Information Systems and
Remote Sensing in the Epidemiology and Control of Human Helminth Infections.
Advances in Parasitology 47: 245–88.
—— , M. Rowlands, L. Haller, L. Savioli and D.A. Bundy (2000) Towards an Atlas of Human
Helminth Infection in Sub-Saharan Africa: The Use of Geographical Information Systems
(GIS). Parasitology Today 16(7): 303–7.
Brown, V., G. Jacquier, D. Coulombier, S. Balandine, F. Belanger and D. Legros (2001) Rapid
Assessment of Population Size by Area Sampling in Disaster Situations. Disasters 25(2):
164–71.
CDC (1993) Satellite Surveillance: Geographic Information Technology Used to Prevent and
Control Infectious Diseases. CDC/NCID Focus 3, Atlanta.
—— (2001) Surveillance of Mortality During a Refugee Crisis – Guinea, January–May 2001.
MMWR 50: 1029–32.
Clarke, K.C., S.L. McLafferty and B.J. Tempalski (1996) On Epidemiology and Geographic
Information Systems: A Review and Discussion of Future Directions. Emerging Infectious
Diseases 2(2): 85–92.
Colwell, R.R. (1996) Global Climate and Infectious Disease: The Cholera Paradigm. Science
274(5295): 2025–31.
R. Kaiser, P.B. Spiegel, A.K. Henderson and M.L. Gerber138
Croner, C.M., J. Sperling and F.R. Broome (1996) Geographic Information Systems (GIS): New
Perspectives in Understanding Human Health and Environmental Relationships. Statistics
in Medicine 15(17–18): 1961–77.
Dale, P.E.R., S.A. Ritchie, B.M.Territo, C.D. Morris, A. Muhar and B.H. Kay (1997) An
Overview of Remote Sensing and GIS for Surveillance of Mosquito Vector Habitats and
Risk Assessment. Journal of Vector Ecology 23(1): 54–61.
DFID (2003) Available at: http://www.dfid.gov.uk/.
Eastman, J.R., S. Emani, S. Hulina, H. Jiang, A. Johnson and M. Ramachandran (1997)
Applications of Geographic Information Systems (GIS) Technology in Environmental Risk
Assessement and Management. Clark Labs/Clark University (in cooperation with UNEP),
Worcester.
ECHO (2003) Available at: http://europa.eu.int/comm/echo/index_en.htm
Espie, E. (2000) Memoire de DEA: Evaluation de trois methods d’estimation de population.
Universite V. Segalen, Bordeaux.
FEWS (2003) Famine Early Warning System. Available at: http://www.fews.net/resources/
gcontent/gcontent.cfm?submit=y&f=al&g=1000006&d=al&l=en.
Foresman, T.W. (1999) Spatial Analysis and Mapping on the Internet. J Public Health
Management Practice 5: 57–64.
Friedman, C. and P. Spiegel (2000) Mission report to West Timor by UNHCR/CDC Medical
Coordinators. January 24–2 March, Atlanta.
Hay, S.I., J.A. Omumbo, M.H. Craig and R.W. Snow (2000) Earth Observation, Geographic
Information Systems and Plasmodium Falciparum Malaria in Sub-Saharan Africa.
Advances in Parasitology 47: 173–215.
Henderson, A. and P. Spiegel (1999) Mission Report: Field Testing of a Method to Rapidly
Enumerate a Refugee Population. Centers for Disease Control and Prevention, Atlanta.
Henderson, R.H. and T. Sundaresan (1982) Cluster sampling to assess immunization coverage: a
review of experience with a simplified sampling method. Bulletin of the World Health
Organisation 60(2): 253–60.
IRC (2000) Mortality in Eastern DRC, Results from Five Mortality Surveys. International
Rescue Committee, New York,
Isaaks, E.H. and R.M. Srivastava (1989) An Introduction to Applied Geostatistics. Oxford
University Press, Oxford.
Katz, J. and S.L. Zeger (1994) Estimation of Design Effects in Cluster Surveys. Annals of
Epidemiology 4(4): 295–301.
Kitron, U. (1994) Landscape Ecology and Epidemiology of Vector-borne Diseases: Tools for
Spatial Analysis. Journal of Medical Entomology 35(4): 435–45.
Kulldorff, M. (1999) Geographic Information Systems (GIS) and Community Health: Some
Statistical Issues. J Public Health Management Practice 5(2): 100–06.
Marsh, S.E., C.F. Hutchinson, E.E. Pfirman, S.A. Des Rosiers and C. Van Der Harten (1994)
Development of a Computer Workstation for Famine Early Warning and Food Security.
Disasters 18(2): 117–29.
Melnick, A.L. and D.W. Fleming (1999) Modern Geographic Information Systems – Promise
and Pitfalls. J Public Health Management Practice 5: viii–x.
Mitchell, R., D. Dorling and M. Shaw (2002) Population Production and Modelling Mortality –
An Application of Geographic Information Systems in Health Inequalities Research. Health
and Place 8(1): 15–24.
Moore, D.A. and T.E. Carpenter (1999) Spatial Analytical Methods and Geographic Information
Systems: Use in Health Research and Epidemiology. Epidemiologic Reviews 21(2): 143–
61.
MSF (1997) Médecins Sans Frontières: Refugee Health. An Approach to Emergency Situations.
Macmillan Education, Basingstoke.
Mujeeb, S.A., S. Shahab and A.A. Hyder (2000) Geographical Display of Health Information:
Study of Hepatitis C Infection in Karachi, Pakistan. Public Health 114(5): 413–15.
NAS (1997) Workshop on the Demography of Forced Migration. Refugee Policy Group,
National Academy of Science, Washington.
The Application of GIS and GPS in Humanitarian Emergencies 139
Njemanze, P.C., J. Anozie, J.O. Ihenacho, M.J. Russell and A.B. Uwaeziozi (1999) Application
of Risk Analysis and Geographic Information System Technologies to the Prevention of
Diarrheal Diseases in Nigeria. Am J of Tropical Medicine and Hygiene 61(3): 356–60.
OCHA (2002) Background Note on the Humanitarian Crisis in Southern Africa and the
HIV/AIDS Pandemic, 1 October. Available at: http://www.reliefweb.int/ocha_ol/
—— (2002) UN Office for the Coordination of Humanitarian Affairs. Available at:
http://www.reliefweb.int/ocha_ol/
—— (2003) Humanitarian Information Center for Iraq. Available at:
http://www.agoodplacetostart.org/hic_flyer.php
O’Dwyer, L.A. and D.L. Burton (1998) Potential Meets Reality: GIS and Public Health
Research in Australia. Australian and New Zealand Journal of Public Health 22(7): 819–23.
Peek-Asa, C., M.R. Ramirez, K. Shoaf, H. Seligson and J.F. Kraus (2000) GIS Mapping of
Earthquake-related Deaths and Hospital Admissions from the 1994 Northridge, California,
Earthquake. Annals of Epidemiology 10(1): 5–13.
Perry, B. and W. Gesler (2000) Physical Access to Primary Health Care in Andean Bolivia.
Social Science and Medicine 50(9): 1177–88.
Porter, J.D. (1999) Geographical Information Systems (GIS) and the Tuberculosis DOTS
Strategy. Tropical Medicine and International Health 4(10): 631–3.
Roberts, L. and M. Despines (1999) Mortality in the Democratic Republic of the Congo. Lancet
353(9171): 2249–50.
Robinson, T.P. (2000) Spatial Statistics and Geographical Information Systems in Epidemiology
and Public Health. Advances in Parasitology 47: 81–128.
Roper, W.L. and G.P. Mays (1999). GIS and Public Health Policy: A New Frontier for
Improving Community Health. J Public Health Management Practice 5: vi–vii.
Scholten, H.J. and M.J. de Lepper (1991) The Benefits of the Application of Geographical
Information Systems in Public and Environmental Health. World Health Statistics
Quarterly – Rapport Trimestriel de Statistiques Sanitaires Mondiales 44(3): 160–70.
Selanikio, J.D., T.M. Kemmer, M. Bovill and K. Geisler (2002) Mobile Computing in the
Humanitarian Assistance Setting: An Introduction and some First Steps. Journal of
Medical Systems 26(2): 113–25.
SIDA (2003) Available at http://www.sida.se
Snow, J. (1855) On the Mode of Communication of Cholera. Churchill, London.
Sphere (2000) The Sphere Project. Humanitarian Charter and Minimum Standards in Disaster
Response. Oxford, Oxfam Publishing.
Spiegel, P., P. Salama, S. Maloney and A. Van der Veen (2000) Mission Report: Nutrition
Cluster Surveys in Ethiopia in 1999/2000. Centers for Disease Control and Prevention,
Atlanta.
Stern, A. (1998) International Population Movements and Public Health in the Mekong Region:
An Overview of some Issues Concerning Mapping. Southeast Asian Journal of Tropical
Medicine and Public Health 29(2): 201–12.
Szwarcwald, C.L., F.I. Bastos, C. Barcellos, M.F. Pina and M.A. Esteves (2000) Health
Conditions and Residential Concentration of Poverty: A Study in Rio de Janeiro, Brazil.
Journal of Epidemiology and Community Health 54(7): 530–6.
Tanser, F. and D. Wilkinson (1999) Spatial Implications of the Tuberculosis DOTS Strategy in
Rural South Africa: A Novel Application of Geographical Information System and Global
Positioning System Technologies. Tropical Medicine and International Health 4(10): 634–
8.
Tim, U.S. (1995) The Application of GIS in Environmental Health Sciences: Opportunities and
Limitations. Environmental Research 71(2): 75–88.
UNAMA (2002) Afghanistan Information Management Service (AIMS). Available at:
http://www.aims.org.pk/.
UNHCR (2001) UNHCR Global Report 2001 – Guinea. Available at: http://www.unhcr.ch.
—— (2002) Geographic Information and Mapping Unit (GIMU). Available at:
http://www.unhcr.ch/cgi-
R. Kaiser, P.B. Spiegel, A.K. Henderson and M.L. Gerber140
bin/texis/vtx/home/++wwFqzvxsw8+mn6xFqzvxsw8+mn6hFqhT0NuItFqnp1xczFqn7uFP
AFqwDzmwwwwwwww1Fqn7uFP.
UNHCR/OCHA (2002) Sierra Leone Information System. Available at:
http://www2.reliefweb.int/sle/hic/sierra_leone_information_system.htm.
USAID (2003) Available at http://www.usaid.gov/gn/infotechnology/gis/.
Vine, M.F., D. Degnan and C. Hanchette (1997) Geographic Information Systems: Their Use in
Environmental Epidemiologic Research. Environmental Health Perspectives 105(6): 598–
605.
Wartenberg, D. (2001) Investigating Disease Clusters: Why, When and How? J Royal Statistical
Society 164(1): 13–32.
WFP (2002) Africa Hunger Alert Campaign Begins. Press Release, 16 December. Available at:
http://www.wfp.org/index.asp?section=2
—— (2002) Vulnerability Assessment Mapping. Available at:
http://www.wfp.org/index.asp?section=5
WHO (2002) Health Mapper. Available at: http://www.who.int/emc/healthmap/healthmap.html.
Address for correspondence: Reinhard Kaiser, International Emergency and
Refugee Health Branch, National Center for Environmental Health, Centers for Disease
Control and Prevention, Mail Stop F-48, 4770 Buford Highway NE, Atlanta, Georgia
30341, USA. E-mail: <<RKaiser@cdc.gov>>

More Related Content

What's hot

Caulfield_Thesis_Poster_Final
Caulfield_Thesis_Poster_FinalCaulfield_Thesis_Poster_Final
Caulfield_Thesis_Poster_FinalKatie Caulfield
 
Estimating the Probability of Earthquake Occurrence and Return Period Using G...
Estimating the Probability of Earthquake Occurrence and Return Period Using G...Estimating the Probability of Earthquake Occurrence and Return Period Using G...
Estimating the Probability of Earthquake Occurrence and Return Period Using G...sajjalp
 
geo information ppt in disaster management
geo information ppt in disaster managementgeo information ppt in disaster management
geo information ppt in disaster managementKirpaldumaniya
 
GIS applications in Emergency / Disaster Management
GIS applications in Emergency / Disaster ManagementGIS applications in Emergency / Disaster Management
GIS applications in Emergency / Disaster ManagementPhongsakorn Uar-amrungkoon
 
Application of Remote Sensing & GIS in Disaster Management
Application of Remote Sensing & GIS in Disaster ManagementApplication of Remote Sensing & GIS in Disaster Management
Application of Remote Sensing & GIS in Disaster ManagementAjayPatro
 
Integrating GIS and Remote Sensing Technology In Contact Tracing Of Ebola Vir...
Integrating GIS and Remote Sensing Technology In Contact Tracing Of Ebola Vir...Integrating GIS and Remote Sensing Technology In Contact Tracing Of Ebola Vir...
Integrating GIS and Remote Sensing Technology In Contact Tracing Of Ebola Vir...ANUMBA JOSEPH UCHE
 
Remote Sensing and GIS for Natural Hazards Assessment and Disaster Risk Manag...
Remote Sensing and GIS for Natural Hazards Assessment and Disaster Risk Manag...Remote Sensing and GIS for Natural Hazards Assessment and Disaster Risk Manag...
Remote Sensing and GIS for Natural Hazards Assessment and Disaster Risk Manag...Cees van Westen
 
Remote sensing in Disaster management
Remote sensing in Disaster managementRemote sensing in Disaster management
Remote sensing in Disaster managementDebasis Ray
 
Role of GIS in Health Care Management by Dr. Dipti Mukherji
Role of GIS in Health Care Management by Dr. Dipti MukherjiRole of GIS in Health Care Management by Dr. Dipti Mukherji
Role of GIS in Health Care Management by Dr. Dipti MukherjiPriyanka_vshukla
 
Comparison of machine learning performance for earthquake prediction in Indon...
Comparison of machine learning performance for earthquake prediction in Indon...Comparison of machine learning performance for earthquake prediction in Indon...
Comparison of machine learning performance for earthquake prediction in Indon...TELKOMNIKA JOURNAL
 

What's hot (20)

Caulfield_Thesis_Poster_Final
Caulfield_Thesis_Poster_FinalCaulfield_Thesis_Poster_Final
Caulfield_Thesis_Poster_Final
 
Introduction to Health GIS
Introduction  to Health GIS Introduction  to Health GIS
Introduction to Health GIS
 
Role of RS & GIS; gis in disaster management prepared by er. bishnu khatri
Role of RS & GIS; gis in disaster management prepared by er. bishnu khatriRole of RS & GIS; gis in disaster management prepared by er. bishnu khatri
Role of RS & GIS; gis in disaster management prepared by er. bishnu khatri
 
Estimating the Probability of Earthquake Occurrence and Return Period Using G...
Estimating the Probability of Earthquake Occurrence and Return Period Using G...Estimating the Probability of Earthquake Occurrence and Return Period Using G...
Estimating the Probability of Earthquake Occurrence and Return Period Using G...
 
geo information ppt in disaster management
geo information ppt in disaster managementgeo information ppt in disaster management
geo information ppt in disaster management
 
P020111024313319427680-china.pdf
P020111024313319427680-china.pdfP020111024313319427680-china.pdf
P020111024313319427680-china.pdf
 
GIS in Health
GIS in HealthGIS in Health
GIS in Health
 
Lect 4
Lect 4Lect 4
Lect 4
 
GIS applications in Emergency / Disaster Management
GIS applications in Emergency / Disaster ManagementGIS applications in Emergency / Disaster Management
GIS applications in Emergency / Disaster Management
 
Application of Remote Sensing & GIS in Disaster Management
Application of Remote Sensing & GIS in Disaster ManagementApplication of Remote Sensing & GIS in Disaster Management
Application of Remote Sensing & GIS in Disaster Management
 
Integrating GIS and Remote Sensing Technology In Contact Tracing Of Ebola Vir...
Integrating GIS and Remote Sensing Technology In Contact Tracing Of Ebola Vir...Integrating GIS and Remote Sensing Technology In Contact Tracing Of Ebola Vir...
Integrating GIS and Remote Sensing Technology In Contact Tracing Of Ebola Vir...
 
Landslide work at ITC
Landslide work at ITCLandslide work at ITC
Landslide work at ITC
 
GIS IN DISASTER MANAGEMENT
GIS IN DISASTER MANAGEMENTGIS IN DISASTER MANAGEMENT
GIS IN DISASTER MANAGEMENT
 
Remote Sensing and GIS for Natural Hazards Assessment and Disaster Risk Manag...
Remote Sensing and GIS for Natural Hazards Assessment and Disaster Risk Manag...Remote Sensing and GIS for Natural Hazards Assessment and Disaster Risk Manag...
Remote Sensing and GIS for Natural Hazards Assessment and Disaster Risk Manag...
 
Remote sensing in Disaster management
Remote sensing in Disaster managementRemote sensing in Disaster management
Remote sensing in Disaster management
 
EGU_2016_Melis_etal
EGU_2016_Melis_etalEGU_2016_Melis_etal
EGU_2016_Melis_etal
 
MODELLING THE IMPACT OF FLOODING USING GEOGRAPHIC INFORMATION SYSTEM AND REMO...
MODELLING THE IMPACT OF FLOODING USING GEOGRAPHIC INFORMATION SYSTEM AND REMO...MODELLING THE IMPACT OF FLOODING USING GEOGRAPHIC INFORMATION SYSTEM AND REMO...
MODELLING THE IMPACT OF FLOODING USING GEOGRAPHIC INFORMATION SYSTEM AND REMO...
 
Final.Project.Geophysics
Final.Project.GeophysicsFinal.Project.Geophysics
Final.Project.Geophysics
 
Role of GIS in Health Care Management by Dr. Dipti Mukherji
Role of GIS in Health Care Management by Dr. Dipti MukherjiRole of GIS in Health Care Management by Dr. Dipti Mukherji
Role of GIS in Health Care Management by Dr. Dipti Mukherji
 
Comparison of machine learning performance for earthquake prediction in Indon...
Comparison of machine learning performance for earthquake prediction in Indon...Comparison of machine learning performance for earthquake prediction in Indon...
Comparison of machine learning performance for earthquake prediction in Indon...
 

Viewers also liked

Reaching the Community through Re:fresh
Reaching the Community through Re:fresh Reaching the Community through Re:fresh
Reaching the Community through Re:fresh Pastor John Wagner
 
Digital 20297367 s-sri rezeki
Digital 20297367 s-sri rezekiDigital 20297367 s-sri rezeki
Digital 20297367 s-sri rezekiAgus Witono
 
Camden CM-325 Instruction Manual
Camden CM-325 Instruction ManualCamden CM-325 Instruction Manual
Camden CM-325 Instruction ManualJMAC Supply
 
How to keep your child safe on holiday
How to keep your child safe on holidayHow to keep your child safe on holiday
How to keep your child safe on holidayAmb Steve Mbugua
 
eCQM Certification Subgroup Slides July 28 2015
eCQM Certification Subgroup Slides July 28 2015eCQM Certification Subgroup Slides July 28 2015
eCQM Certification Subgroup Slides July 28 2015dczulada
 
Falah Dinullah
Falah DinullahFalah Dinullah
Falah DinullahFaldin59
 
Getting the most out of Amazon RDS investment with Toad for MySQL
Getting the most out of Amazon RDS investment with Toad for MySQLGetting the most out of Amazon RDS investment with Toad for MySQL
Getting the most out of Amazon RDS investment with Toad for MySQLBrad Wulf, MBA
 
raport_capegmini_inwestyjemy_w_dobre_pomysly_ii_edycja_wersja_lekka_final
raport_capegmini_inwestyjemy_w_dobre_pomysly_ii_edycja_wersja_lekka_finalraport_capegmini_inwestyjemy_w_dobre_pomysly_ii_edycja_wersja_lekka_final
raport_capegmini_inwestyjemy_w_dobre_pomysly_ii_edycja_wersja_lekka_finalRafal Szmajser, Ph.D.
 
The Student Room - Press Coverage May - July
The Student Room - Press Coverage May - JulyThe Student Room - Press Coverage May - July
The Student Room - Press Coverage May - JulyJack Wallington
 
Integrated Content System
Integrated Content SystemIntegrated Content System
Integrated Content SystemWELLBEATS
 
Mitsubishi i miev netherlands 2015
Mitsubishi i miev netherlands 2015Mitsubishi i miev netherlands 2015
Mitsubishi i miev netherlands 2015Douglas Millar
 
Pr 1-textbook-1-a neu
Pr 1-textbook-1-a neuPr 1-textbook-1-a neu
Pr 1-textbook-1-a neuAgus Witono
 

Viewers also liked (17)

Reaching the Community through Re:fresh
Reaching the Community through Re:fresh Reaching the Community through Re:fresh
Reaching the Community through Re:fresh
 
CV BIGATI B.Paulin,
CV BIGATI B.Paulin,CV BIGATI B.Paulin,
CV BIGATI B.Paulin,
 
Digital 20297367 s-sri rezeki
Digital 20297367 s-sri rezekiDigital 20297367 s-sri rezeki
Digital 20297367 s-sri rezeki
 
Camden CM-325 Instruction Manual
Camden CM-325 Instruction ManualCamden CM-325 Instruction Manual
Camden CM-325 Instruction Manual
 
How to keep your child safe on holiday
How to keep your child safe on holidayHow to keep your child safe on holiday
How to keep your child safe on holiday
 
Imiev uk 2011
Imiev uk 2011Imiev uk 2011
Imiev uk 2011
 
eCQM Certification Subgroup Slides July 28 2015
eCQM Certification Subgroup Slides July 28 2015eCQM Certification Subgroup Slides July 28 2015
eCQM Certification Subgroup Slides July 28 2015
 
Heimbruch 2015
Heimbruch 2015Heimbruch 2015
Heimbruch 2015
 
Britania annual report_2014
Britania annual report_2014Britania annual report_2014
Britania annual report_2014
 
Falah Dinullah
Falah DinullahFalah Dinullah
Falah Dinullah
 
Getting the most out of Amazon RDS investment with Toad for MySQL
Getting the most out of Amazon RDS investment with Toad for MySQLGetting the most out of Amazon RDS investment with Toad for MySQL
Getting the most out of Amazon RDS investment with Toad for MySQL
 
raport_capegmini_inwestyjemy_w_dobre_pomysly_ii_edycja_wersja_lekka_final
raport_capegmini_inwestyjemy_w_dobre_pomysly_ii_edycja_wersja_lekka_finalraport_capegmini_inwestyjemy_w_dobre_pomysly_ii_edycja_wersja_lekka_final
raport_capegmini_inwestyjemy_w_dobre_pomysly_ii_edycja_wersja_lekka_final
 
The Student Room - Press Coverage May - July
The Student Room - Press Coverage May - JulyThe Student Room - Press Coverage May - July
The Student Room - Press Coverage May - July
 
Imeiv japan 2015
Imeiv japan 2015Imeiv japan 2015
Imeiv japan 2015
 
Integrated Content System
Integrated Content SystemIntegrated Content System
Integrated Content System
 
Mitsubishi i miev netherlands 2015
Mitsubishi i miev netherlands 2015Mitsubishi i miev netherlands 2015
Mitsubishi i miev netherlands 2015
 
Pr 1-textbook-1-a neu
Pr 1-textbook-1-a neuPr 1-textbook-1-a neu
Pr 1-textbook-1-a neu
 

Similar to Gis application to the projects

GPS & ArcGIS for mapping of communicable diseases-1.pptx
GPS & ArcGIS for mapping of communicable diseases-1.pptxGPS & ArcGIS for mapping of communicable diseases-1.pptx
GPS & ArcGIS for mapping of communicable diseases-1.pptxMubarraAzam
 
Asthma And Air Pollution In The Bronx Methodological And Data Considerations...
Asthma And Air Pollution In The Bronx  Methodological And Data Considerations...Asthma And Air Pollution In The Bronx  Methodological And Data Considerations...
Asthma And Air Pollution In The Bronx Methodological And Data Considerations...Laurie Smith
 
Gis and gps in plant biosecurity
Gis and gps in plant biosecurityGis and gps in plant biosecurity
Gis and gps in plant biosecurityNageshb11
 
Geospatial health - Emerging themes
Geospatial health - Emerging themesGeospatial health - Emerging themes
Geospatial health - Emerging themesSTN IMPRO
 
ABSTRACT Public Health GIS- DST NATIONAL PROJECT
ABSTRACT Public Health GIS- DST NATIONAL PROJECTABSTRACT Public Health GIS- DST NATIONAL PROJECT
ABSTRACT Public Health GIS- DST NATIONAL PROJECTIyyanki V Muralikrishna
 
Ijerph 18-02336-v2
Ijerph 18-02336-v2Ijerph 18-02336-v2
Ijerph 18-02336-v2DrLokesha1
 
Geographic information system in public health
Geographic information system in public healthGeographic information system in public health
Geographic information system in public healthBPKIHS
 
FULLYFINAL GIS CHOUBEYJI.pptx
FULLYFINAL GIS CHOUBEYJI.pptxFULLYFINAL GIS CHOUBEYJI.pptx
FULLYFINAL GIS CHOUBEYJI.pptxAkashBhagat34
 
GISpublichealthtsou.ppt
GISpublichealthtsou.pptGISpublichealthtsou.ppt
GISpublichealthtsou.pptGideonMulla
 
Geospatial Mapping of Health Facilities in Nangere Local Government Area of Y...
Geospatial Mapping of Health Facilities in Nangere Local Government Area of Y...Geospatial Mapping of Health Facilities in Nangere Local Government Area of Y...
Geospatial Mapping of Health Facilities in Nangere Local Government Area of Y...ijtsrd
 
Health Informatics and Public Health Leadership.pdf
Health Informatics and Public Health Leadership.pdfHealth Informatics and Public Health Leadership.pdf
Health Informatics and Public Health Leadership.pdfBrian712019
 
Spatial Disparities in Access and Use of Rehabilitation Services in Northern ...
Spatial Disparities in Access and Use of Rehabilitation Services in Northern ...Spatial Disparities in Access and Use of Rehabilitation Services in Northern ...
Spatial Disparities in Access and Use of Rehabilitation Services in Northern ...IJSRP Journal
 
Application of computers in Epidemiology.pptx
Application of computers in Epidemiology.pptxApplication of computers in Epidemiology.pptx
Application of computers in Epidemiology.pptxiqbal606601
 
AIDS/HIV Awareness through Maps and Mashups
AIDS/HIV Awareness through Maps and MashupsAIDS/HIV Awareness through Maps and Mashups
AIDS/HIV Awareness through Maps and MashupsSusieQuinn
 
INTEGRATION OF REMOTE SENSING DATA WITH GEOGRAPHIC INFORMATION SYSTEM (GIS): ...
INTEGRATION OF REMOTE SENSING DATA WITH GEOGRAPHIC INFORMATION SYSTEM (GIS): ...INTEGRATION OF REMOTE SENSING DATA WITH GEOGRAPHIC INFORMATION SYSTEM (GIS): ...
INTEGRATION OF REMOTE SENSING DATA WITH GEOGRAPHIC INFORMATION SYSTEM (GIS): ...ijmpict
 
Covid-19: Do we need to plan for the long haul?
Covid-19: Do we need to plan for the long haul?Covid-19: Do we need to plan for the long haul?
Covid-19: Do we need to plan for the long haul?Laurent Mercier
 

Similar to Gis application to the projects (20)

Geographic information system – an introduction
Geographic information system – an introductionGeographic information system – an introduction
Geographic information system – an introduction
 
GPS & ArcGIS for mapping of communicable diseases-1.pptx
GPS & ArcGIS for mapping of communicable diseases-1.pptxGPS & ArcGIS for mapping of communicable diseases-1.pptx
GPS & ArcGIS for mapping of communicable diseases-1.pptx
 
Asthma And Air Pollution In The Bronx Methodological And Data Considerations...
Asthma And Air Pollution In The Bronx  Methodological And Data Considerations...Asthma And Air Pollution In The Bronx  Methodological And Data Considerations...
Asthma And Air Pollution In The Bronx Methodological And Data Considerations...
 
Gis and gps in plant biosecurity
Gis and gps in plant biosecurityGis and gps in plant biosecurity
Gis and gps in plant biosecurity
 
Geospatial health - Emerging themes
Geospatial health - Emerging themesGeospatial health - Emerging themes
Geospatial health - Emerging themes
 
Gis
GisGis
Gis
 
ABSTRACT Public Health GIS- DST NATIONAL PROJECT
ABSTRACT Public Health GIS- DST NATIONAL PROJECTABSTRACT Public Health GIS- DST NATIONAL PROJECT
ABSTRACT Public Health GIS- DST NATIONAL PROJECT
 
Ijerph 18-02336-v2
Ijerph 18-02336-v2Ijerph 18-02336-v2
Ijerph 18-02336-v2
 
GIS KD.pdf
GIS KD.pdfGIS KD.pdf
GIS KD.pdf
 
Geographic information system in public health
Geographic information system in public healthGeographic information system in public health
Geographic information system in public health
 
FULLYFINAL GIS CHOUBEYJI.pptx
FULLYFINAL GIS CHOUBEYJI.pptxFULLYFINAL GIS CHOUBEYJI.pptx
FULLYFINAL GIS CHOUBEYJI.pptx
 
GISpublichealthtsou.ppt
GISpublichealthtsou.pptGISpublichealthtsou.ppt
GISpublichealthtsou.ppt
 
Geospatial Mapping of Health Facilities in Nangere Local Government Area of Y...
Geospatial Mapping of Health Facilities in Nangere Local Government Area of Y...Geospatial Mapping of Health Facilities in Nangere Local Government Area of Y...
Geospatial Mapping of Health Facilities in Nangere Local Government Area of Y...
 
EPIDEMIOLOGICAL DATA.docx
EPIDEMIOLOGICAL DATA.docxEPIDEMIOLOGICAL DATA.docx
EPIDEMIOLOGICAL DATA.docx
 
Health Informatics and Public Health Leadership.pdf
Health Informatics and Public Health Leadership.pdfHealth Informatics and Public Health Leadership.pdf
Health Informatics and Public Health Leadership.pdf
 
Spatial Disparities in Access and Use of Rehabilitation Services in Northern ...
Spatial Disparities in Access and Use of Rehabilitation Services in Northern ...Spatial Disparities in Access and Use of Rehabilitation Services in Northern ...
Spatial Disparities in Access and Use of Rehabilitation Services in Northern ...
 
Application of computers in Epidemiology.pptx
Application of computers in Epidemiology.pptxApplication of computers in Epidemiology.pptx
Application of computers in Epidemiology.pptx
 
AIDS/HIV Awareness through Maps and Mashups
AIDS/HIV Awareness through Maps and MashupsAIDS/HIV Awareness through Maps and Mashups
AIDS/HIV Awareness through Maps and Mashups
 
INTEGRATION OF REMOTE SENSING DATA WITH GEOGRAPHIC INFORMATION SYSTEM (GIS): ...
INTEGRATION OF REMOTE SENSING DATA WITH GEOGRAPHIC INFORMATION SYSTEM (GIS): ...INTEGRATION OF REMOTE SENSING DATA WITH GEOGRAPHIC INFORMATION SYSTEM (GIS): ...
INTEGRATION OF REMOTE SENSING DATA WITH GEOGRAPHIC INFORMATION SYSTEM (GIS): ...
 
Covid-19: Do we need to plan for the long haul?
Covid-19: Do we need to plan for the long haul?Covid-19: Do we need to plan for the long haul?
Covid-19: Do we need to plan for the long haul?
 

Recently uploaded

Build your next Gen AI Breakthrough - April 2024
Build your next Gen AI Breakthrough - April 2024Build your next Gen AI Breakthrough - April 2024
Build your next Gen AI Breakthrough - April 2024Neo4j
 
08448380779 Call Girls In Diplomatic Enclave Women Seeking Men
08448380779 Call Girls In Diplomatic Enclave Women Seeking Men08448380779 Call Girls In Diplomatic Enclave Women Seeking Men
08448380779 Call Girls In Diplomatic Enclave Women Seeking MenDelhi Call girls
 
Benefits Of Flutter Compared To Other Frameworks
Benefits Of Flutter Compared To Other FrameworksBenefits Of Flutter Compared To Other Frameworks
Benefits Of Flutter Compared To Other FrameworksSoftradix Technologies
 
Beyond Boundaries: Leveraging No-Code Solutions for Industry Innovation
Beyond Boundaries: Leveraging No-Code Solutions for Industry InnovationBeyond Boundaries: Leveraging No-Code Solutions for Industry Innovation
Beyond Boundaries: Leveraging No-Code Solutions for Industry InnovationSafe Software
 
Scanning the Internet for External Cloud Exposures via SSL Certs
Scanning the Internet for External Cloud Exposures via SSL CertsScanning the Internet for External Cloud Exposures via SSL Certs
Scanning the Internet for External Cloud Exposures via SSL CertsRizwan Syed
 
Key Features Of Token Development (1).pptx
Key  Features Of Token  Development (1).pptxKey  Features Of Token  Development (1).pptx
Key Features Of Token Development (1).pptxLBM Solutions
 
Swan(sea) Song – personal research during my six years at Swansea ... and bey...
Swan(sea) Song – personal research during my six years at Swansea ... and bey...Swan(sea) Song – personal research during my six years at Swansea ... and bey...
Swan(sea) Song – personal research during my six years at Swansea ... and bey...Alan Dix
 
Connect Wave/ connectwave Pitch Deck Presentation
Connect Wave/ connectwave Pitch Deck PresentationConnect Wave/ connectwave Pitch Deck Presentation
Connect Wave/ connectwave Pitch Deck PresentationSlibray Presentation
 
Unlocking the Potential of the Cloud for IBM Power Systems
Unlocking the Potential of the Cloud for IBM Power SystemsUnlocking the Potential of the Cloud for IBM Power Systems
Unlocking the Potential of the Cloud for IBM Power SystemsPrecisely
 
Injustice - Developers Among Us (SciFiDevCon 2024)
Injustice - Developers Among Us (SciFiDevCon 2024)Injustice - Developers Among Us (SciFiDevCon 2024)
Injustice - Developers Among Us (SciFiDevCon 2024)Allon Mureinik
 
Pigging Solutions in Pet Food Manufacturing
Pigging Solutions in Pet Food ManufacturingPigging Solutions in Pet Food Manufacturing
Pigging Solutions in Pet Food ManufacturingPigging Solutions
 
Streamlining Python Development: A Guide to a Modern Project Setup
Streamlining Python Development: A Guide to a Modern Project SetupStreamlining Python Development: A Guide to a Modern Project Setup
Streamlining Python Development: A Guide to a Modern Project SetupFlorian Wilhelm
 
Tech-Forward - Achieving Business Readiness For Copilot in Microsoft 365
Tech-Forward - Achieving Business Readiness For Copilot in Microsoft 365Tech-Forward - Achieving Business Readiness For Copilot in Microsoft 365
Tech-Forward - Achieving Business Readiness For Copilot in Microsoft 3652toLead Limited
 
Pigging Solutions Piggable Sweeping Elbows
Pigging Solutions Piggable Sweeping ElbowsPigging Solutions Piggable Sweeping Elbows
Pigging Solutions Piggable Sweeping ElbowsPigging Solutions
 
Unblocking The Main Thread Solving ANRs and Frozen Frames
Unblocking The Main Thread Solving ANRs and Frozen FramesUnblocking The Main Thread Solving ANRs and Frozen Frames
Unblocking The Main Thread Solving ANRs and Frozen FramesSinan KOZAK
 
Making_way_through_DLL_hollowing_inspite_of_CFG_by_Debjeet Banerjee.pptx
Making_way_through_DLL_hollowing_inspite_of_CFG_by_Debjeet Banerjee.pptxMaking_way_through_DLL_hollowing_inspite_of_CFG_by_Debjeet Banerjee.pptx
Making_way_through_DLL_hollowing_inspite_of_CFG_by_Debjeet Banerjee.pptxnull - The Open Security Community
 
Are Multi-Cloud and Serverless Good or Bad?
Are Multi-Cloud and Serverless Good or Bad?Are Multi-Cloud and Serverless Good or Bad?
Are Multi-Cloud and Serverless Good or Bad?Mattias Andersson
 
Understanding the Laravel MVC Architecture
Understanding the Laravel MVC ArchitectureUnderstanding the Laravel MVC Architecture
Understanding the Laravel MVC ArchitecturePixlogix Infotech
 
08448380779 Call Girls In Friends Colony Women Seeking Men
08448380779 Call Girls In Friends Colony Women Seeking Men08448380779 Call Girls In Friends Colony Women Seeking Men
08448380779 Call Girls In Friends Colony Women Seeking MenDelhi Call girls
 

Recently uploaded (20)

Build your next Gen AI Breakthrough - April 2024
Build your next Gen AI Breakthrough - April 2024Build your next Gen AI Breakthrough - April 2024
Build your next Gen AI Breakthrough - April 2024
 
08448380779 Call Girls In Diplomatic Enclave Women Seeking Men
08448380779 Call Girls In Diplomatic Enclave Women Seeking Men08448380779 Call Girls In Diplomatic Enclave Women Seeking Men
08448380779 Call Girls In Diplomatic Enclave Women Seeking Men
 
Benefits Of Flutter Compared To Other Frameworks
Benefits Of Flutter Compared To Other FrameworksBenefits Of Flutter Compared To Other Frameworks
Benefits Of Flutter Compared To Other Frameworks
 
Beyond Boundaries: Leveraging No-Code Solutions for Industry Innovation
Beyond Boundaries: Leveraging No-Code Solutions for Industry InnovationBeyond Boundaries: Leveraging No-Code Solutions for Industry Innovation
Beyond Boundaries: Leveraging No-Code Solutions for Industry Innovation
 
Scanning the Internet for External Cloud Exposures via SSL Certs
Scanning the Internet for External Cloud Exposures via SSL CertsScanning the Internet for External Cloud Exposures via SSL Certs
Scanning the Internet for External Cloud Exposures via SSL Certs
 
Key Features Of Token Development (1).pptx
Key  Features Of Token  Development (1).pptxKey  Features Of Token  Development (1).pptx
Key Features Of Token Development (1).pptx
 
Swan(sea) Song – personal research during my six years at Swansea ... and bey...
Swan(sea) Song – personal research during my six years at Swansea ... and bey...Swan(sea) Song – personal research during my six years at Swansea ... and bey...
Swan(sea) Song – personal research during my six years at Swansea ... and bey...
 
Connect Wave/ connectwave Pitch Deck Presentation
Connect Wave/ connectwave Pitch Deck PresentationConnect Wave/ connectwave Pitch Deck Presentation
Connect Wave/ connectwave Pitch Deck Presentation
 
Unlocking the Potential of the Cloud for IBM Power Systems
Unlocking the Potential of the Cloud for IBM Power SystemsUnlocking the Potential of the Cloud for IBM Power Systems
Unlocking the Potential of the Cloud for IBM Power Systems
 
Injustice - Developers Among Us (SciFiDevCon 2024)
Injustice - Developers Among Us (SciFiDevCon 2024)Injustice - Developers Among Us (SciFiDevCon 2024)
Injustice - Developers Among Us (SciFiDevCon 2024)
 
Pigging Solutions in Pet Food Manufacturing
Pigging Solutions in Pet Food ManufacturingPigging Solutions in Pet Food Manufacturing
Pigging Solutions in Pet Food Manufacturing
 
E-Vehicle_Hacking_by_Parul Sharma_null_owasp.pptx
E-Vehicle_Hacking_by_Parul Sharma_null_owasp.pptxE-Vehicle_Hacking_by_Parul Sharma_null_owasp.pptx
E-Vehicle_Hacking_by_Parul Sharma_null_owasp.pptx
 
Streamlining Python Development: A Guide to a Modern Project Setup
Streamlining Python Development: A Guide to a Modern Project SetupStreamlining Python Development: A Guide to a Modern Project Setup
Streamlining Python Development: A Guide to a Modern Project Setup
 
Tech-Forward - Achieving Business Readiness For Copilot in Microsoft 365
Tech-Forward - Achieving Business Readiness For Copilot in Microsoft 365Tech-Forward - Achieving Business Readiness For Copilot in Microsoft 365
Tech-Forward - Achieving Business Readiness For Copilot in Microsoft 365
 
Pigging Solutions Piggable Sweeping Elbows
Pigging Solutions Piggable Sweeping ElbowsPigging Solutions Piggable Sweeping Elbows
Pigging Solutions Piggable Sweeping Elbows
 
Unblocking The Main Thread Solving ANRs and Frozen Frames
Unblocking The Main Thread Solving ANRs and Frozen FramesUnblocking The Main Thread Solving ANRs and Frozen Frames
Unblocking The Main Thread Solving ANRs and Frozen Frames
 
Making_way_through_DLL_hollowing_inspite_of_CFG_by_Debjeet Banerjee.pptx
Making_way_through_DLL_hollowing_inspite_of_CFG_by_Debjeet Banerjee.pptxMaking_way_through_DLL_hollowing_inspite_of_CFG_by_Debjeet Banerjee.pptx
Making_way_through_DLL_hollowing_inspite_of_CFG_by_Debjeet Banerjee.pptx
 
Are Multi-Cloud and Serverless Good or Bad?
Are Multi-Cloud and Serverless Good or Bad?Are Multi-Cloud and Serverless Good or Bad?
Are Multi-Cloud and Serverless Good or Bad?
 
Understanding the Laravel MVC Architecture
Understanding the Laravel MVC ArchitectureUnderstanding the Laravel MVC Architecture
Understanding the Laravel MVC Architecture
 
08448380779 Call Girls In Friends Colony Women Seeking Men
08448380779 Call Girls In Friends Colony Women Seeking Men08448380779 Call Girls In Friends Colony Women Seeking Men
08448380779 Call Girls In Friends Colony Women Seeking Men
 

Gis application to the projects

  • 1. Disasters, 2003, 27(2): 127–140 © Overseas Development Institute, 2003. Published by Blackwell Publishing, 9600 Garsington Road, Oxford OX4 2DQ, UK and 350 Main Street, Malden, MA 02148, USA. The Application of Geographic Information Systems and Global Positioning Systems in Humanitarian Emergencies: Lessons Learned, Programme Implications and Future Research Reinhard Kaiser Paul B. Spiegel Centers for Disease Control CDC and Prevention (CDC) Alden K. Henderson Michael L. Gerber CDC CDC Geographic information systems (GIS), global positioning systems and remote sensing have been increasingly used in public health settings since the 1990s, but application of these methods in humanitarian emergencies has been less documented. Recent areas of application of GIS methods in humanitarian emergencies include hazard, vulnerability, and risk assessments; rapid assessment and survey methods; disease distribution and outbreak investigations; planning and implementation of health information systems; data and programme integration; and programme monitoring and evaluation. The main use of GIS in these areas is to provide maps for decision- making and advocacy, which allow overlaying types of information that may not normally be linked. GIS is also used to improve data collection in the field (for example, for rapid health assessments or mortality surveys). Development of GIS methods requires further research. Although GIS methods may save resources and reduce error, initial investment in equipment and capacity building may be substantial. Especially in humanitarian emergencies, equipment and methodologies must be practical and appropriate for field use. Add-on software to process GIS data needs to be developed and modified. As equipment becomes more user-friendly and costs decrease, GIS will become more of a routine tool for humanitarian aid organisations in humanitarian emergencies, and new and innovative uses will evolve. Keywords: geographic information, global positioning systems, remote sensing, satellite imagery, humanitarian emergencies. Introduction The last decades have seen the introduction of geographic information systems (GIS) in diverse public health settings. GIS methods include global positioning systems (GPS) and remote sensing. Long used as planning and data collection tools by military and civilian institutions, these technologies are now widely applied to epidemiology and public health in developed countries and, to a lesser extent, in underdeveloped countries. Most international health applications of GIS methods have been in
  • 2. R. Kaiser, P.B. Spiegel, A.K. Henderson and M.L. Gerber128 outbreak investigations and epidemiologic studies of infectious diseases. These uses have been well documented in the literature and are gaining acceptance as valuable epidemiologic tools (Vine et al., 1997; Moore and Carpenter, 1999; Robinson, 2000). Applications of GIS methods in humanitarian emergencies (HE) are less well documented. Use of GIS methods for resource allocation, planning and logistics has become a standard component in major HE (in Kosovo, Sierra Leone and Afghanistan). Recent work by the International Emergency and Refugee Health Branch (IERHB) at the Division of Emergency and Environmental Health Services, Centers for Disease Control and Prevention (CDC), and by other organisations have used GIS methods in diverse ways to complement and enhance epidemiologic methods in HE, such as conducting rapid health assessments or estimating mortality. In this report, we document current uses of GIS methods in HE, and discuss lessons learned, programme implications and future research needs. Background The most famous example linking the science of epidemiology with the use of geographic information occurred almost 150 years ago, when John Snow investigated London’s cholera outbreak in 1854 (Snow, 1855). Today, GIS and satellite data are used to examine the relation between cholera epidemics and the changing patterns of warm-water ocean currents (Colwell, 1996). A Medline search in January 2003 showed the first public health article using GIS published in 1986, coinciding with the time GIS became available on personal computers; 94 per cent of the 255 articles in the search were published in 1995 and later. GIS and GPS are powerful computerised tools to examine the spatial location component of epidemiology and link it with person and time information. GIS has been defined as a computer system that stores and links non-geographic attributes or geographically referenced data with graphic map features to allow for a wide range of information processing and display operations, as well as map production, analysis and modelling (Tim, 1995). GPS is a constellation of earth-orbiting US-government satellites that transmit information to hand-held or built-in receivers that can calculate a location with a potential precision of one square metre (longitude, latitude and elevation) (CDC, 1993). Remote sensing or satellite imagery refers to the data obtained by sensors on earth-orbiting satellites. Remote sensing data can be used in GIS to show animal and vector habitats; surface areas of water, deserts and forests; and human activity (settlements, roads, land usage) (CDC, 1993). These technologies are now widely used in the developed world for epidemiology and public health (Vine et al., 1997; Moore and Carpenter, 1999; Robinson, 2000). Functions of GIS encompass mapping of the location and distribution of disease in either endemic settings or outbreak investigations (Wartenberg, 2001). GIS has added new ways of presenting information collected with traditional epidemiologic methods. Simple thematic maps can be used for decision- making and advocacy. GIS allows overlaying of maps to link information from various diseases or health sectors that may not usually be linked and can help with interpretation of data. A potential example is overlaying of information on food distribution, acute malnutrition, micronutrient deficiencies and a measles outbreak. GIS maps and satellite imagery have advantages over conventional maps because more information can be updated frequently and distributed rapidly through electronic
  • 3. The Application of GIS and GPS in Humanitarian Emergencies 129 devices including the Internet (Foresman, 1999). Data collection (for example, during rapid assessments or surveys) can be faster, more accurate and may require fewer resources once equipment has been purchased (Melnick and Fleming, 1999). GIS methods may increase accuracy (through improving random sample selection) and precision (time-saving methods may allow increasing sample size) (Roper and Mays, 1999). Other applications of GIS may not only improve data presentation, but enhance epidemiologic methods; those include time series modelling (diffusion of disease, changes in vector habitat, seasonality of cyclical patterns in incidence) and spatial correlation to examine risk factors for disease, accessibility modelling for health service planning (O’Dwyer and Burton, 1998). GIS methods in international health have been used in the research, outbreak investigation and control of vector-borne diseases (Kitron, 1994; Dale et al., 1997) with the main focus on malaria (Hay et al., 2000), as well as tuberculosis (Porter, 1999; Tanser and Wilkinson, 1999), helminthic infections, including schistosomiasis (Brooker and Michael, 2000; Brooker et al., 2000), leptospirosis (Barcellos and Sabroza, 2001), gonorrhea (Becker et al., 1998) and hepatitis C (Mujeeb et al., 2000). Other applications in international settings included prevention of diarrhoeal disease (Njemanze et al., 1999), access to primary health-care (Perry and Gesler, 2000), mapping of population movements for public health management (Stern, 1998) and health inequalities research (Szwarcwald et al., 2000; Mitchell et al., 2002). GIS mapping and remotely sensed data also are being used to assess and model catastrophic events such as earthquakes, toxic runoff, and toxic plumes (Croner et al., 1996). For example, GIS mapping of earthquake-related deaths and hospital admissions from the 1994 earthquake in Northridge, California, showed that factors such as age and activity of people during the earthquake may be as important as seismic features in predicting injury from earthquakes (Peek-Asa et al., 2000). Spatial statistics for public health application is now a rapidly evolving field. Methods include calculation of crude, adjusted and smoothed rates; tests for spatial randomness; and regression analysis to examine associations between geographic distribution of exposure and disease (Kulldorff, 1999). Statistical models may include distance-oriented measures (for example, distance to the nearest clinic or water source) or geospatial smoothing techniques similar to those used in time-series modelling. An example is inverse density-weighted smoothing, where more weight is given to closer samples and less to those that are farther away, resulting in reduced variability of estimates (Isaaks and Srivastava, 1989). Statistical techniques also are available to analyse spatio-temporal data (Kulldorff, 1999) (for example, to examine distribution of vector habitats and malaria over time (Dale et al., 1997)). Uses of GIS in humanitarian emergencies We define a humanitarian emergency as a situation affecting large civilian populations and usually involving a combination of conflict, food insecurities and population displacement resulting in significant excess mortality or morbidity. We have identified different uses of GIS that support and enhance epidemiologic methods in humanitarian emergencies. Hazard, vulnerability and risk assessments are used as early warning systems to prevent or mitigate emergencies resulting from famine. GIS can be a component of rapid assessments to identify the magnitude of and resources needed for an emergency. GIS methods can also be used in site planning and to enhance survey
  • 4. R. Kaiser, P.B. Spiegel, A.K. Henderson and M.L. Gerber130 methods, investigate disease outbreaks, establish health information systems, integrate data and programmes and monitor and evaluate programmes. Both rapid assessment and survey methods may use households as sampling units and be similar in outcomes studied as well as GIS methods used. The initial equipment and capacity building to use GPS/GIS technology in emergency humanitarian activities can range from using the available computer and printer, obtaining shareware from the internet and reallocating personnel to collect data as the need arises, to acquiring state-of-the-art computers, printers and GIS instruments, purchasing the most recent versions of sophisticated GIS software, obtaining training to use these resources and having dedicated personnel to run the system and collect data. Equipment, capacity building and personnel (assuming one full salary) may currently cost up to US$100,000. At the low end, a user with some knowledge of surveying and navigation could use a basic computer, a GIS instrument that obtains latitude and longitude of features and GIS shareware software for less than $2,000. Through our experience in working in HE, most organisations have a computer with sufficient power to run GIS software that allows entry of latitude and longitude of features and draws and prints maps, but may not have a GPS unit. However, GIS/GPS have become more common over the years and the hardware and software prices have dropped. It is hoped that more organisations will purchase and use this equipment and software. We are currently developing shareware software that will enable people to use GIS/GPS to enumerate the HE-affected population and, at a later stage of software development, conduct rapid assessments of vaccine coverage, malnutrition, health conditions and sanitation. Use of GIS in HE encompasses work under extreme field conditions. Our experience with several different types of GPS instruments is that they worked with minimal performance loss under high temperatures (above 40°C for several hours), through sandstorms and torrential rain, and after being dropped or bounced around in cars and in backpacks. Data were not lost during these conditions or even when the batteries expired. GIS has now become essential to the planning for, response to, and monitoring of HE for many organisations active in HE. Many United Nations (UN) organisations now have specific GIS units: the WHO Health Map unit (WHO, 2002), the UN High Commissioner for Refugees’ (UNHCR) geographic information and mapping unit (UNHCR, 2002) and the World Food Program’s vulnerability assessment mapping unit (WFP, 2002). The UN Office for the Coordination of Humanitarian Affairs (OCHA) also provides mapping services in conflict areas (OCHA, 2002a). Recent information systems in emergencies have been designed as inter-agency projects using GIS such as the Sierra Leone Information System (UNHCR/OCHA, 2002), the Afghanistan Information Management Service (AIMS) (UNAMA, 2002) and the Humanitarian Information Centers (HIC) established by OCHA in several countries surrounding Iraq (OCHA, 2003). Donor organisations are increasingly adding GIS capacity to their programmes. In the US, both the State Department and the US Agency for International Development (USAID) have added GIS capacity to their HE programmes (one example is in Guinea (USAID, 2003)) and are increasingly providing funds to build such capacity in NGOs and other implementing partners. Similar initiatives are taking place in Europe (for example, European Commission Humanitarian Aid Office (ECHO, 2003), UK Department for International Development (DFID, 2003), Swedish International Development Cooperation Agency (SIDA, 2003)) and other donor organisations active in HE. As the importance of GIS increasingly becomes
  • 5. The Application of GIS and GPS in Humanitarian Emergencies 131 recognised, the way it is used in HE will quickly evolve. Below are documented the following current uses of GIS in HE. Hazard, vulnerability and risk assessments Hazard assessment has been used on a continental scale in Africa to identify and predict drought through the analysis of long-term trend in vegetation patterns and its relation with the El Niño/Southern Oscillation (ENSO) weather pattern (Eastman et al., 1997). GIS has also been a component of vulnerability assessments in many different African countries such as the recent severe famine in southern Africa. Food security mapping examines the degree to which a population or region is susceptible to a range of hazards that threaten food supplies or for which food assistance is required. For example, major parts of Africa are affected by a severe food crisis that was estimated in December 2002 to affect 38 million people (WFP, 2002). The crisis is aggravated by the HIV/AIDS epidemic that has a direct impact on food security and nutrition for individuals, households and communities (OCHA, 2002b). Vulnerability mapping and GIS risk assessment methods have been used to design and develop an integrated computer system for famine early warning (Marsh et al., 1994). USAID is funding a famine early warning system that is based mainly on two types of satellite imagery: normalised difference vegetation index and meteorological satellite rainfall estimation (FEWS, 2003). The normalised difference vegetation index provides an indication of changes in vegetation in response to biophysical conditions, including plant type, weather and soil, whose main use is to compare the current state of vegetation with previous time periods to detect anomalous conditions (for example, the same time in an average year or a reference year). Meteorological satellite rainfall estimation imagery uses satellite data; global telecommunication systems (GTS) gauge rain reports; model analyses of wind, topography and relative humidity; and an algorithm that takes into account geography and seasonality. The result is a spatial estimate of rainfall. The main use of these images is to compare the current state of rainfall with previous time periods to detect anomalous conditions (FEWS, 2003). These tools assist decision- makers to determine food security and predict how many people will need food aid to prevent or mitigate famine emergencies. Risk assessment makes predictions on the morbidity or mortality by examining the interaction between a hazard and the vulnerability of a population. For example, the number of people at risk for malnutrition and malnutrition-related death expected from the estimated distribution of drought severity factors and individual factors of vulnerability (for example, socio-economic factors, loss of food access) was mapped during the Ethiopian famine in 1984 (Eastman et al., 1997). This project could have benefited from GIS-based mapping techniques (for an example of GIS use in the current context of Ethiopian drought and food insecurity see also section on ‘Data and programme integration’). Rapid assessments In the acute phase of HE, rapid assessments help to determine the magnitude and severity of the situation, the amount of resources needed, as well as the need and feasibility of an intervention (MSF, 1997). GIS methods can be used to map an area for site planning, including information about environmental conditions; transport
  • 6. R. Kaiser, P.B. Spiegel, A.K. Henderson and M.L. Gerber132 routes; habitable land; and availability of water, food and fuel. Additional information, such as distance from the household to nearest health clinic, food distribution site, drinking-water source or latrines, can be used to assess access of the population to essential services. Decision-makers can use this information for planning and resource allocation (such as water and food distribution sites and latrines) as well as for determining whether certain minimum standards and indicators are being met. Remote sensing maps can also be used to help identify water and fuel sources. In the acute phase of HE, population size estimates are necessary to determine the scope of the emergency and the resources needed and to provide reasonably accurate population denominators for health indicators. In this early stage, systematic random sampling of housing units is usually not feasible. A method called the quadrant has been used in several refugee camps (Henderson and Spiegel, 1999; Brown et al., 2001). It consists of mapping the boundary of the camp, laying a grid of square blocks or quadrants over the camp, randomly selecting square blocks, counting the population in all households (Brown et al., 2001) or a random subsample of households in each randomly selected block (Henderson and Spiegel, 1999). The number of people estimated per square block can then be extrapolated to the total population. GIS and GPS can be used for mapping the area, creating the grid, and locating the selected square blocks. Modern GIS software allows obtaining accurate geographic coordinates of key roads, trails, landmarks, plots and non-residential areas to create a map that includes inhabited space with precise outer limits of the area. However, population estimation methods have not been standardised, and only a few examples have been validated using camp registration data (Henderson and Spiegel, 1999; Brown et al., 2001). Future research questions include the optimal number and size of square blocks, addressing heterogeneity in population density between the square blocks, and methods to deal with partial square blocks at the limits of the camp area. An alternative approach to estimate population size may be distance-based methods such as the T- square method (Espie, 2000), which has not yet been used, in HE. During population estimations, a simple questionnaire can be added for a rapid assessment of the health status of the population (for example, morbidity, mortality, nutrition or vaccination status). Mapping population movements is becoming a standard application of GIS in the acute phase of HE as well as during repatriation and resettlement. Spontaneous population movements may require reassessment of the situation in any phase of an HE. Before population transfers are planned, GIS mapping can help ensure that a secure location is chosen, sufficient water and sanitation facilities exist or can be developed and adequate human and material resources and programmes are in place. For example, in Guinea 2001 an increase in death rates among Sierra Leonean and Liberian refugees was documented after most of them were relocated to new camps, possibly because some refugees were not relocated to individual family shelters as quickly as planned, causing overcrowding of temporary shelters and overburdening of existing facilities (CDC, 2001; UNHCR, 2001). Remote sensing maps and aerial views can also provide rapid information to estimate population sizes and movements in HE. This may be particularly relevant in areas that are not covered by humanitarian agencies — for example, because insecurity does not allow access. In 1994 in Goma, Democratic Republic of Congo, the population size was underestimated when aerial views alone were used, most likely because displaced people without shelter were not included (NAS, 1997). Modern high-resolution remote sensing using thermal imaging can provide additional information that may improve population estimation (for example, fires for cooking
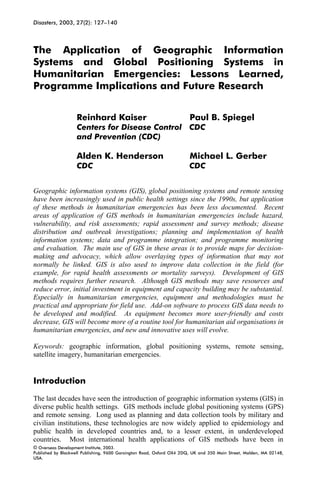
  • 7. The Application of GIS and GPS in Humanitarian Emergencies 133 and heating). Geographic and environmental conditions such as dense tree cover, smoke plumes and topographic features in the area may limit the use of GPS and satellite imagery. Figures 1 and 2 show a satellite image and the corresponding map of the refugee camps and environmental conditions in the Goma area in 1994. Survey methods Two sampling methods have applied GIS and GPS to survey mortality in the Democratic Republic of Congo (IRC, 2000). The first method, a modification of the Expanded Programme on Immunisations (EPI) methodology (Henderson and Figure 1 Spot satellite image and corresponding map (see Figure 2) of the refugee camps and environmental conditions in the Goma area bordering Virunga National Park, Democratic Republic of Congo, 1995 Source: UNHCR Geneva, Copyright: CNES, Eurimage, UNHCR, I-mage Consult, ADG, ICCN, Commission Europeenne, Project Virunga. Illustration courtesy of UNHCR, 2003.
  • 8. R. Kaiser, P.B. Spiegel, A.K. Henderson and M.L. Gerber134 Figure 2 The corresponding map (see Figure 1) of the refugee camps and environmental conditions in the Goma area Sundaresan, 1982) requires that the approximate population size and location of sub- areas (villages or clinic referral areas) or clusters are known. In the first stage, clusters are selected proportional to population size. In the second stage, boundaries of clusters are mapped and a grid of square blocks is laid over the map, random numbers are assigned to square blocks, and a square block is randomly selected as the location where all selected or a sample of households are surveyed. GIS and GPS are used for mapping and to locate the randomly selected square blocks (IRC, 2000). Main questions for future research are the number of clusters (a minimum of 30 clusters has been recommended (Binkin et al., 1995)), the size of the grids and heterogeneity in the outcome of interest between clusters. Design effect and intraclass correlation indicate heterogeneity that can be anticipated on the basis of the nature of the outcome (for example, conflict-related mortality may vary considerably between villages because of the intensity of military activities and destruction) and experiences from previous surveys (Katz and Zeger, 1994). Studies are needed comparing this method with the standard EPI method in terms of quality of the outcome estimate, cost and degree of difficulty. The second method is applied when the overall population can be estimated but population sizes of sub-areas are not known. A random starting location is chosen for sampling along a north-south road. Additional sampling locations are selected at predefined increments to the east and the west, called east-west transects. The process of sampling along east-west transects is repeated at predefined intervals to the north
  • 9. The Application of GIS and GPS in Humanitarian Emergencies 135 and south until the whole survey area is covered. This method oversamples rural areas and undersamples areas with high population density. The radius of each sampling point, defined as the distance between the first and the farthest household of the sampling location, can be used as a weight to adjust for this sampling bias (Roberts and Despines, 1999). GPS are used to locate sampling locations and to measure the radius of the sampling point. Main questions for future research are the number of sampling locations (which also can be called systematic random clusters), and addressing heterogeneity in population density between sampling locations. The distance between sampling locations depends on the size of the survey area and the number of sampling locations. The number of households per sampling location depends on the sample size, the number of sampling locations and the average number of household members eligible for the survey. Validation of this methodology is warranted using standard methods. GIS and palm-pilot-like devices with a GPS unit allow questionnaires to be read and answers recorded electronically, reducing the use of paper. Data can be transferred directly to a computer for analysis. This represents significant time savings and reduces one potential source of error when data are transferred from paper to computer (Roper and Mays, 1999; Selanikio et al., 2002). Furthermore, while doing the survey, key landmarks, such as latrines, water points and health clinics, can be recorded, mapped and used in conjunction with data recorded from households to aid in interpretation. Disease distribution/outbreak investigation GIS improves our ability to investigate infectious disease outbreaks in HE. Clustering can give first hints toward causality within neighbourhoods or according to geographic features. On a larger scale, case distribution maps can help to direct vaccination campaigns. Health Information Systems After a multinational UN force had restored peace in East Timor in 1999, UNHCR asked CDC to implement a health information system in camps for East Timorese refugees in West Timor. Fourteen sentinel sites in four districts were selected for mortality surveillance by size, location and accessibility. The selected sites represented approximately 50,000 (36 per cent) of the 140,000 refugees. The UNHCR geographic information and mapping unit provided maps of the refugee camps in West Timor for the selection process. These maps can be further used to show local or regional trends in mortality over time and relate them to environmental conditions or disease outbreaks (Friedman and Spiegel, 2000). Data and programme integration CDC collected information about nutrition surveys among children under five years of age conducted by various NGOs from September 1999 through June 2000 during the Ethiopian famine. The surveys provided overlaying maps showing where nutrition and health organisations had operated, food had been distributed and acute malnutrition
  • 10. R. Kaiser, P.B. Spiegel, A.K. Henderson and M.L. Gerber136 surveys had been conducted. The maps allowed decision-makers to modify programmes and resource allocation by directing organisations and food delivery to areas of greatest need, and conducting additional surveys where information was lacking (Spiegel et al., 2000). Monitoring and evaluation GIS maps can be used to monitor and evaluate aid programmes in HE. Maps of refugee populations in a camp, water distribution sites and latrines indicate whether or not minimum standards in water supply and sanitation have been achieved (Sphere, 2000). Trends in malnutrition rates and locations of surveys, aid activities and food distributions can show whether resources are adequately allocated or programmes need adjustment according to changing needs of emergency-affected populations. Lessons learned and future research The documented uses of GIS in HE have a variety of programme implications. Many of the documented applications need further methods development. To use GIS methods effectively in HE, potential disadvantages and unanswered questions also have to be addressed in future research. First, GIS/GPS equipment and software can be expensive and require specific skills and training (Melnick and Fleming, 1999). Limitations for developing countries or small organisations may be the costly nature of resources required to generate useful GIS data. Hiring a GIS consultant may allow for the costs associated with purchasing software and training an individual to perform GIS work to be bypassed. Cost-effectiveness and time-saving studies are needed to evaluate the use of GIS methods in HE. GIS users need to be trained in epidemiology to understand that GIS is an enhancement rather than an alternative to traditional epidemiologic methods (Vine et al., 1997). Users should be aware that data in HE may be insufficient or inadequate. One of the main potential limitations of GIS is that of ‘masking’ the underlying problems of data with a cosmetic technology: everything looks neat and tidy, while it is often not. In contrast to tables and graphs, maps do not allow for cross-checking. Therefore, training must include appropriate presentation and interpretation of data to make them comprehensible by decision-makers (Melnick and Fleming, 1999) and to prevent over-emphasising or obscuring evidence (Scholten and de Lepper, 1991). To examine causal relations between exposure and disease, multivariate models are required that control for potential confounders and effect modifiers (Melnick and Fleming, 1999). Maps based on those models can show the predicted geographic variation of disease risk (Clarke et al., 1996). Second, equipment and methodologies have to be practical, durable and appropriate for field use. GIS methods for rapid assessments and surveys need further study, and add-on software needs to be developed and modified to make this method easier to implement. Finally, although geo-coded datasets and satellite imagery become increasingly available in the public domain or commercially (Clarke et al., 1996), most GIS data in HE will still require persons in the field to collect data and interpret it according to the circumstances on the ground.
  • 11. The Application of GIS and GPS in Humanitarian Emergencies 137 Conclusions GIS methods provide improved ways of presenting traditional epidemiologic data as well as new spatio-temporal information that has a variety of implications for programmatic decision-making, monitoring and evaluation in HE. Main limitations and future research needs are related to equipment and training development including the appropriate presentation and interpretation of information. Future use of GIS in HE will increase and become essential. As equipment becomes more user-friendly and costs decrease, more and more humanitarian aid organisations will incorporate it into their basic tools for programming, as well as monitoring and evaluation. New and innovative uses for GIS in HE will also evolve. Acknowledgements We thank Dabo Brantly, Renata Caldwell, Carol Crawford, Thomas Handzel, Allan Hightower, Mary Kay Larson and Sam Posner, all from CDC, for fruitful discussions and inspirations that helped us in writing the paper. We also thank the WHO health map unit and the UNHCR geographic information and mapping unit for providing GIS maps. We also thank the UNHCR geographic information and mapping unit for providing the satellite image and GIS map. References Barcellos, C. and P.C. Sabroza (2001) The Place Behind the Case: Leptospirosis Risks and Associated Environmental Conditions in a Flood-related Outbreak in Rio de Janeiro. Cadernos de Saude Publica 17 (Suppl): 59–67. Becker, K.M., G.E. Glass, W. Brathwaite and J.M. Zenilman (1998) Geographic Epidemiology of Gonorrhea in Baltimore, Maryland, Using a Geographic Information System. American Journal of Epidemiology 147(7): 709–16. Binkin, N., K. Sullivan, N. Staehling and P. Nieburg (1995) Rapid Nutrition Surveys: How Many Clusters Are Enough? Disasters 16(2): 96–9. Brooker, S. and E. Michael (2000) The Potential of Geographical Information Systems and Remote Sensing in the Epidemiology and Control of Human Helminth Infections. Advances in Parasitology 47: 245–88. —— , M. Rowlands, L. Haller, L. Savioli and D.A. Bundy (2000) Towards an Atlas of Human Helminth Infection in Sub-Saharan Africa: The Use of Geographical Information Systems (GIS). Parasitology Today 16(7): 303–7. Brown, V., G. Jacquier, D. Coulombier, S. Balandine, F. Belanger and D. Legros (2001) Rapid Assessment of Population Size by Area Sampling in Disaster Situations. Disasters 25(2): 164–71. CDC (1993) Satellite Surveillance: Geographic Information Technology Used to Prevent and Control Infectious Diseases. CDC/NCID Focus 3, Atlanta. —— (2001) Surveillance of Mortality During a Refugee Crisis – Guinea, January–May 2001. MMWR 50: 1029–32. Clarke, K.C., S.L. McLafferty and B.J. Tempalski (1996) On Epidemiology and Geographic Information Systems: A Review and Discussion of Future Directions. Emerging Infectious Diseases 2(2): 85–92. Colwell, R.R. (1996) Global Climate and Infectious Disease: The Cholera Paradigm. Science 274(5295): 2025–31.
  • 12. R. Kaiser, P.B. Spiegel, A.K. Henderson and M.L. Gerber138 Croner, C.M., J. Sperling and F.R. Broome (1996) Geographic Information Systems (GIS): New Perspectives in Understanding Human Health and Environmental Relationships. Statistics in Medicine 15(17–18): 1961–77. Dale, P.E.R., S.A. Ritchie, B.M.Territo, C.D. Morris, A. Muhar and B.H. Kay (1997) An Overview of Remote Sensing and GIS for Surveillance of Mosquito Vector Habitats and Risk Assessment. Journal of Vector Ecology 23(1): 54–61. DFID (2003) Available at: http://www.dfid.gov.uk/. Eastman, J.R., S. Emani, S. Hulina, H. Jiang, A. Johnson and M. Ramachandran (1997) Applications of Geographic Information Systems (GIS) Technology in Environmental Risk Assessement and Management. Clark Labs/Clark University (in cooperation with UNEP), Worcester. ECHO (2003) Available at: http://europa.eu.int/comm/echo/index_en.htm Espie, E. (2000) Memoire de DEA: Evaluation de trois methods d’estimation de population. Universite V. Segalen, Bordeaux. FEWS (2003) Famine Early Warning System. Available at: http://www.fews.net/resources/ gcontent/gcontent.cfm?submit=y&f=al&g=1000006&d=al&l=en. Foresman, T.W. (1999) Spatial Analysis and Mapping on the Internet. J Public Health Management Practice 5: 57–64. Friedman, C. and P. Spiegel (2000) Mission report to West Timor by UNHCR/CDC Medical Coordinators. January 24–2 March, Atlanta. Hay, S.I., J.A. Omumbo, M.H. Craig and R.W. Snow (2000) Earth Observation, Geographic Information Systems and Plasmodium Falciparum Malaria in Sub-Saharan Africa. Advances in Parasitology 47: 173–215. Henderson, A. and P. Spiegel (1999) Mission Report: Field Testing of a Method to Rapidly Enumerate a Refugee Population. Centers for Disease Control and Prevention, Atlanta. Henderson, R.H. and T. Sundaresan (1982) Cluster sampling to assess immunization coverage: a review of experience with a simplified sampling method. Bulletin of the World Health Organisation 60(2): 253–60. IRC (2000) Mortality in Eastern DRC, Results from Five Mortality Surveys. International Rescue Committee, New York, Isaaks, E.H. and R.M. Srivastava (1989) An Introduction to Applied Geostatistics. Oxford University Press, Oxford. Katz, J. and S.L. Zeger (1994) Estimation of Design Effects in Cluster Surveys. Annals of Epidemiology 4(4): 295–301. Kitron, U. (1994) Landscape Ecology and Epidemiology of Vector-borne Diseases: Tools for Spatial Analysis. Journal of Medical Entomology 35(4): 435–45. Kulldorff, M. (1999) Geographic Information Systems (GIS) and Community Health: Some Statistical Issues. J Public Health Management Practice 5(2): 100–06. Marsh, S.E., C.F. Hutchinson, E.E. Pfirman, S.A. Des Rosiers and C. Van Der Harten (1994) Development of a Computer Workstation for Famine Early Warning and Food Security. Disasters 18(2): 117–29. Melnick, A.L. and D.W. Fleming (1999) Modern Geographic Information Systems – Promise and Pitfalls. J Public Health Management Practice 5: viii–x. Mitchell, R., D. Dorling and M. Shaw (2002) Population Production and Modelling Mortality – An Application of Geographic Information Systems in Health Inequalities Research. Health and Place 8(1): 15–24. Moore, D.A. and T.E. Carpenter (1999) Spatial Analytical Methods and Geographic Information Systems: Use in Health Research and Epidemiology. Epidemiologic Reviews 21(2): 143– 61. MSF (1997) Médecins Sans Frontières: Refugee Health. An Approach to Emergency Situations. Macmillan Education, Basingstoke. Mujeeb, S.A., S. Shahab and A.A. Hyder (2000) Geographical Display of Health Information: Study of Hepatitis C Infection in Karachi, Pakistan. Public Health 114(5): 413–15. NAS (1997) Workshop on the Demography of Forced Migration. Refugee Policy Group, National Academy of Science, Washington.
  • 13. The Application of GIS and GPS in Humanitarian Emergencies 139 Njemanze, P.C., J. Anozie, J.O. Ihenacho, M.J. Russell and A.B. Uwaeziozi (1999) Application of Risk Analysis and Geographic Information System Technologies to the Prevention of Diarrheal Diseases in Nigeria. Am J of Tropical Medicine and Hygiene 61(3): 356–60. OCHA (2002) Background Note on the Humanitarian Crisis in Southern Africa and the HIV/AIDS Pandemic, 1 October. Available at: http://www.reliefweb.int/ocha_ol/ —— (2002) UN Office for the Coordination of Humanitarian Affairs. Available at: http://www.reliefweb.int/ocha_ol/ —— (2003) Humanitarian Information Center for Iraq. Available at: http://www.agoodplacetostart.org/hic_flyer.php O’Dwyer, L.A. and D.L. Burton (1998) Potential Meets Reality: GIS and Public Health Research in Australia. Australian and New Zealand Journal of Public Health 22(7): 819–23. Peek-Asa, C., M.R. Ramirez, K. Shoaf, H. Seligson and J.F. Kraus (2000) GIS Mapping of Earthquake-related Deaths and Hospital Admissions from the 1994 Northridge, California, Earthquake. Annals of Epidemiology 10(1): 5–13. Perry, B. and W. Gesler (2000) Physical Access to Primary Health Care in Andean Bolivia. Social Science and Medicine 50(9): 1177–88. Porter, J.D. (1999) Geographical Information Systems (GIS) and the Tuberculosis DOTS Strategy. Tropical Medicine and International Health 4(10): 631–3. Roberts, L. and M. Despines (1999) Mortality in the Democratic Republic of the Congo. Lancet 353(9171): 2249–50. Robinson, T.P. (2000) Spatial Statistics and Geographical Information Systems in Epidemiology and Public Health. Advances in Parasitology 47: 81–128. Roper, W.L. and G.P. Mays (1999). GIS and Public Health Policy: A New Frontier for Improving Community Health. J Public Health Management Practice 5: vi–vii. Scholten, H.J. and M.J. de Lepper (1991) The Benefits of the Application of Geographical Information Systems in Public and Environmental Health. World Health Statistics Quarterly – Rapport Trimestriel de Statistiques Sanitaires Mondiales 44(3): 160–70. Selanikio, J.D., T.M. Kemmer, M. Bovill and K. Geisler (2002) Mobile Computing in the Humanitarian Assistance Setting: An Introduction and some First Steps. Journal of Medical Systems 26(2): 113–25. SIDA (2003) Available at http://www.sida.se Snow, J. (1855) On the Mode of Communication of Cholera. Churchill, London. Sphere (2000) The Sphere Project. Humanitarian Charter and Minimum Standards in Disaster Response. Oxford, Oxfam Publishing. Spiegel, P., P. Salama, S. Maloney and A. Van der Veen (2000) Mission Report: Nutrition Cluster Surveys in Ethiopia in 1999/2000. Centers for Disease Control and Prevention, Atlanta. Stern, A. (1998) International Population Movements and Public Health in the Mekong Region: An Overview of some Issues Concerning Mapping. Southeast Asian Journal of Tropical Medicine and Public Health 29(2): 201–12. Szwarcwald, C.L., F.I. Bastos, C. Barcellos, M.F. Pina and M.A. Esteves (2000) Health Conditions and Residential Concentration of Poverty: A Study in Rio de Janeiro, Brazil. Journal of Epidemiology and Community Health 54(7): 530–6. Tanser, F. and D. Wilkinson (1999) Spatial Implications of the Tuberculosis DOTS Strategy in Rural South Africa: A Novel Application of Geographical Information System and Global Positioning System Technologies. Tropical Medicine and International Health 4(10): 634– 8. Tim, U.S. (1995) The Application of GIS in Environmental Health Sciences: Opportunities and Limitations. Environmental Research 71(2): 75–88. UNAMA (2002) Afghanistan Information Management Service (AIMS). Available at: http://www.aims.org.pk/. UNHCR (2001) UNHCR Global Report 2001 – Guinea. Available at: http://www.unhcr.ch. —— (2002) Geographic Information and Mapping Unit (GIMU). Available at: http://www.unhcr.ch/cgi-
  • 14. R. Kaiser, P.B. Spiegel, A.K. Henderson and M.L. Gerber140 bin/texis/vtx/home/++wwFqzvxsw8+mn6xFqzvxsw8+mn6hFqhT0NuItFqnp1xczFqn7uFP AFqwDzmwwwwwwww1Fqn7uFP. UNHCR/OCHA (2002) Sierra Leone Information System. Available at: http://www2.reliefweb.int/sle/hic/sierra_leone_information_system.htm. USAID (2003) Available at http://www.usaid.gov/gn/infotechnology/gis/. Vine, M.F., D. Degnan and C. Hanchette (1997) Geographic Information Systems: Their Use in Environmental Epidemiologic Research. Environmental Health Perspectives 105(6): 598– 605. Wartenberg, D. (2001) Investigating Disease Clusters: Why, When and How? J Royal Statistical Society 164(1): 13–32. WFP (2002) Africa Hunger Alert Campaign Begins. Press Release, 16 December. Available at: http://www.wfp.org/index.asp?section=2 —— (2002) Vulnerability Assessment Mapping. Available at: http://www.wfp.org/index.asp?section=5 WHO (2002) Health Mapper. Available at: http://www.who.int/emc/healthmap/healthmap.html. Address for correspondence: Reinhard Kaiser, International Emergency and Refugee Health Branch, National Center for Environmental Health, Centers for Disease Control and Prevention, Mail Stop F-48, 4770 Buford Highway NE, Atlanta, Georgia 30341, USA. E-mail: <<RKaiser@cdc.gov>>