1. March 1999
to
Geographical Mobility March 2000
Issued May 2001
Population Characteristics
P20-538
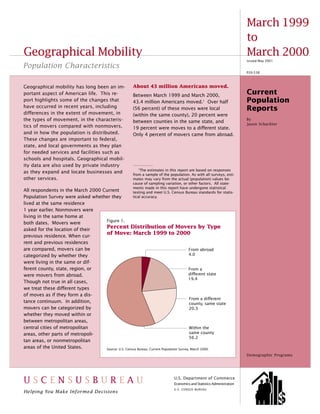
Geographical mobility has long been an im- About 43 million Americans moved.
portant aspect of American life. This re- Between March 1999 and March 2000,
Current
port highlights some of the changes that 43.4 million Americans moved.1 Over half Population
have occurred in recent years, including (56 percent) of these moves were local Reports
differences in the extent of movement, in (within the same county), 20 percent were
the types of movement, in the characteris- between counties in the same state, and
By
Jason Schachter
tics of movers compared with nonmovers, 19 percent were moves to a different state.
and in how the population is distributed. Only 4 percent of movers came from abroad.
These changes are important to federal,
state, and local governments as they plan
for needed services and facilities such as
schools and hospitals. Geographical mobil-
ity data are also used by private industry
1
The estimates in this report are based on responses
as they expand and locate businesses and
from a sample of the population. As with all surveys, esti-
other services. mates may vary from the actual (population) values be-
cause of sampling variation, or other factors. All state-
ments made in this report have undergone statistical
All respondents in the March 2000 Current testing and meet U.S. Census Bureau standards for statis-
Population Survey were asked whether they tical accuracy.
lived at the same residence
1 year earlier. Nonmovers were
living in the same home at
Figure 1.
both dates. Movers were
asked for the location of their
Percent Distribution of Movers by Type
of Move: March 1999 to 2000
previous residence. When cur-
rent and previous residences
are compared, movers can be From abroad
categorized by whether they 4.0
were living in the same or dif-
ferent county, state, region, or From a
were movers from abroad. different state
19.4
Though not true in all cases,
we treat these different types
of moves as if they form a dis-
From a different
tance continuum. In addition, county, same state
movers can be categorized by 20.3
whether they moved within or
between metropolitan areas,
central cities of metropolitan Within the
areas, other parts of metropoli- same county
56.2
tan areas, or nonmetropolitan
areas of the United States. Source: U.S. Census Bureau, Current Population Survey, March 2000.
Demographic Programs
USCENSUSBUREAU U.S. Department of Commerce
Economics and Statistics Administration
U.S. Census Bureau
Helping You Make Informed Decisions
U.S. CENSUS BUREAU 1
2. Table A.
Annual Moving Rates by Type of Move: 1990 to 2000
(Numbers in thousands)
Percent moved
Same From different county
Mobility period Total, residence Within
age 1 (non- Total same Same Different From
and older movers) movers Total county state state abroad
1999-2000 . . . . . . . . . . . . . . . . . . . . . . . . 270,219 226,831 43,388 16.1 9.0 3.3 3.1 0.6
1998-1999 . . . . . . . . . . . . . . . . . . . . . . . . 267,933 225,297 42,636 15.9 9.4 3.1 2.8 0.5
1997-1998 . . . . . . . . . . . . . . . . . . . . . . . . 265,209 222,702 42,507 16.0 10.2 3.0 2.4 0.5
1996-1997 . . . . . . . . . . . . . . . . . . . . . . . . 262,976 219,585 43,391 16.5 10.5 3.0 2.4 0.5
1995-1996 . . . . . . . . . . . . . . . . . . . . . . . . 260,406 217,868 42,537 16.3 10.3 3.1 2.5 0.5
1994-19951 . . . . . . . . . . . . . . . . . . . . . . . 258,248 215,931 42,317 16.4 10.8 3.1 2.2 0.3
1993-1994 . . . . . . . . . . . . . . . . . . . . . . . . 255,774 212,939 42,835 16.7 10.4 3.2 2.6 0.5
1992-1993 . . . . . . . . . . . . . . . . . . . . . . . . 252,799 209,700 43,099 17.0 10.7 3.1 2.7 0.6
1991-1992 . . . . . . . . . . . . . . . . . . . . . . . . 247,380 204,580 42,800 17.3 10.7 3.2 2.9 0.5
1990-1991 . . . . . . . . . . . . . . . . . . . . . . . . 244,884 203,345 41,539 17.0 10.3 3.2 2.9 0.6
1
The primary mobility question in the 1995 survey asked about residence 5 years earlier, not 1 year earlier as in the other survey years.
There was an additional question on residence 1 year earlier, but the resulting 1-year data for the 1994-95 period are not comparable with
the data for other years.
Source: U.S. Census Bureau, Current Population Surveys, March 1991 to 2000.
The overall moving rate has status, and education. Table B little more than twice the moving
stayed constant, but people shows mobility rates by many of rate of all people 1 year and older
moved longer distances. these characteristics. (16 percent). Among adults, as age
Overall moving rates have not increased moving rates decreased,
changed substantially over the past 20- to 29-year olds had the at least until very advanced ages:
few years, and the 1999-2000 rate highest moving rates. by ages 65 to 84, the rate was only
is among the lowest rates found 4 percent. Moving rates were
About one-third of 20- to 29 year-
during the past decade. However, higher for young adults because of
olds moved in the previous year, a
since 1998, there has been a de-
crease in the percentage of moves
made within the same county and a Figure 2.
corresponding increase in the per- Moving Rates by Age: March 1999 to 2000
centage of moves between coun- (In percent)
ties, particularly to counties in dif-
ferent states. In 1998, 64 percent
of all moves were within the same 35.2
county, compared with 56 percent 32.4
of all moves in 2000.2 Similarly, in
1998, 15 percent of all moves were
between states, compared with 23.3
22.0
19 percent of all moves in 2000.
18.1
15.3 14.8
CHARACTERISTICS OF
MOVERS
9.3
Moving rates differ by characteris- 7.0
4.3 4.7
tics like age, race, Hispanic origin,
income, housing tenure, marital
1-4 5-9 10-19 20-24 25-29 30-34 35-44 45-54 55-64 65-84 85+
2
These proportions can be calculated from Age
Table A by dividing the percent moved for the
type of move (e.g. within the same county) by Source: U.S. Census Bureau, Current Population Survey, March 2000.
the total percent moved.
2 U.S. Census Bureau
4. their relatively higher frequency of Table C.
life course events (such as mar- Moving Rates by Race and Hispanic Origin and Age: March
1999 to 2000
riage, child birth, or a new job).
(In percent)
White non-Hispanics were less White Asian and Hispanic
mobile than other racial and Age non- Pacific (of any
Hispanic Black Islander race)
ethnic groups.3
1 to 9 years . . . . . . . . . . . . . . . . . . . . . . . . 18.2 25.6 23.7 23.1
White non-Hispanics had the lowest
10 to 19 years . . . . . . . . . . . . . . . . . . . . . . 13.5 18.5 16.9 19.9
moving rate (14 percent). Hispan- 20 to 29 years . . . . . . . . . . . . . . . . . . . . . . 34.1 31.1 36.4 34.4
ics (of any race) and Asians and 30 to 39 years . . . . . . . . . . . . . . . . . . . . . . 18.2 21.3 23.9 20.8
40 to 49 years . . . . . . . . . . . . . . . . . . . . . . 10.5 15.6 13.8 14.4
Pacific Islanders had the highest 50 to 64 years . . . . . . . . . . . . . . . . . . . . . . 7.2 7.8 10.9 11.1
overall moving rates (about 20 per- 65 to 84 years . . . . . . . . . . . . . . . . . . . . . . 3.9 4.8 8.5 8.0
cent), closely followed by Blacks 85 years and older . . . . . . . . . . . . . . . . . . 4.5 4.6 8.7 8.3
Total. . . . . . . . . . . . . . . . . . . . . . . . . . . . . . . 14.4 19.2 20.4 21.0
(19 percent). Among people who Standardized mobility rate. . . . . . . . . . *14.4 17.1 18.4 18.1
moved, Hispanics and Blacks were
most likely to have moved within *Standardized by age, White non-Hispanic as reference category.
the same county (63 and 61 per- Source: U.S. Census Bureau, Current Population Survey, March 2000.
cent, respectively), while White
non-Hispanics were most likely to Single and divorced people affluent than those living in renter-
have made intercounty and inter- were more likely to move than occupied units.
state moves (44 percent).4 Asians married people.
and Pacific Islanders and Hispanics Among those 16 years and older, Lower-income groups were
were much more likely than Blacks single and divorced or separated more likely to move than
or White non-Hispanics to have people were most likely to have higher-income groups.
come to the United States from moved, followed by married People living in households in lower-
abroad. people. Widowed people were income categories were more likely
least likely to have moved. Age to move than those in higher-income
Table C shows that some of the
could explain some of this varia- categories: 21 percent for incomes
mobility difference between White
tion, particularly the higher moving under $25,000, compared with
non-Hispanics and other racial and
rates of those never married and 12 percent for incomes over
ethnic groups can be attributed to
the lower rates of widowed people. $100,000. Some of this disparity
age. For example, Hispanic mov-
People living in married-couple may reflect differences in
ing rates were higher than White
family households were less likely homeownership patterns, particu-
non-Hispanics in most age catego-
to have moved than those living in larly the higher proportion of renters
ries. However, standardized over-
other types of households. among households with low incomes.
all moving rates show that even if
the Hispanic population had the
One-third of renters moved. Additionally, those living in house-
same age distribution as the White
holds with income less than
non-Hispanic population, the mov- Nearly one-third of people living in
$50,000 were more likely than
ing rate would still have been renter-occupied housing units in
those with higher incomes to move
higher for Hispanics (18 percent March 2000 moved in the previous
short distances (about 60 percent
compared with 14 percent). year, compared with only 1 in 11
and 50 percent, respectively).
people living in owner-occupied
Some of these differences could be
housing units.5 Housing tenure is
explained by factors like educa-
closely related to age, race, His-
tional differences, differences in
panic origin, and income. Those
reasons for moving, and potentially
living in owner-occupied housing
higher costs associated with mak-
3
Data for the American Indian and Alaska units are more likely to be older,
Native population are not shown in this report ing longer distance moves.
because of the small sample size in the Current
White non-Hispanic and more
Population Survey. Based on the March 2000
Moving rates differ by the poverty
Current Population Survey, 3 percent of the 5
As is the case with all characteristics on the
Black population and 2 percent of the Asian Current Population Survey, housing tenure is status of individuals. Those with in-
and Pacific Islander Population are also of His- measured at the time of the survey in March come below the poverty level were
panic origin. 2000; tenure before the move is not ascer-
4
See footnote 2. tained.
4 U.S. Census Bureau
5. net gain of 227,000 people for the
Figure 3. South were statistically significant
Region-to-Region Migration: March 1999 to 2000 for the 1999-2000 year.
(Numbers in thousands)
Nonmetropolitan areas had
Moved to Midwest
Moved to Northeast
net internal migration close
to zero.
Moved to West 416
Nonmetropolitan areas as a whole
432
had about equal numbers of
223
internal inmigrants and
183
204 83 outmigrants during the year —
108
72
127 1.9 million people compared with
West Northeast South
Moved from West Midwest South
2.0 million, as shown in Table D.
Northeast South Midwest Moved from These numbers are not statistically
Moved from
Moved to South different.
489
405
364
Within metropolitan areas,
central cities had net
outmigration, while the
population outside central
cities had net inmigration.
Northeast Midwest West Metropolitan areas outside central
Moved from
cities were the most frequent desti-
Source: U.S. Census Bureau, Current Population Survey, March 2000. nation among movers within and
between metropolitan areas. Al-
though metropolitan areas as a
more likely to have moved (28 per- educated people move longer dis- whole had about equal numbers of
cent) than those with income tances for better paying jobs. inmigrants and outmigrants, cen-
150 percent above the poverty level tral cities of metropolitan areas fol-
or higher (14 percent). Also, those REGIONAL MOVEMENTS lowed the migration pattern found
with income below the poverty level throughout the 1990s: continued
Interstate migration, along with dif-
were more likely to have made a net migration loss. Between 1999
ferences in rates of natural increase
short-distance move (about 61 per- and 2000, 6.9 million people
(births minus deaths), changes the
cent) than those in the higher in- moved out of central cities, while
distribution of the population
come group (about 54 percent). 3.7 million moved in, resulting in a
among regions of the country. In
net loss due to internal migration
recent decades, more people have
People of different education of 3.2 million people.
moved from North to South than in
levels had similar moving
the opposite direction, and this
rates. Movers from abroad added
trend continued. Figure 3 shows
There were only small differences population to the West and
the flows of migrants among the
helped offset net internal
in moving rates by education, rang- four major regions of the United migration losses for the
ing from 12 percent of those with States between 1999 and 2000. Northeast.
only a high school education to
15 percent of those with a Between March of 1999 and 2000,
Only the Northeast had a net
bachelor’s degree. However, mov- the CPS estimates that 1.75 million
loss in population because of
ers with a bachelor’s degree were people moved to the United States
internal migration.
more likely to have moved longer from abroad. Two-thirds of these
As found throughout the 1990s, movers were foreign-born and not
distances: 47 percent made an in-
more people moved from the United States citizens (1.2 million),
tercounty move compared with
Northeast than to it from other re- while the other third were civilian
34 percent of those with less than
gions of the country. Of all the re- citizens (600,000). Most movers
a high school education. This dif-
gions, only the net loss of 252,000
ference could indicate that better
people for the Northeast and the
U.S. Census Bureau 5
6. Table D.
Annual Internal Migration by Region and Type of Residence, March 1999 to 2000 and
Annual Net International Migration by Region, July 1, 1998 to July 1, 1999
(Numbers in thousands)
Estimate for
July 1, 1998 to
Estimates from the Current Population July 1, 1999
Survey for March 1999 to March 2000 based on
administrative
Geographic area records4
Internal migration
Movers Net
Net internal from international
Inmigrants Outmigrants migration abroad3 migration
Region
Total1 . . . . . . . . . . . . . . . . . . . . . . . . . . . . . . . . . . . . . 3,106 3,106 - 1,745 852
Northeast. . . . . . . . . . . . . . . . . . . . . . . . . . . . . . . . . . . . . . 363 615 *–252 292 184
Midwest . . . . . . . . . . . . . . . . . . . . . . . . . . . . . . . . . . . . . . . 722 640 82 238 99
South . . . . . . . . . . . . . . . . . . . . . . . . . . . . . . . . . . . . . . . . . 1,258 1,031 *227 612 244
West . . . . . . . . . . . . . . . . . . . . . . . . . . . . . . . . . . . . . . . . . . 763 820 –57 604 325
Type of residence
Total2 . . . . . . . . . . . . . . . . . . . . . . . . . . . . . . . . . . . . . 3,951 3,951 - 1,745 (NA)
Metropolitan areas . . . . . . . . . . . . . . . . . . . . . . . . . . . . . . 2,044 1,907 137 1,639 (NA)
Central cities . . . . . . . . . . . . . . . . . . . . . . . . . . . . . . . . . 3,670 6,928 *–3,258 845 (NA)
Outside central cities. . . . . . . . . . . . . . . . . . . . . . . . . . 7,376 3,981 *3,395 794 (NA)
Nonmetropolitan areas . . . . . . . . . . . . . . . . . . . . . . . . . . 1,907 2,044 –137 106 (NA)
NA Not available. *The net migration flows are significantly different from zero.
1
There were 3,106,000 internal migrants who moved from one region to another.
2
There were 3,951,000 internal migrants who moved from metropolitan areas to nonmetropolitan areas or vice-versa.
3
These numbers from the CPS include both temporary and permament movers to the United States, among the civilian U.S. population.
See text for more details.
4
These numbers are derived independently by the Population Estimates Program and are not directly comparable to the CPS. See text
for more details.
Source: U.S. Census Bureau, Current Population Survey, March 2000, and Population Estimates Program.
from abroad (1.2 million) came to based on data from the Immigra- net migration. While the West did
the South and West. tion and Naturalization Service and not experience a significant gain in
the 1990 decennial census; an esti- population from domestic migra-
The CPS does not collect data on mate of emigration from the United tion, it did grow when net interna-
the number of people who move States based on data from the tional migration is included. Al-
away from the United States, and 1980 and 1990 censuses; and net though the Northeast still had a
thus it is not possible to use the movement between Puerto Rico significant loss of people, this loss
CPS to estimate net international and the United States. was mitigated by net international
migration. However, the Census migration.
Bureau does provide independently These estimates based on adminis-
derived estimates for net interna- trative records indicate that
SOURCE OF DATA
tional migration using administra- 852,000 more people came to the
tive records and other data. The United States from abroad than left Most estimates in this report come
components of net international between July 1 of 1998 and 1999, from data collected in March 2000
migration include: legal immigra- the latest year for which these esti- by the CPS. The CPS is a monthly
tion to the United States as re- mates are available. Combining national survey of about 50,000
ported by the Immigration and these estimates by region with re- households, representative of the ci-
Naturalization Service; refugee data gional net domestic migration fig- vilian noninstitutional population of
from the Office of Refugee Resettle- ures suggests that all regions ex- the United States. Some estimates
ment; an estimate of net undocu- cept the Northeast showed are based on data collected by the
mented immigration from abroad, significant population gains from CPS in earlier years. The Census
6 U.S. Census Bureau
7. Bureau conducts the CPS every present when people who are $24.50 payable to Commerce-
month but collects the data on resi- missed in the survey differ from Census-88-00-9010, to the U.S. De-
dential mobility only in March. those interviewed in ways other partment of Commerce, Census Bu-
than the categories used in weight- reau, P Box 277943, Atlanta, GA
.O.
ACCURACY OF ESTIMATES ing (age, race, sex, and Hispanic 30384-7943, or call the Population
origin). All of these considerations Division’s Statistical Information Of-
Statistics from sample surveys are
affect comparisons across different fice on 301-457-2422. A copy of
subject to sampling and nonsam-
surveys or data sources. these tabulations will be made avail-
pling error. All comparisons pre-
able to any existing Current Popula-
sented in this report have taken For further information on statisti- tion Report P20 subscriber without
sampling error into account and cal standards and the computation charge, provided that the request is
meet the Census Bureau’s stan- and use of standard errors, contact made within 3 months of the issue
dards for statistical significance. Alfred Meier, Demographic Statisti- date of this report.
Nonsampling errors in surveys may cal Methods Division, at
be attributed to a variety of 301-457-4220 or on the Internet at
sources, such as how the survey
CONTACTS
Alfred.G.Meier@census.gov.
was designed, how respondents in- Statistical Information Staff
terpret questions, how able and pop@census.gov
MORE INFORMATION
willing respondents are to provide 301-457-2422
correct answers, and how accu- A set of detailed tabulations consist-
rately answers are coded and clas- ing of 30 tables from the 2000 Jason Schachter
sified. The Census Bureau employs March CPS shows more detailed jason.p.schachter@census.gov
quality control procedures through- characteristics of movers and 301-457-2454
out the production process — in- nonmovers by type of move for the
cluding the overall design of sur- United States and the regions. The USER COMMENTS
veys, testing the wording of electronic version of these tables is
The Census Bureau welcomes the
questions, reviewing the work of available on the Internet at the Cen-
comments and advice of users of
interviewers and coders, and statis- sus Bureau’s World Wide Web site
our data and reports. If you have
tical review of reports. (www.census.gov). Once on the site,
any suggestions or comments,
go to “Subjects A to Z,” then click on
please write to:
The CPS employs ratio estimation, “M,” and finally on “Migration.”
whereby sample estimates are ad-
Chief, Population Division
justed to independent estimates of An abbreviated paper version of the
U.S. Census Bureau
the national population by age, tables (without the race and geo-
Washington, DC 20233
race, sex, and Hispanic origin. graphic repeats) is available as PPL-
This weighting partially corrects for 144 for $24.50. To receive a paper
or send e-mail to:
bias due to undercoverage, but copy, send a request for “PPL-144,
pop@census.gov
how it affects different variables in Geographical Mobility: March 1999
the survey is not precisely known. to March 2000,” along with a check
Moreover, biases may also be or money order in the amount of
U.S. Census Bureau 7