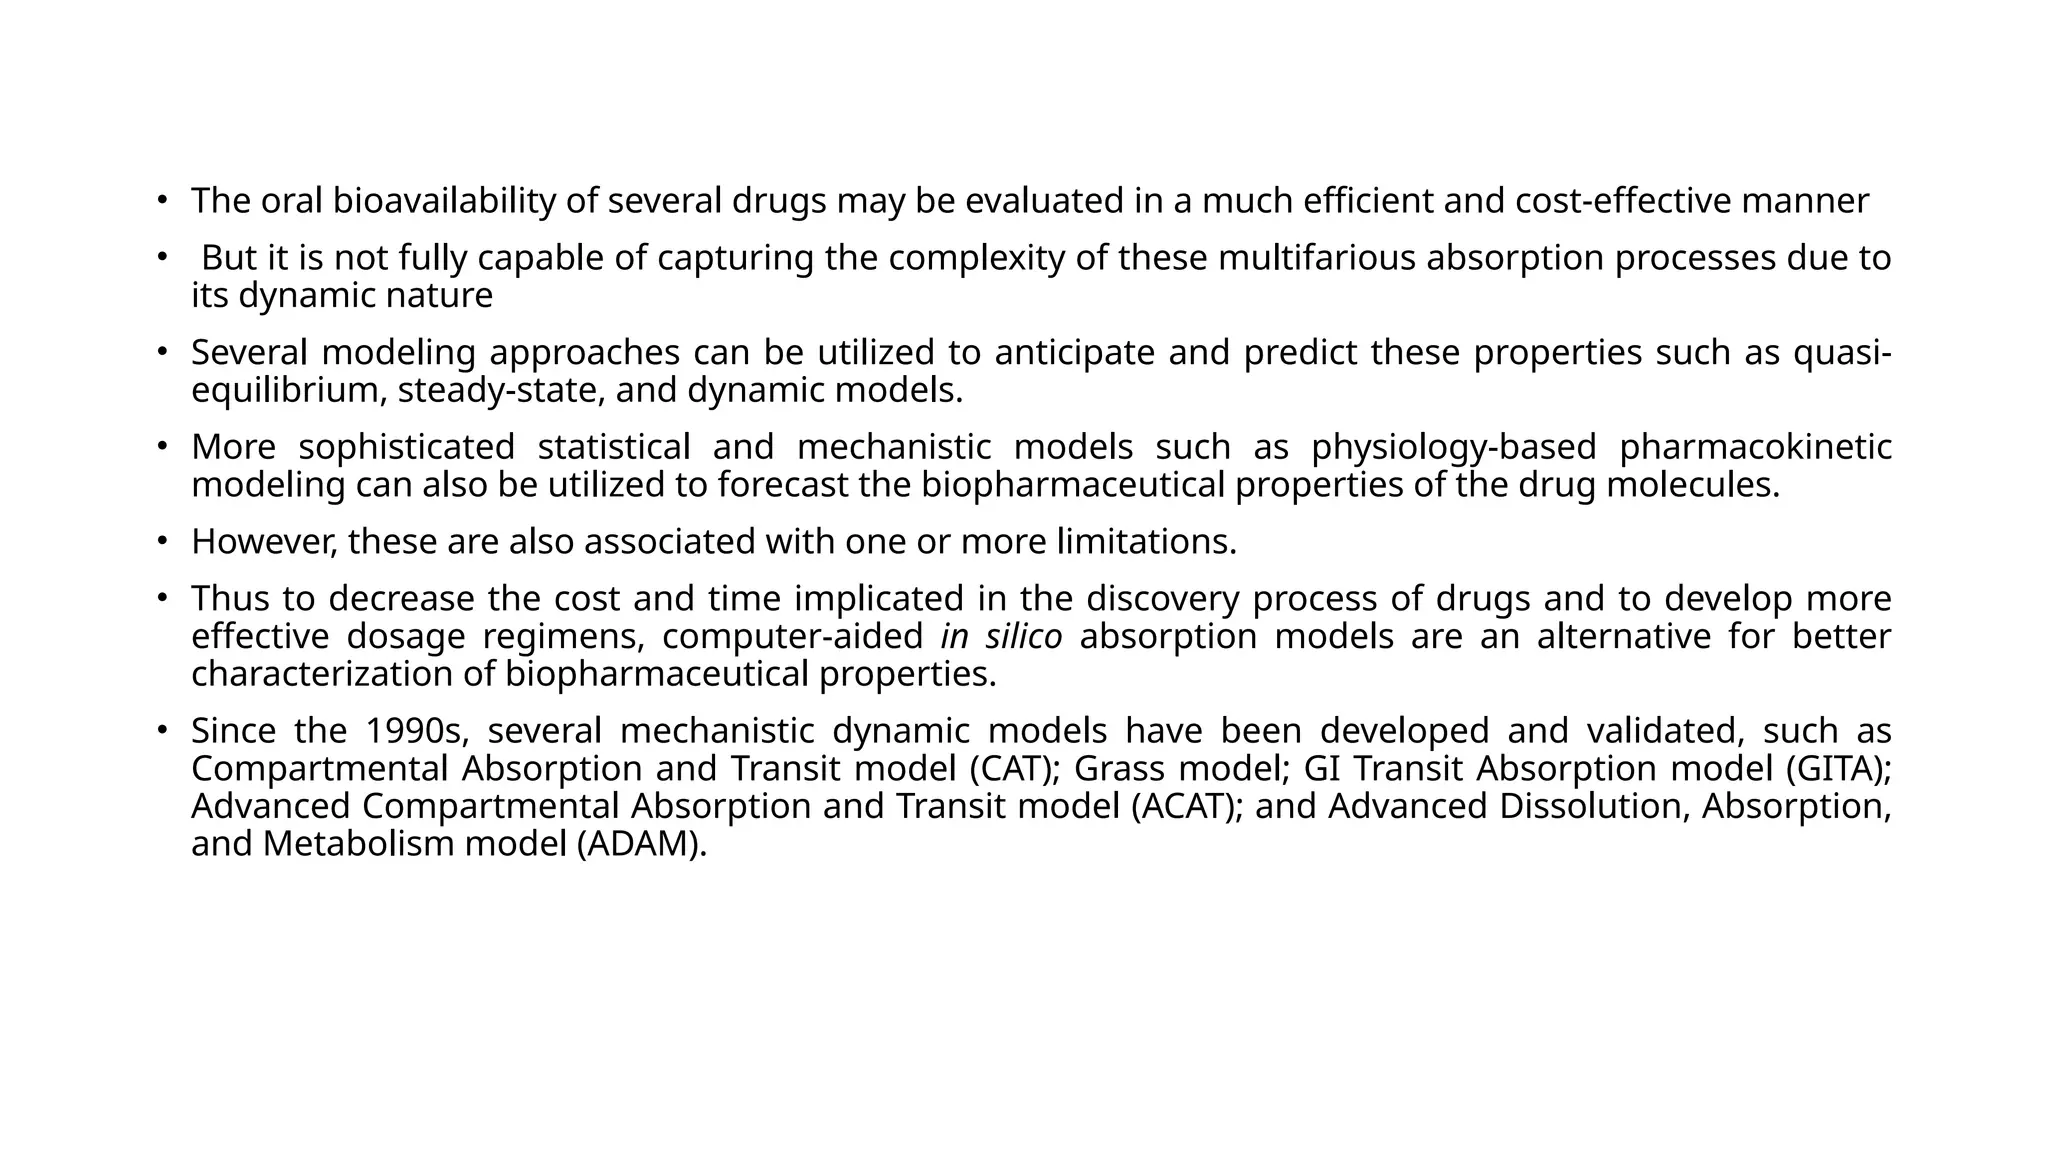
• The oralbioavailability of several drugs may be evaluated in a much efficient and cost-effective manner
• But it is not fully capable of capturing the complexity of these multifarious absorption processes due to
its dynamic nature
• Several modeling approaches can be utilized to anticipate and predict these properties such as quasi-
equilibrium, steady-state, and dynamic models.
• More sophisticated statistical and mechanistic models such as physiology-based pharmacokinetic
modeling can also be utilized to forecast the biopharmaceutical properties of the drug molecules.
• However, these are also associated with one or more limitations.
• Thus to decrease the cost and time implicated in the discovery process of drugs and to develop more
effective dosage regimens, computer-aided in silico absorption models are an alternative for better
characterization of biopharmaceutical properties.
• Since the 1990s, several mechanistic dynamic models have been developed and validated, such as
Compartmental Absorption and Transit model (CAT); Grass model; GI Transit Absorption model (GITA);
Advanced Compartmental Absorption and Transit model (ACAT); and Advanced Dissolution, Absorption,
and Metabolism model (ADAM).
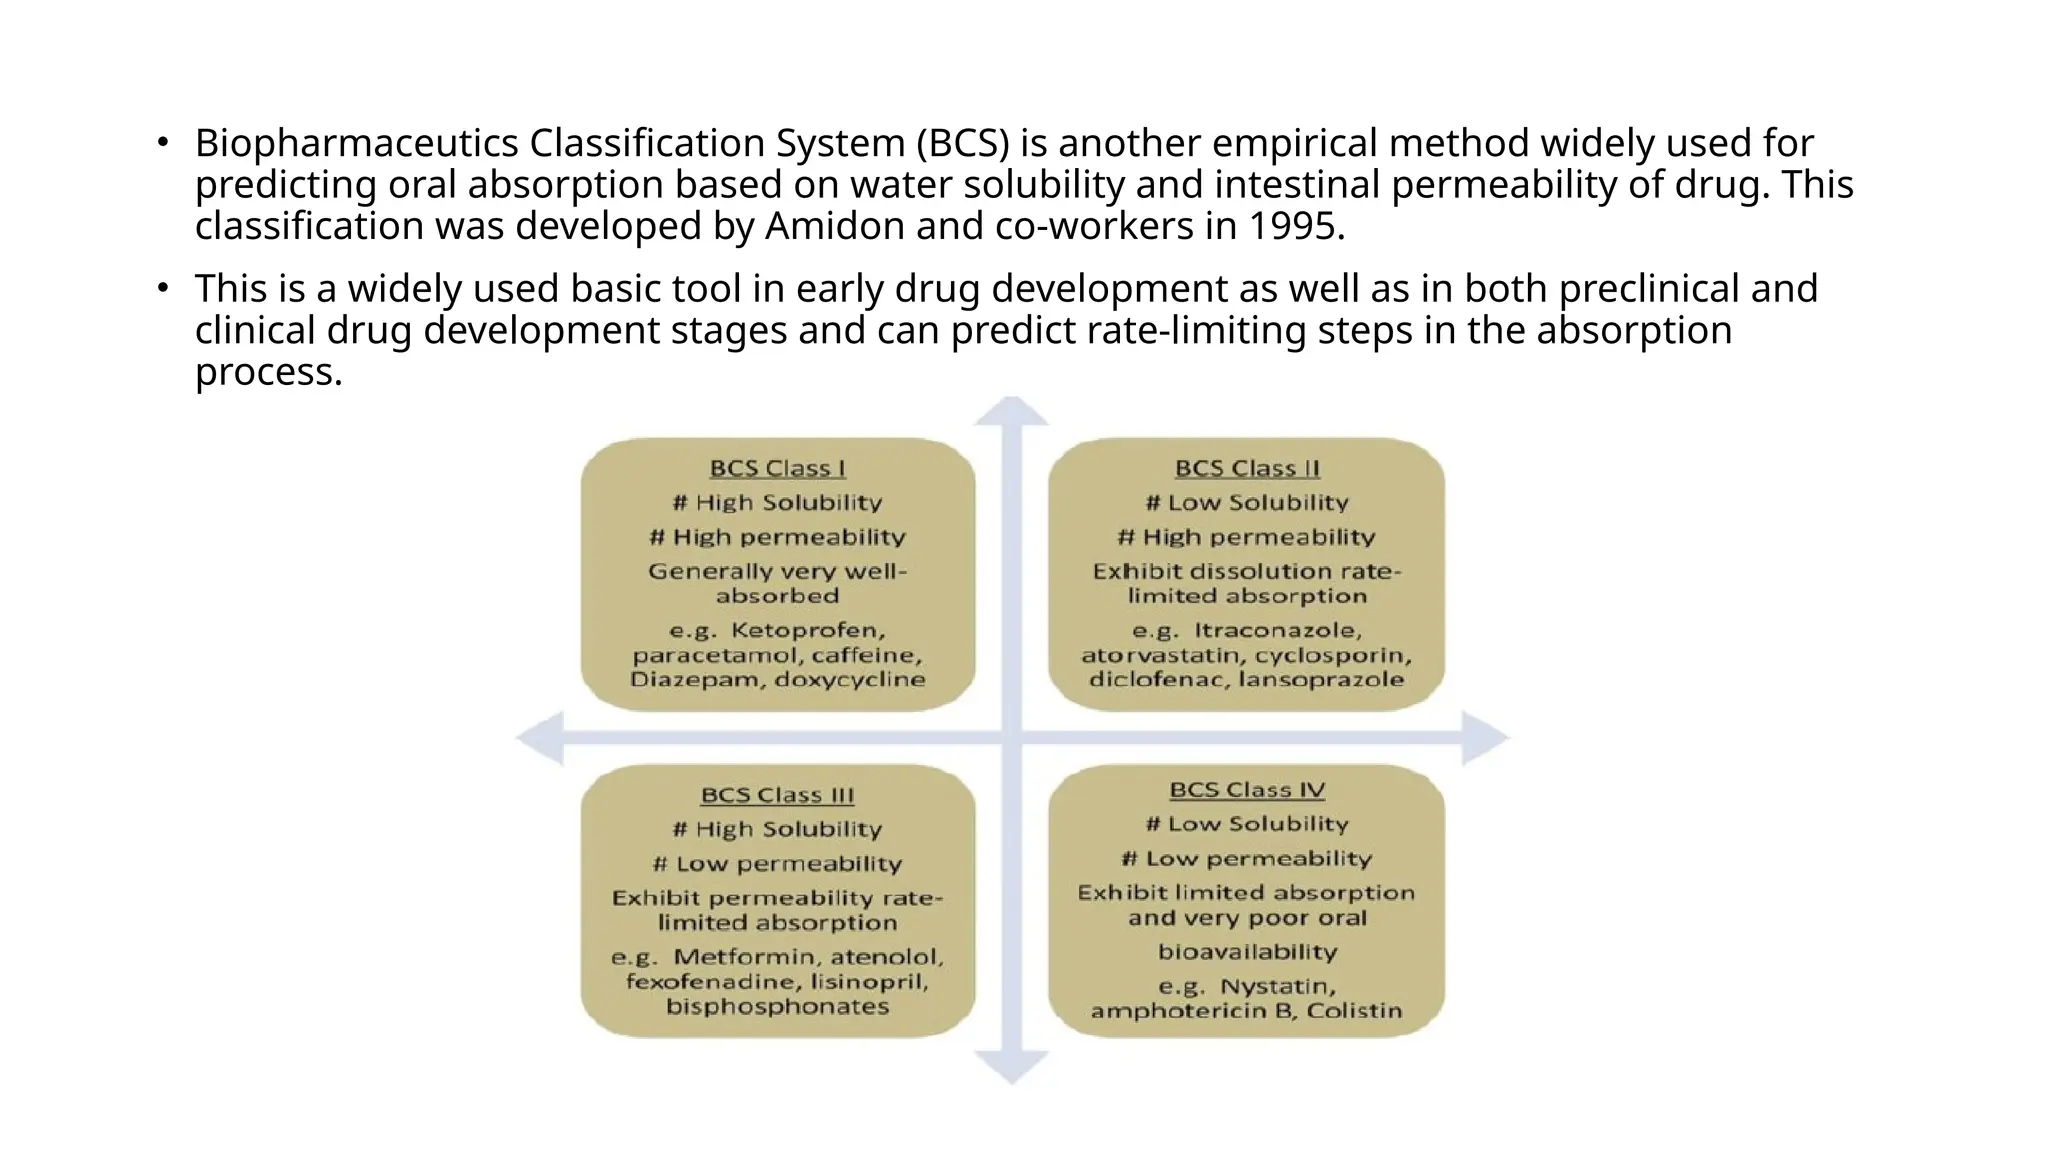
• Biopharmaceutics ClassificationSystem (BCS) is another empirical method widely used for
predicting oral absorption based on water solubility and intestinal permeability of drug. This
classification was developed by Amidon and co-workers in 1995.
• This is a widely used basic tool in early drug development as well as in both preclinical and
clinical drug development stages and can predict rate-limiting steps in the absorption
process.
6.
The conceptof BCS was extended by including the elimination process of drugs.
It also considers the effects of drug transporters and efflux phenomenon on drug oral absorption. This
modified version is named “Biopharmaceutics Drug Disposition Classification System”.
It can also predict the disposition of the drug through transport/absorption/elimination interplay
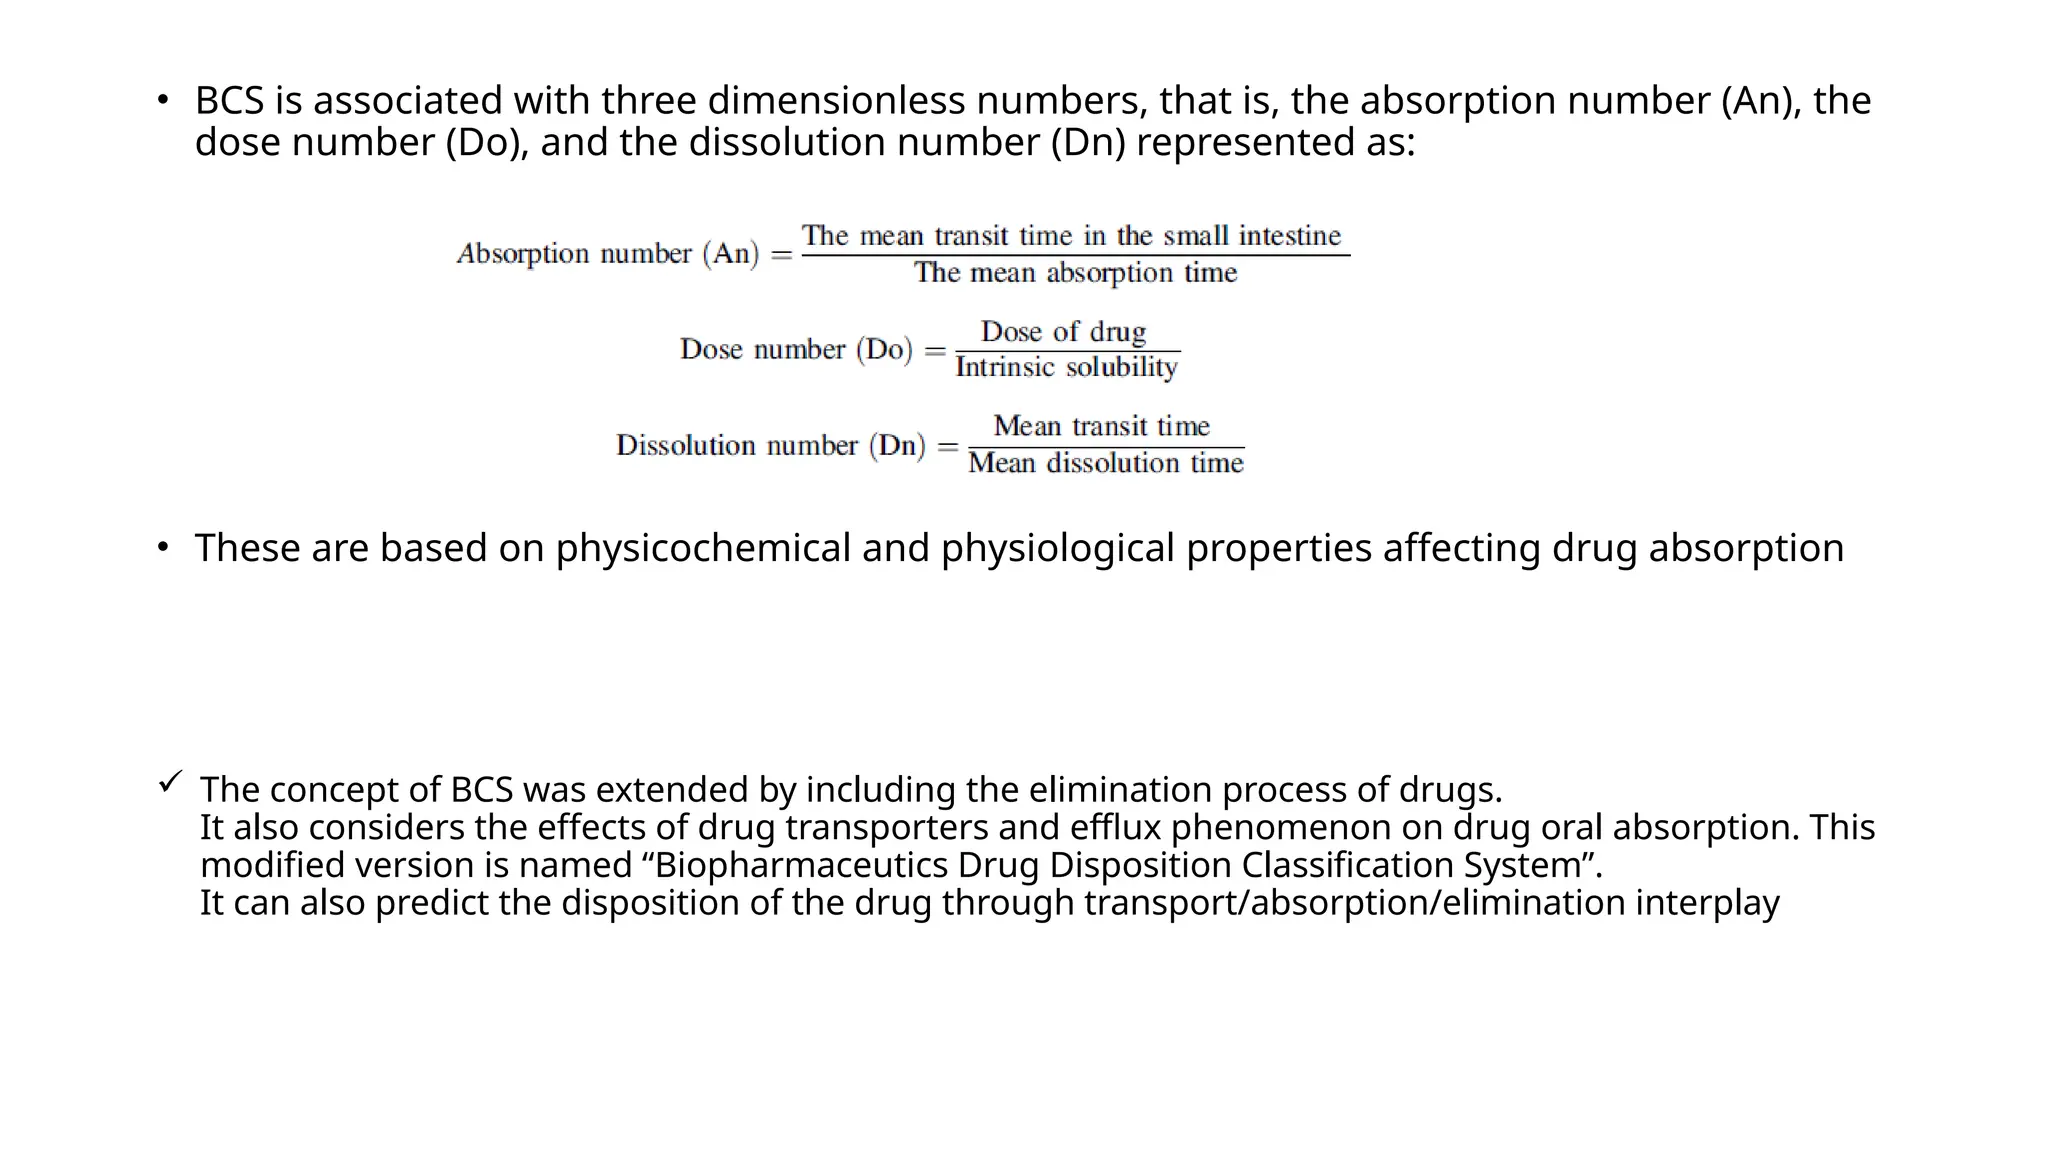
• BCS is associated with three dimensionless numbers, that is, the absorption number (An), the
dose number (Do), and the dissolution number (Dn) represented as:
• These are based on physicochemical and physiological properties affecting drug absorption
7.
• Gastrointestinal AbsorptionModeling and Simulation:
The static methods of predicting physicochemical parameters of the drug, for example, drug
permeability, dissolution rate, and stability, could not completely demonstrate the dynamic and
multifaceted process of in vivo absorption
Thus, mathematical and mechanistic models were developed which aided in integrating and
extrapolating in vitro data into in vivo information.
The conventional mathematical models were based on two elementary parameters of drug molecule
(i.e., solubility and permeability). Absorption potential model and Maximum Absorbable Dose
equations are examples of such simple and quick models that can estimate the extent of absorption
under “static” conditions
. The former can predict the fraction of dose that can be absorbed, while the latter can simulate
residence time in small intestinal and thus can predict the maximum amount of a drug that can be
absorbed within a period of 6 h.
However, these models are also associated with certain limitations such as limited prediction capacity
in a dynamic manner like it cannot predict the influence of pH variability in different compartments of
GIT, blood perfusion rate, the effect of food, etc
8.
Mechanistic Approaches forPredicting Oral Drug Absorption
• More advanced dynamic models such as the CAT model, the Advanced CAT (ACAT) model, the
Advanced Dissolution, Absorption and Metabolism (ADAM) model, the Grass model, and the
GI Transit Absorption (GITA) model represent physiology of the gastrointestinal tracts like
drug transit, dissolution, and absorption could be successfully used to demonstrate
biopharmaceutical properties more accurately and precisely.
• Several industry-oriented and commercial computer software are available which are
developed to integrate these dynamic models for computer-aided biopharmaceutical
characterization such as NONMEM, PhysioLab®, WinNonLin®, WinNonMix®, SimCYP, PK-
Sim®, GastroPlus®, IDEA® (no longer available), Cloe® PK, Cloe®HIA, and INTELLIPHARM®
PKCR
9.
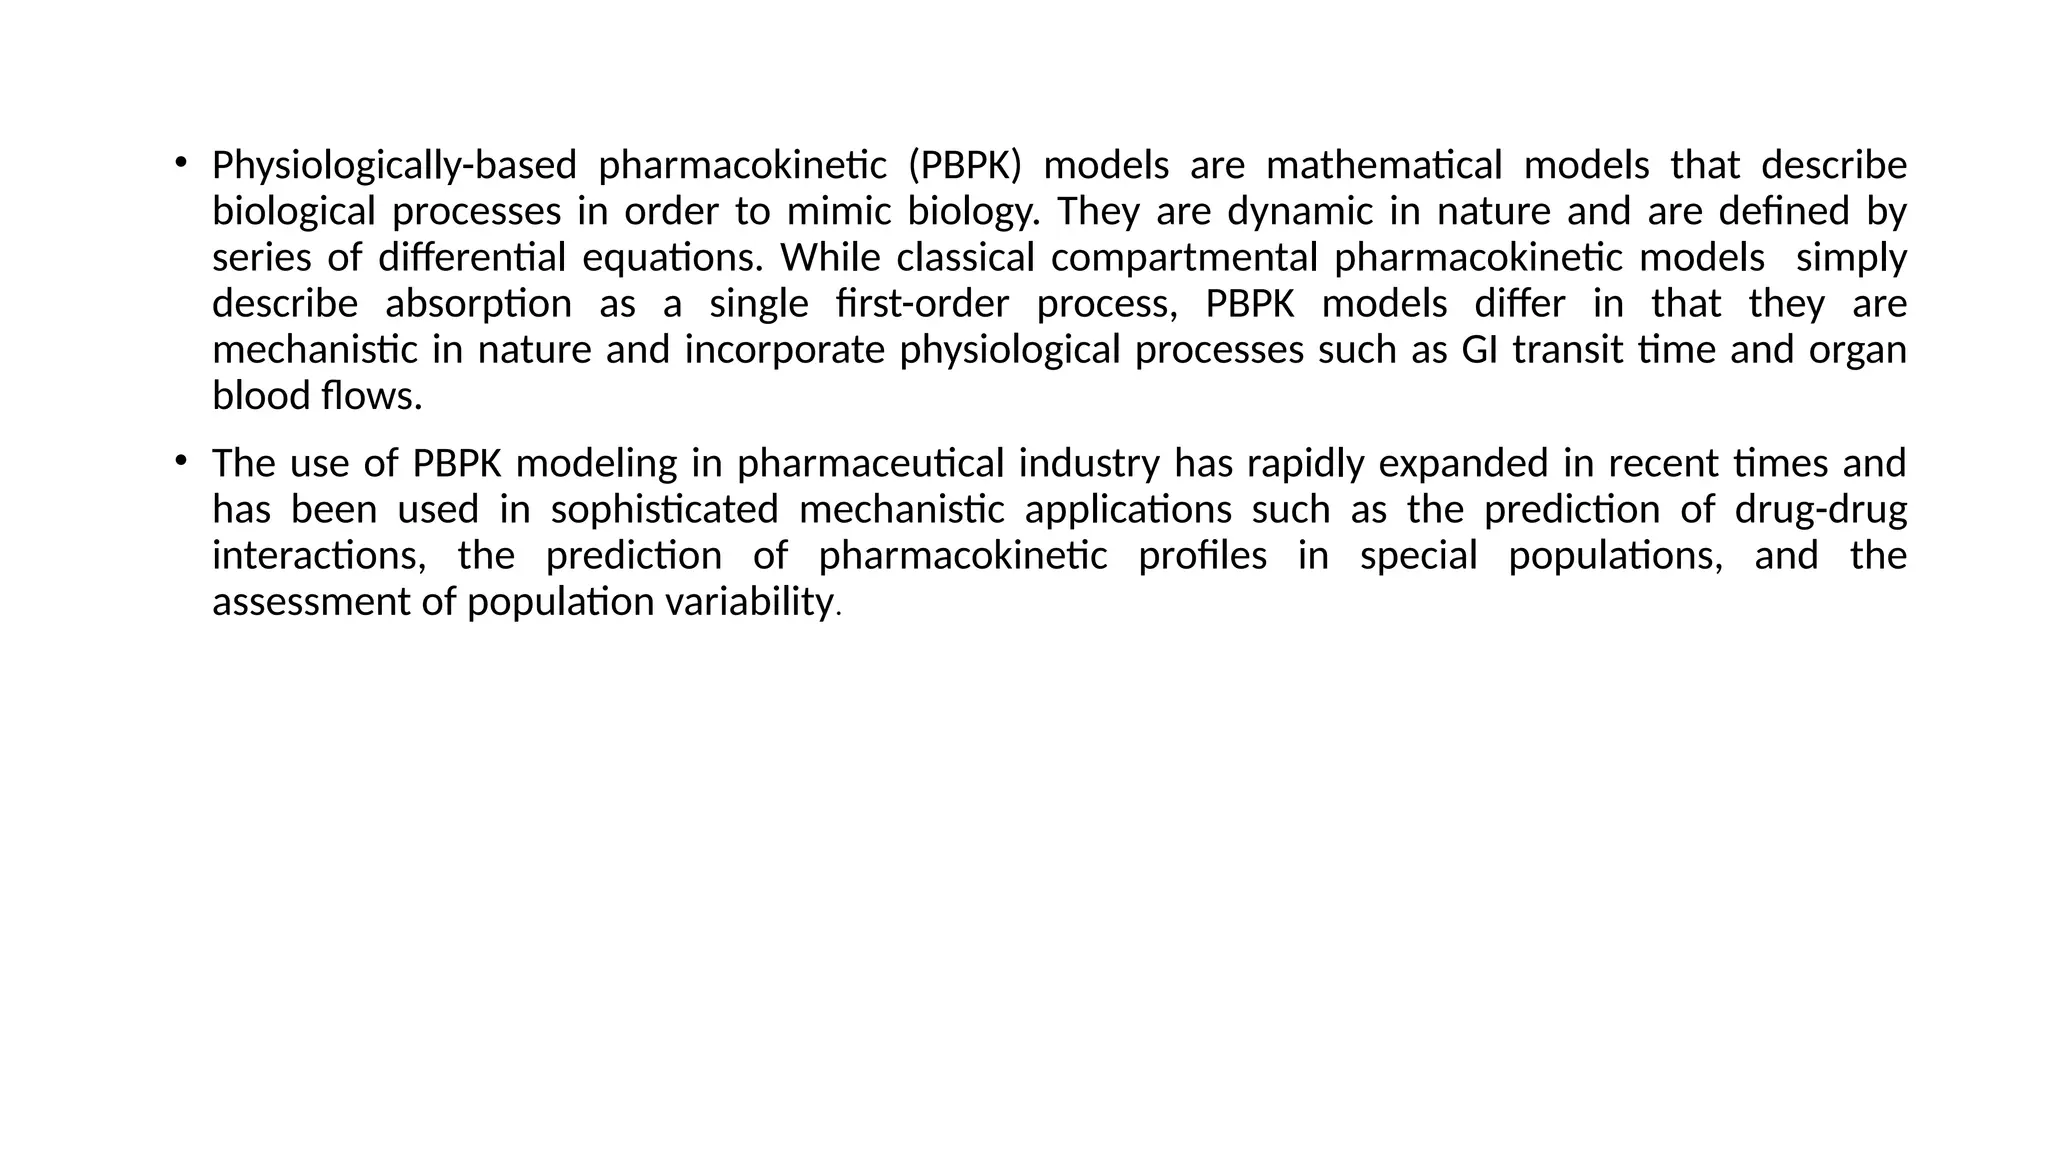
• Physiologically-based pharmacokinetic(PBPK) models are mathematical models that describe
biological processes in order to mimic biology. They are dynamic in nature and are defined by
series of differential equations. While classical compartmental pharmacokinetic models simply
describe absorption as a single first-order process, PBPK models differ in that they are
mechanistic in nature and incorporate physiological processes such as GI transit time and organ
blood flows.
• The use of PBPK modeling in pharmaceutical industry has rapidly expanded in recent times and
has been used in sophisticated mechanistic applications such as the prediction of drug-drug
interactions, the prediction of pharmacokinetic profiles in special populations, and the
assessment of population variability.
10.
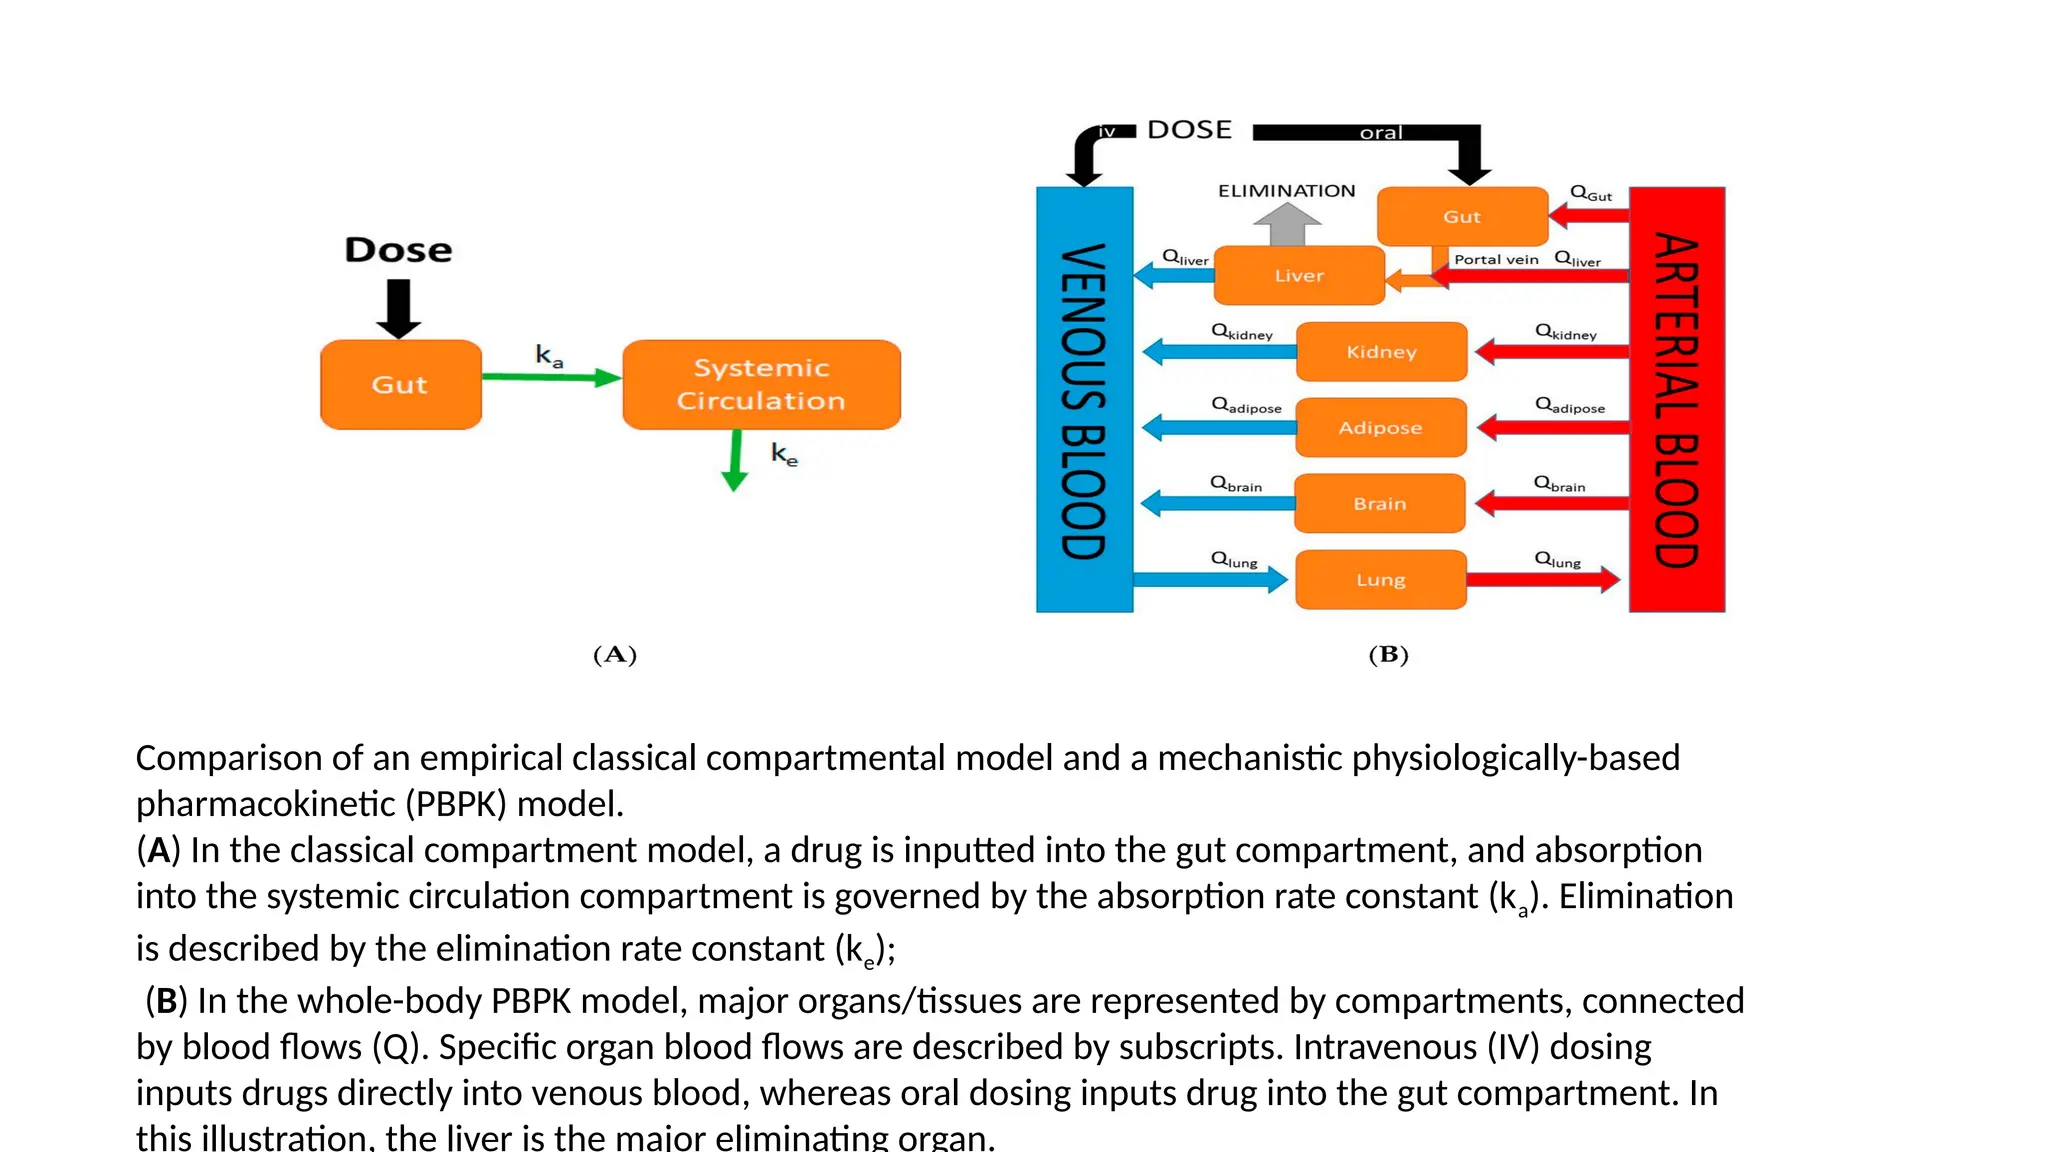
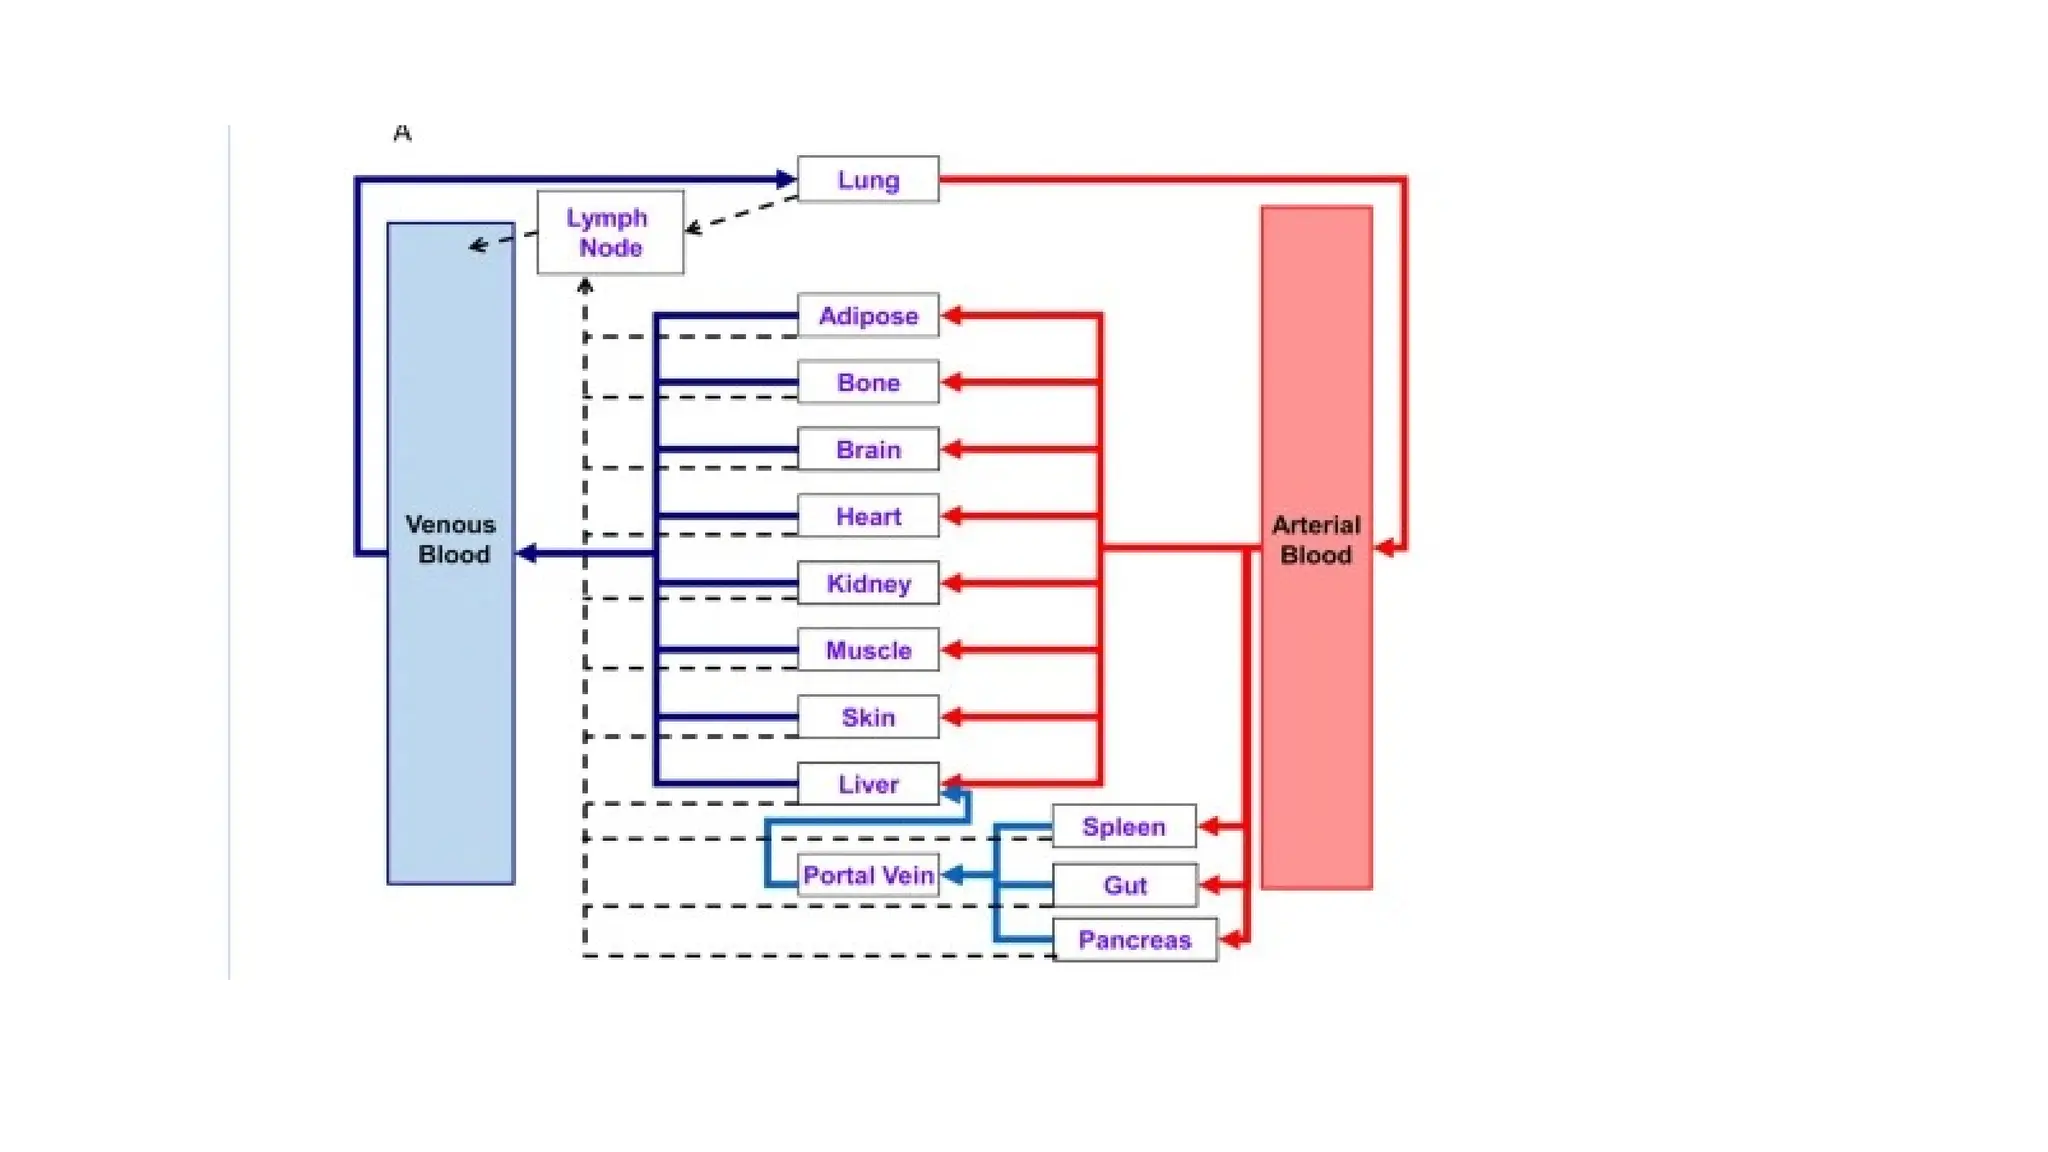
Comparison of anempirical classical compartmental model and a mechanistic physiologically-based
pharmacokinetic (PBPK) model.
(A) In the classical compartment model, a drug is inputted into the gut compartment, and absorption
into the systemic circulation compartment is governed by the absorption rate constant (ka). Elimination
is described by the elimination rate constant (ke);
(B) In the whole-body PBPK model, major organs/tissues are represented by compartments, connected
by blood flows (Q). Specific organ blood flows are described by subscripts. Intravenous (IV) dosing
inputs drugs directly into venous blood, whereas oral dosing inputs drug into the gut compartment. In
this illustration, the liver is the major eliminating organ.
11.
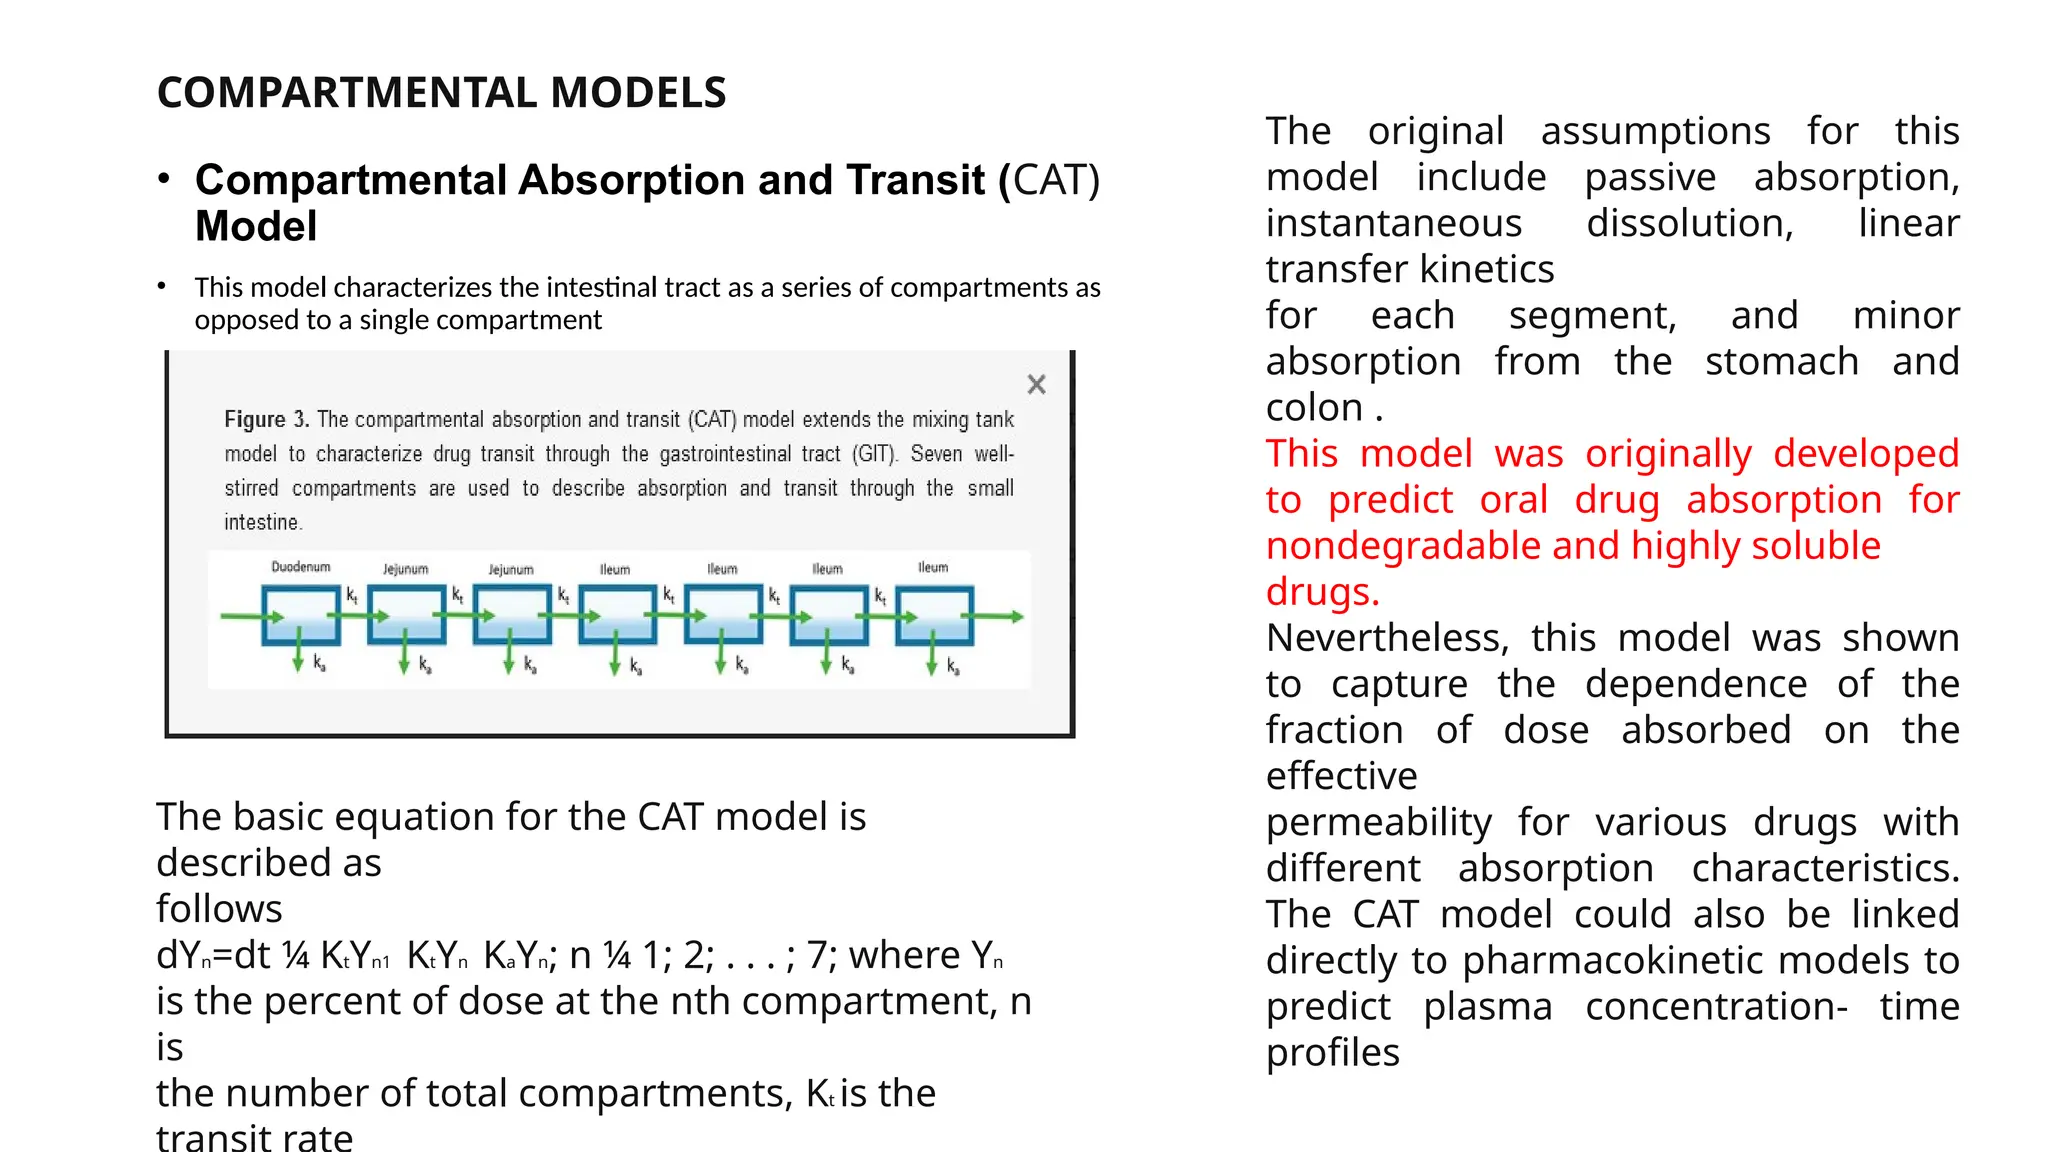
COMPARTMENTAL MODELS
• CompartmentalAbsorption and Transit (CAT)
Model
• This model characterizes the intestinal tract as a series of compartments as
opposed to a single compartment
The basic equation for the CAT model is
described as
follows
dYn=dt ¼ KtYn1 KtYn KaYn; n ¼ 1; 2; . . . ; 7; where Yn
is the percent of dose at the nth compartment, n
is
the number of total compartments, Kt is the
The original assumptions for this
model include passive absorption,
instantaneous dissolution, linear
transfer kinetics
for each segment, and minor
absorption from the stomach and
colon .
This model was originally developed
to predict oral drug absorption for
nondegradable and highly soluble
drugs.
Nevertheless, this model was shown
to capture the dependence of the
fraction of dose absorbed on the
effective
permeability for various drugs with
different absorption characteristics.
The CAT model could also be linked
directly to pharmacokinetic models to
predict plasma concentration- time
profiles
12.
• ASSUMPTIONS MADEIN CAT MODEL
• Dissolution is instantaneous
• A drug moving through the small intestine can be viewed as a process
flowing through a series of segments, each described by a single
compartment with linear transfer kinetics from one to the next, all
compartments may have different volume and flow rates but have the
same residence time.
13.
CAT model wasextended for several other estimations as follows:
1. Dose-dependent drug absorption or carrier/transporter-mediated absorption can also be
computed by applying the fundaments Michaelis–Menten kinetics.
2. The absorption of drugs that can be degraded in GIT could be predicted by considering the
gastric emptying rate constant and compartment-dependent degradation rate constant.
3. An additional compartment representing a controlled release dosage form could be used to
predict the absorption of part of the dose from controlled release dosage forms.
4. It can also be employed to simulate the fraction of dose absorbed for poorly absorptive drugs
as well as can be used to determine the reason for poor oral absorption by considering gastric
emptying and dissolution.
14.
GRASS model
Analogous tothe CAT model, a scientist named Grass has developed another physiologically
based multiple-compartmental model in 1997.
• This model predicts absorption from the gastrointestinal compartments based on drug
solubility and permeability and tissue surface area.
• The movement of fluids in the gastrointestinal tract (i.e., transit and emptying) can be
described by this model.
• Additionally, the flux of drug absorption in each gastrointestinal tract can be calculated. But
still, it has limited applications because it cannot fully consider pre-systemic metabolism, drug
degradation, or the active transport of drugs.
• It was integrated with the IDEA™ and IDEA pkEXPRESS™ software which are not currently
available
• STELLA® (isee Systems, Inc.) is one of the software based on this Grass model which has also
limited applications
15.
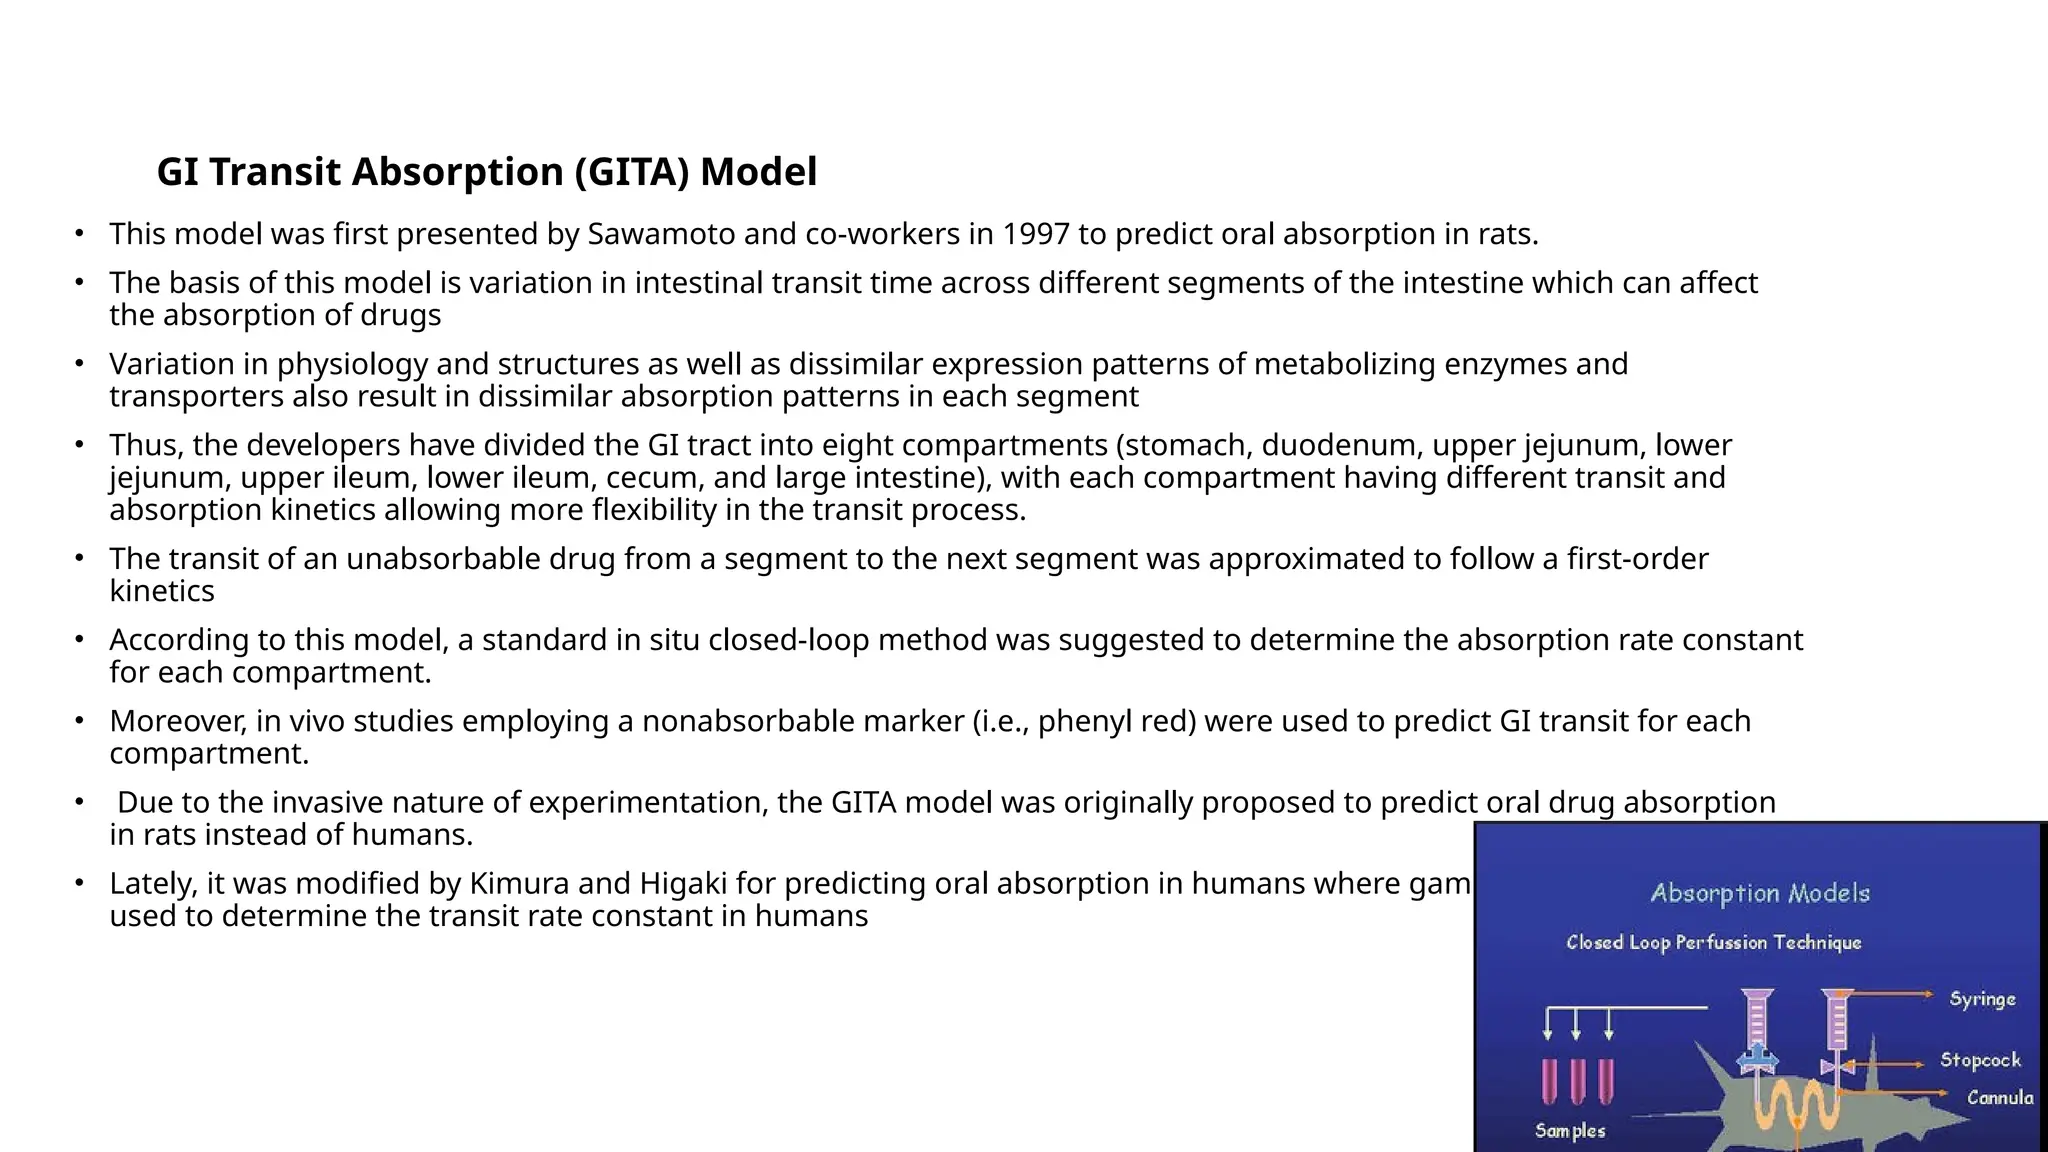
GI Transit Absorption(GITA) Model
• This model was first presented by Sawamoto and co-workers in 1997 to predict oral absorption in rats.
• The basis of this model is variation in intestinal transit time across different segments of the intestine which can affect
the absorption of drugs
• Variation in physiology and structures as well as dissimilar expression patterns of metabolizing enzymes and
transporters also result in dissimilar absorption patterns in each segment
• Thus, the developers have divided the GI tract into eight compartments (stomach, duodenum, upper jejunum, lower
jejunum, upper ileum, lower ileum, cecum, and large intestine), with each compartment having different transit and
absorption kinetics allowing more flexibility in the transit process.
• The transit of an unabsorbable drug from a segment to the next segment was approximated to follow a first-order
kinetics
• According to this model, a standard in situ closed-loop method was suggested to determine the absorption rate constant
for each compartment.
• Moreover, in vivo studies employing a nonabsorbable marker (i.e., phenyl red) were used to predict GI transit for each
compartment.
• Due to the invasive nature of experimentation, the GITA model was originally proposed to predict oral drug absorption
in rats instead of humans.
• Lately, it was modified by Kimura and Higaki for predicting oral absorption in humans where gamma scintigraphy was
used to determine the transit rate constant in humans
16.
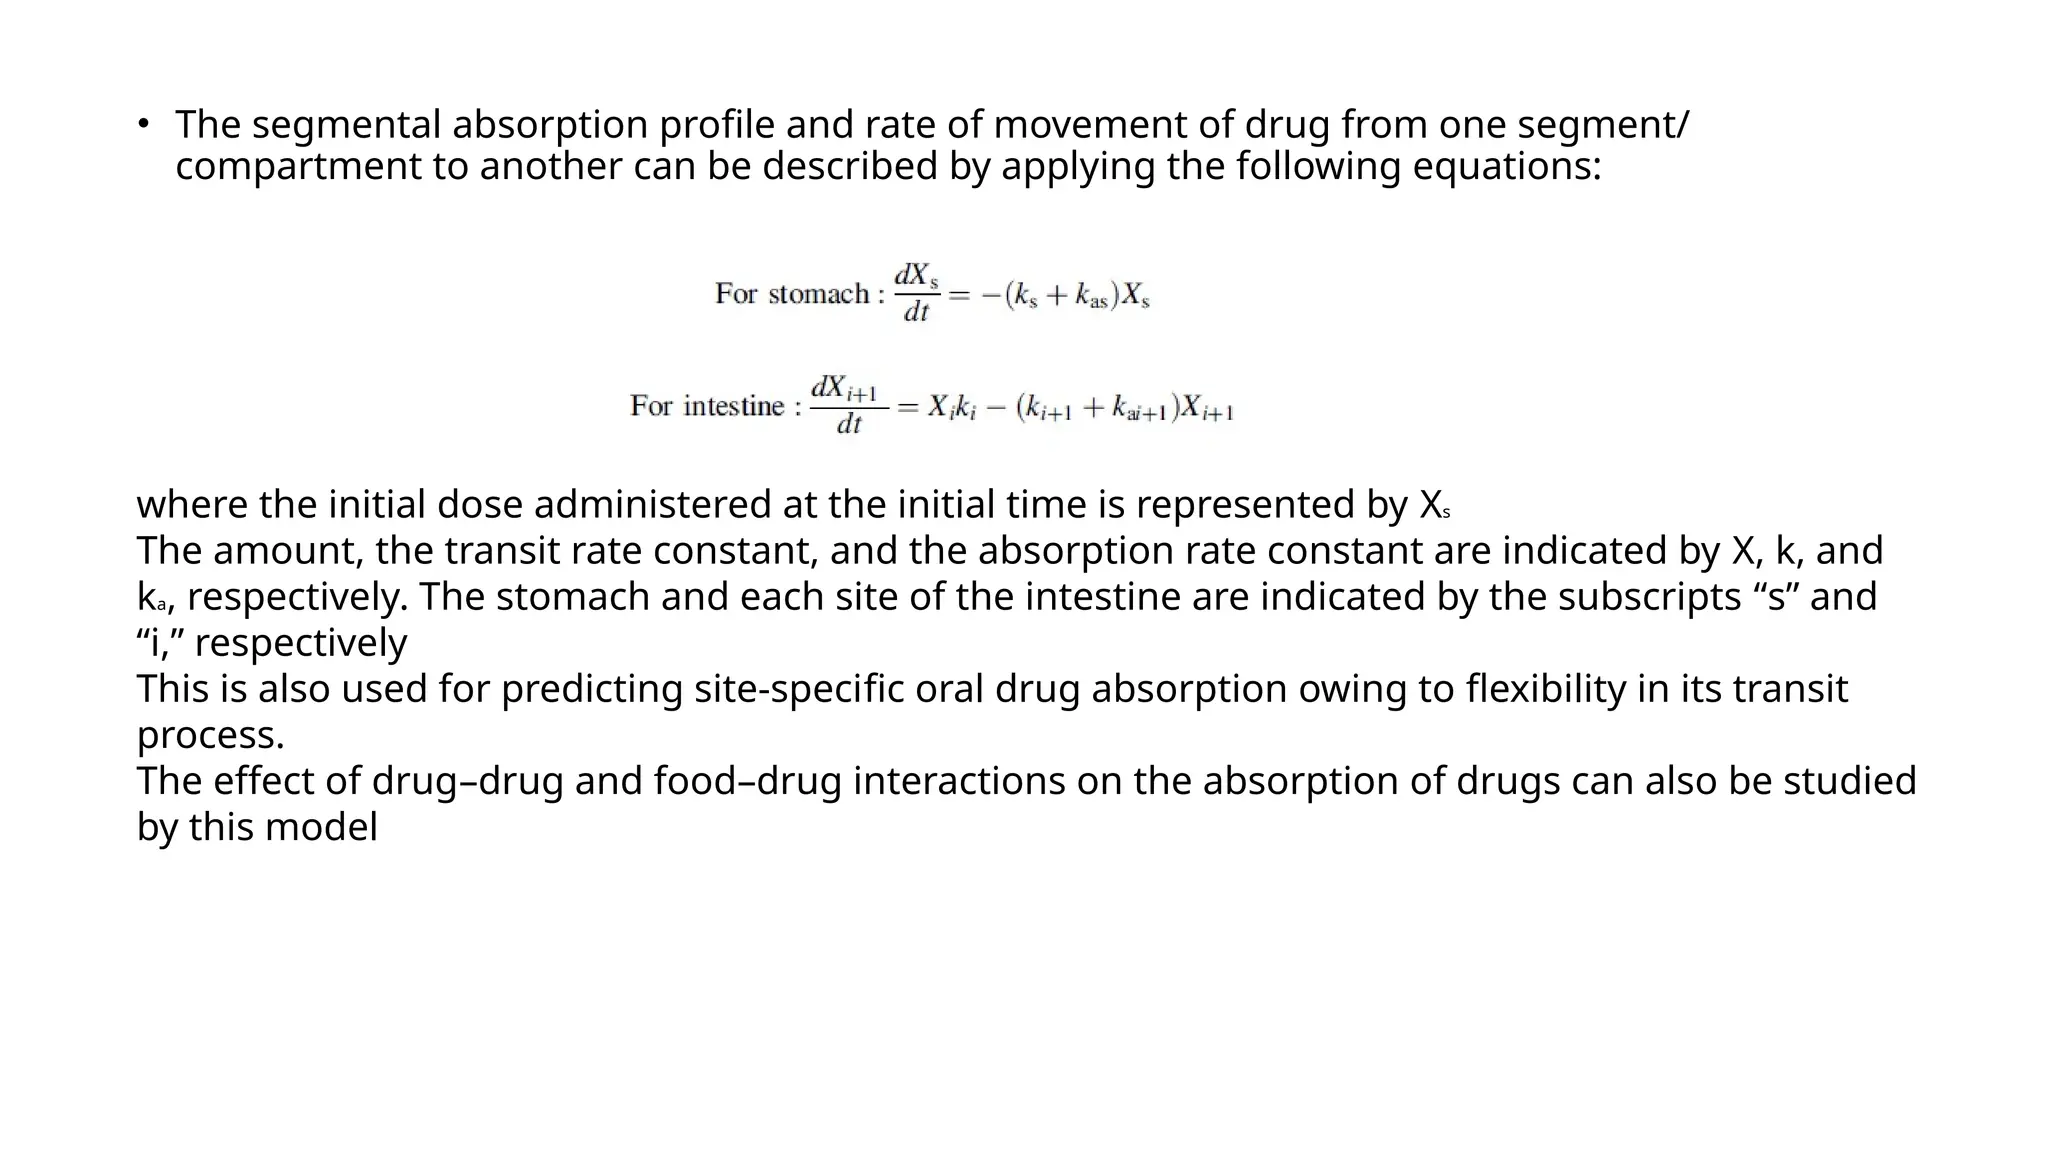
• The segmentalabsorption profile and rate of movement of drug from one segment/
compartment to another can be described by applying the following equations:
where the initial dose administered at the initial time is represented by Xs
The amount, the transit rate constant, and the absorption rate constant are indicated by X, k, and
ka, respectively. The stomach and each site of the intestine are indicated by the subscripts “s” and
“i,” respectively
This is also used for predicting site-specific oral drug absorption owing to flexibility in its transit
process.
The effect of drug–drug and food–drug interactions on the absorption of drugs can also be studied
by this model
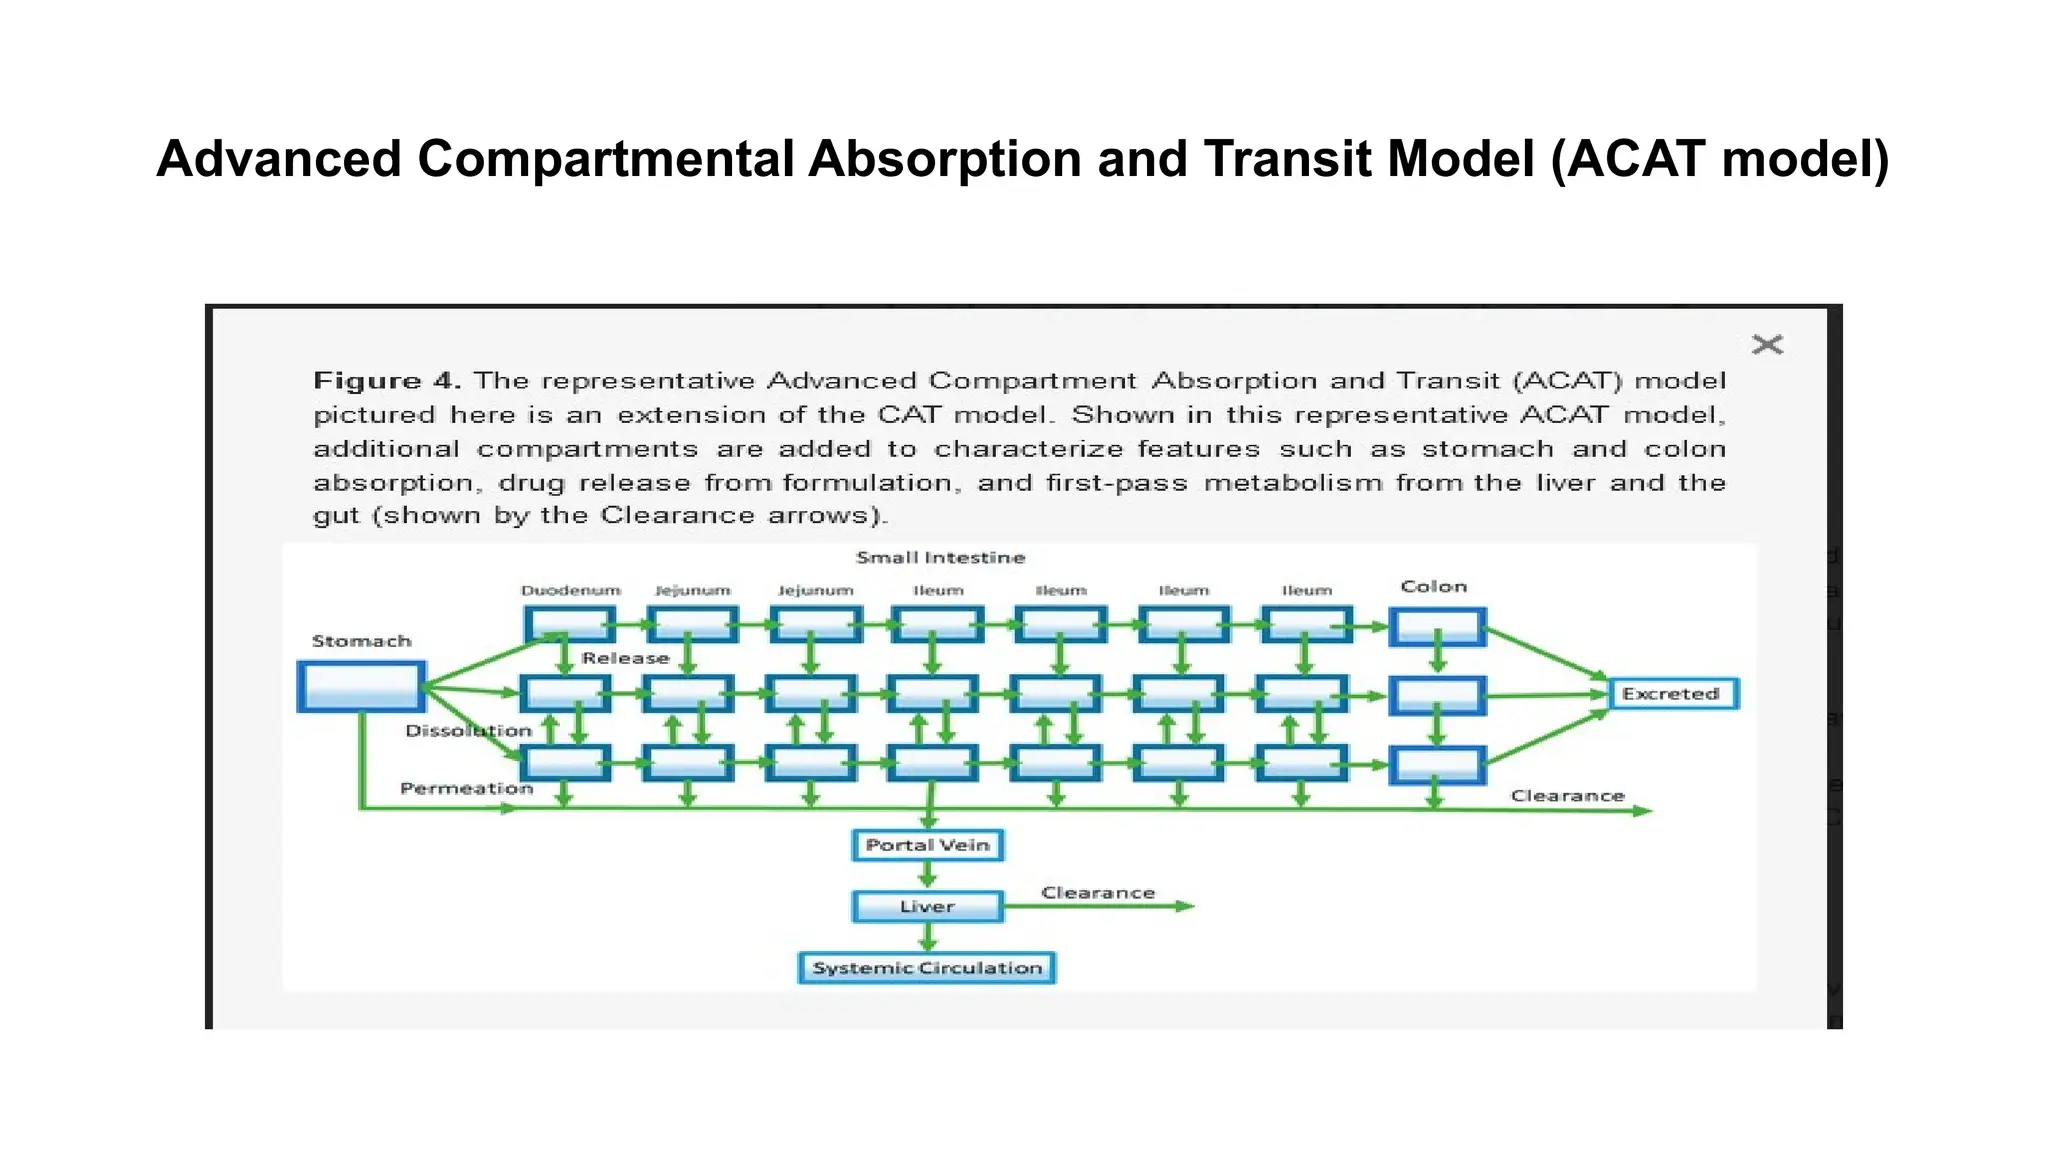
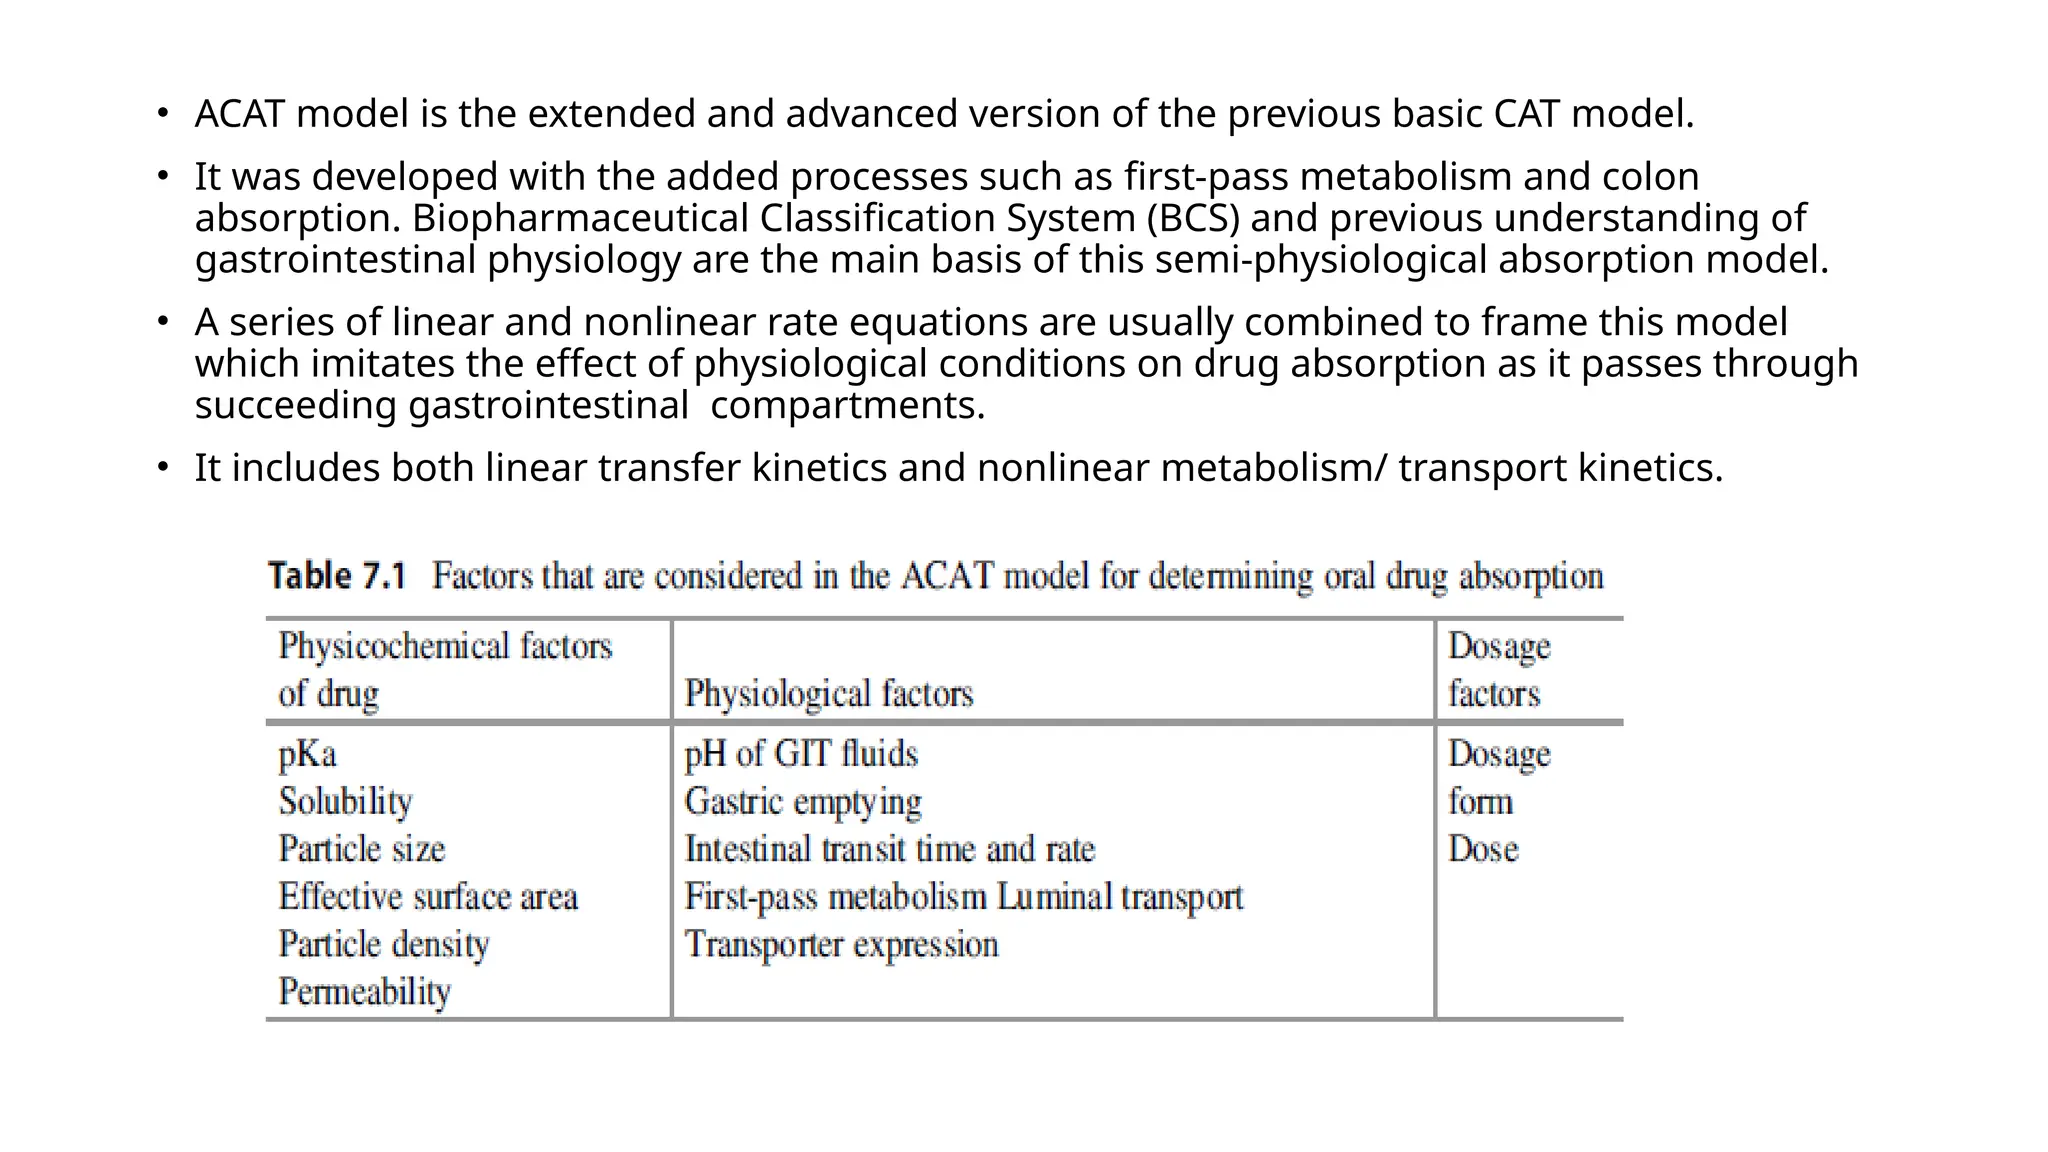
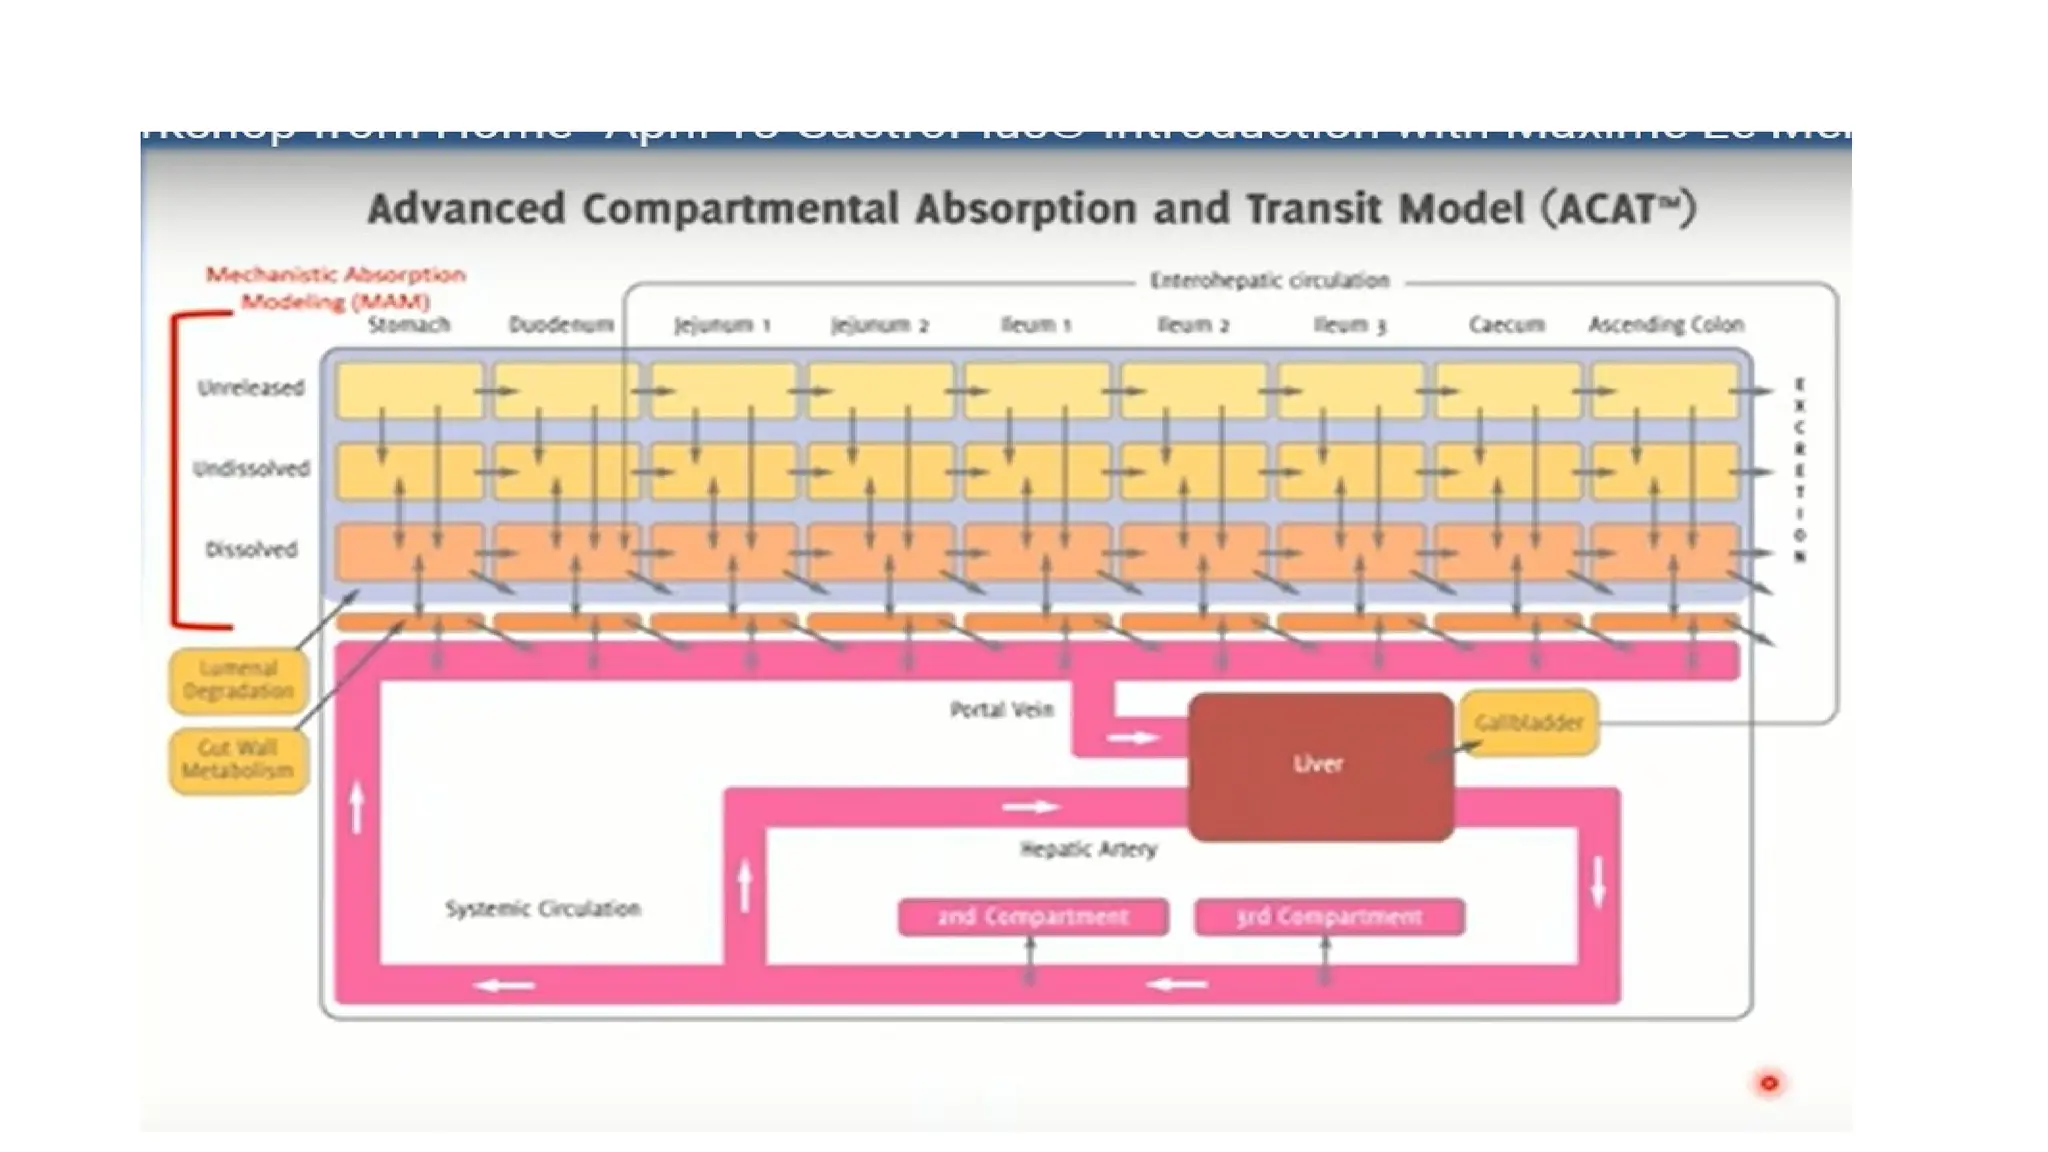
• ACAT modelis the extended and advanced version of the previous basic CAT model.
• It was developed with the added processes such as first-pass metabolism and colon
absorption. Biopharmaceutical Classification System (BCS) and previous understanding of
gastrointestinal physiology are the main basis of this semi-physiological absorption model.
• A series of linear and nonlinear rate equations are usually combined to frame this model
which imitates the effect of physiological conditions on drug absorption as it passes through
succeeding gastrointestinal compartments.
• It includes both linear transfer kinetics and nonlinear metabolism/ transport kinetics.
20.
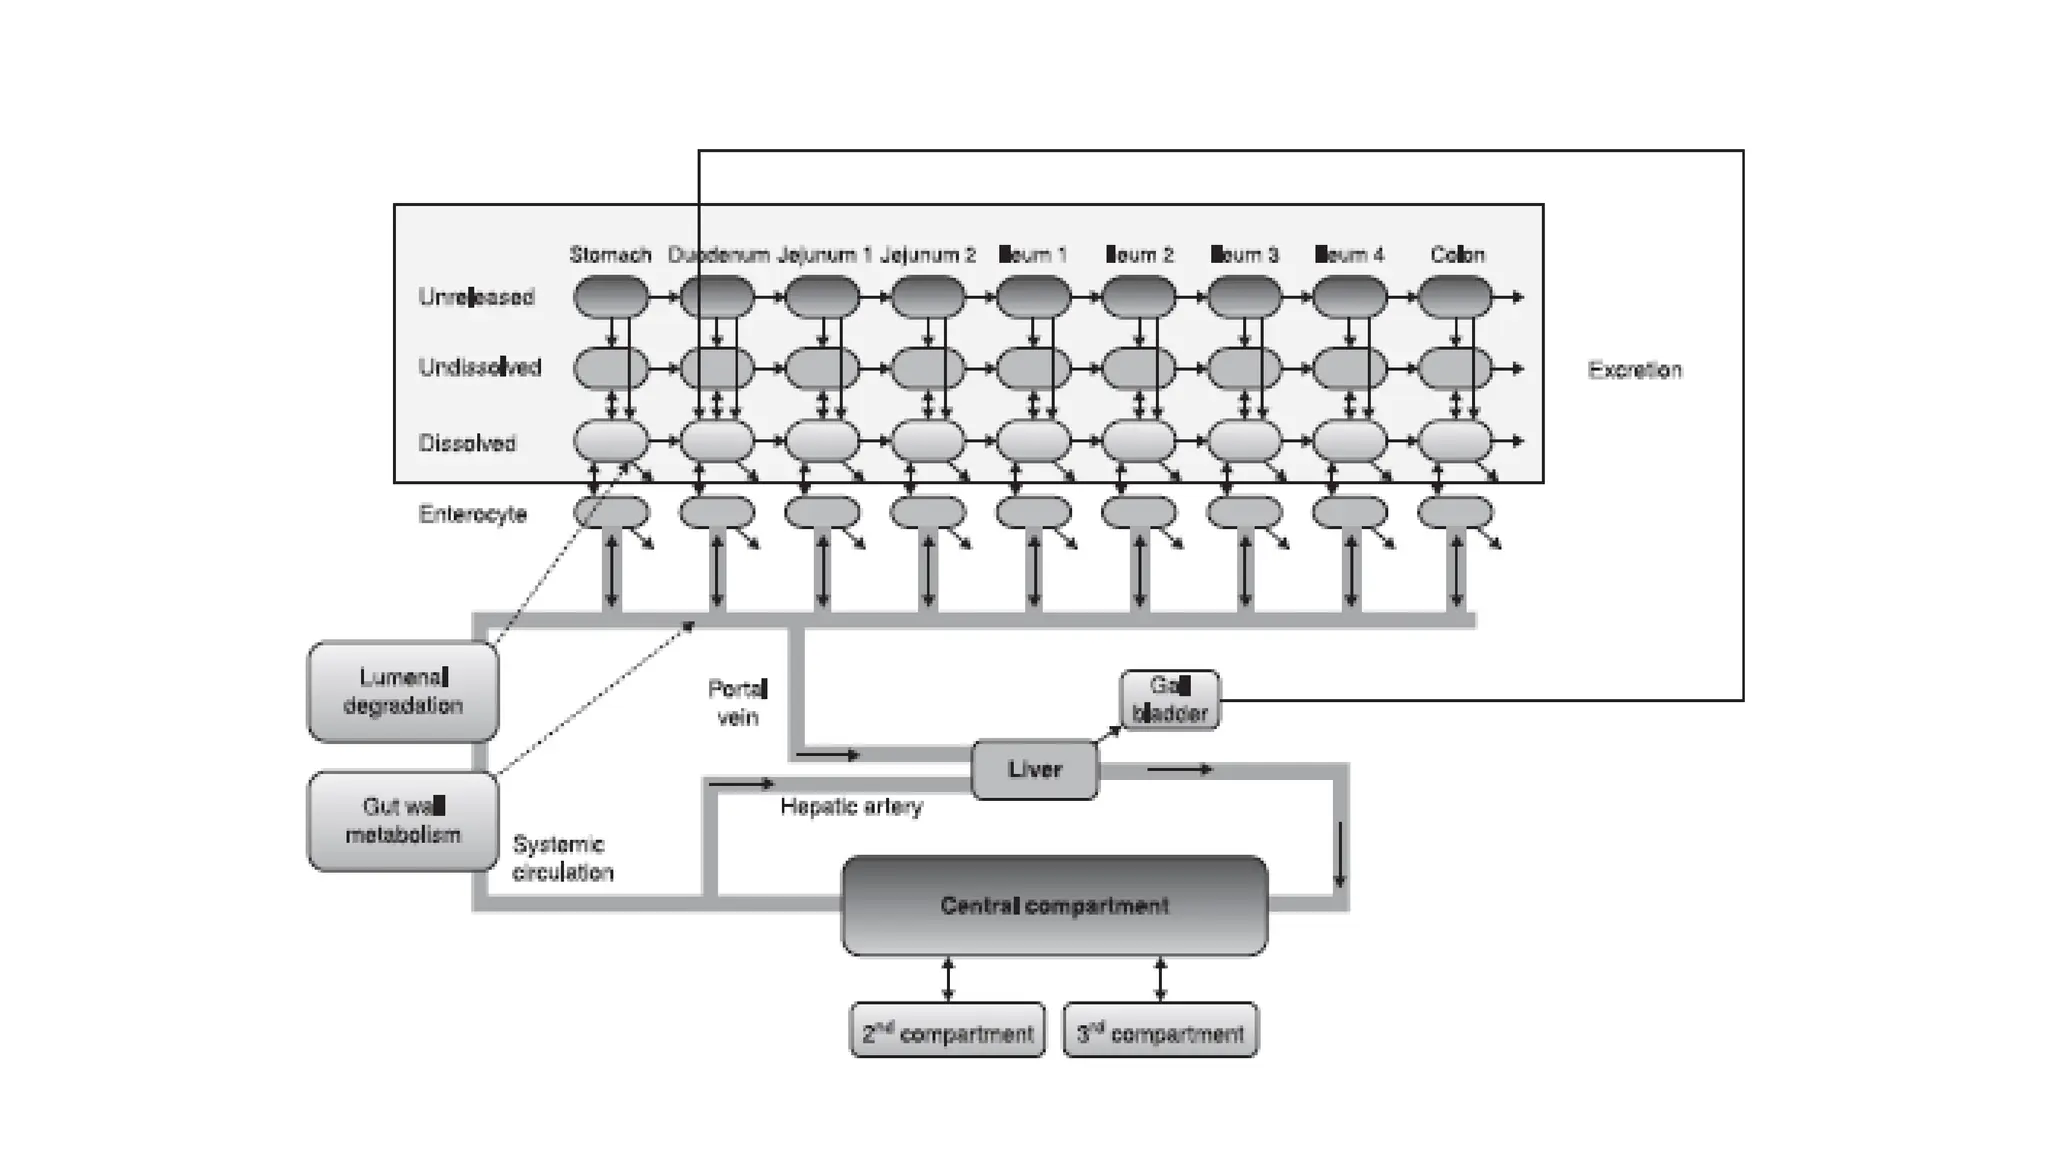
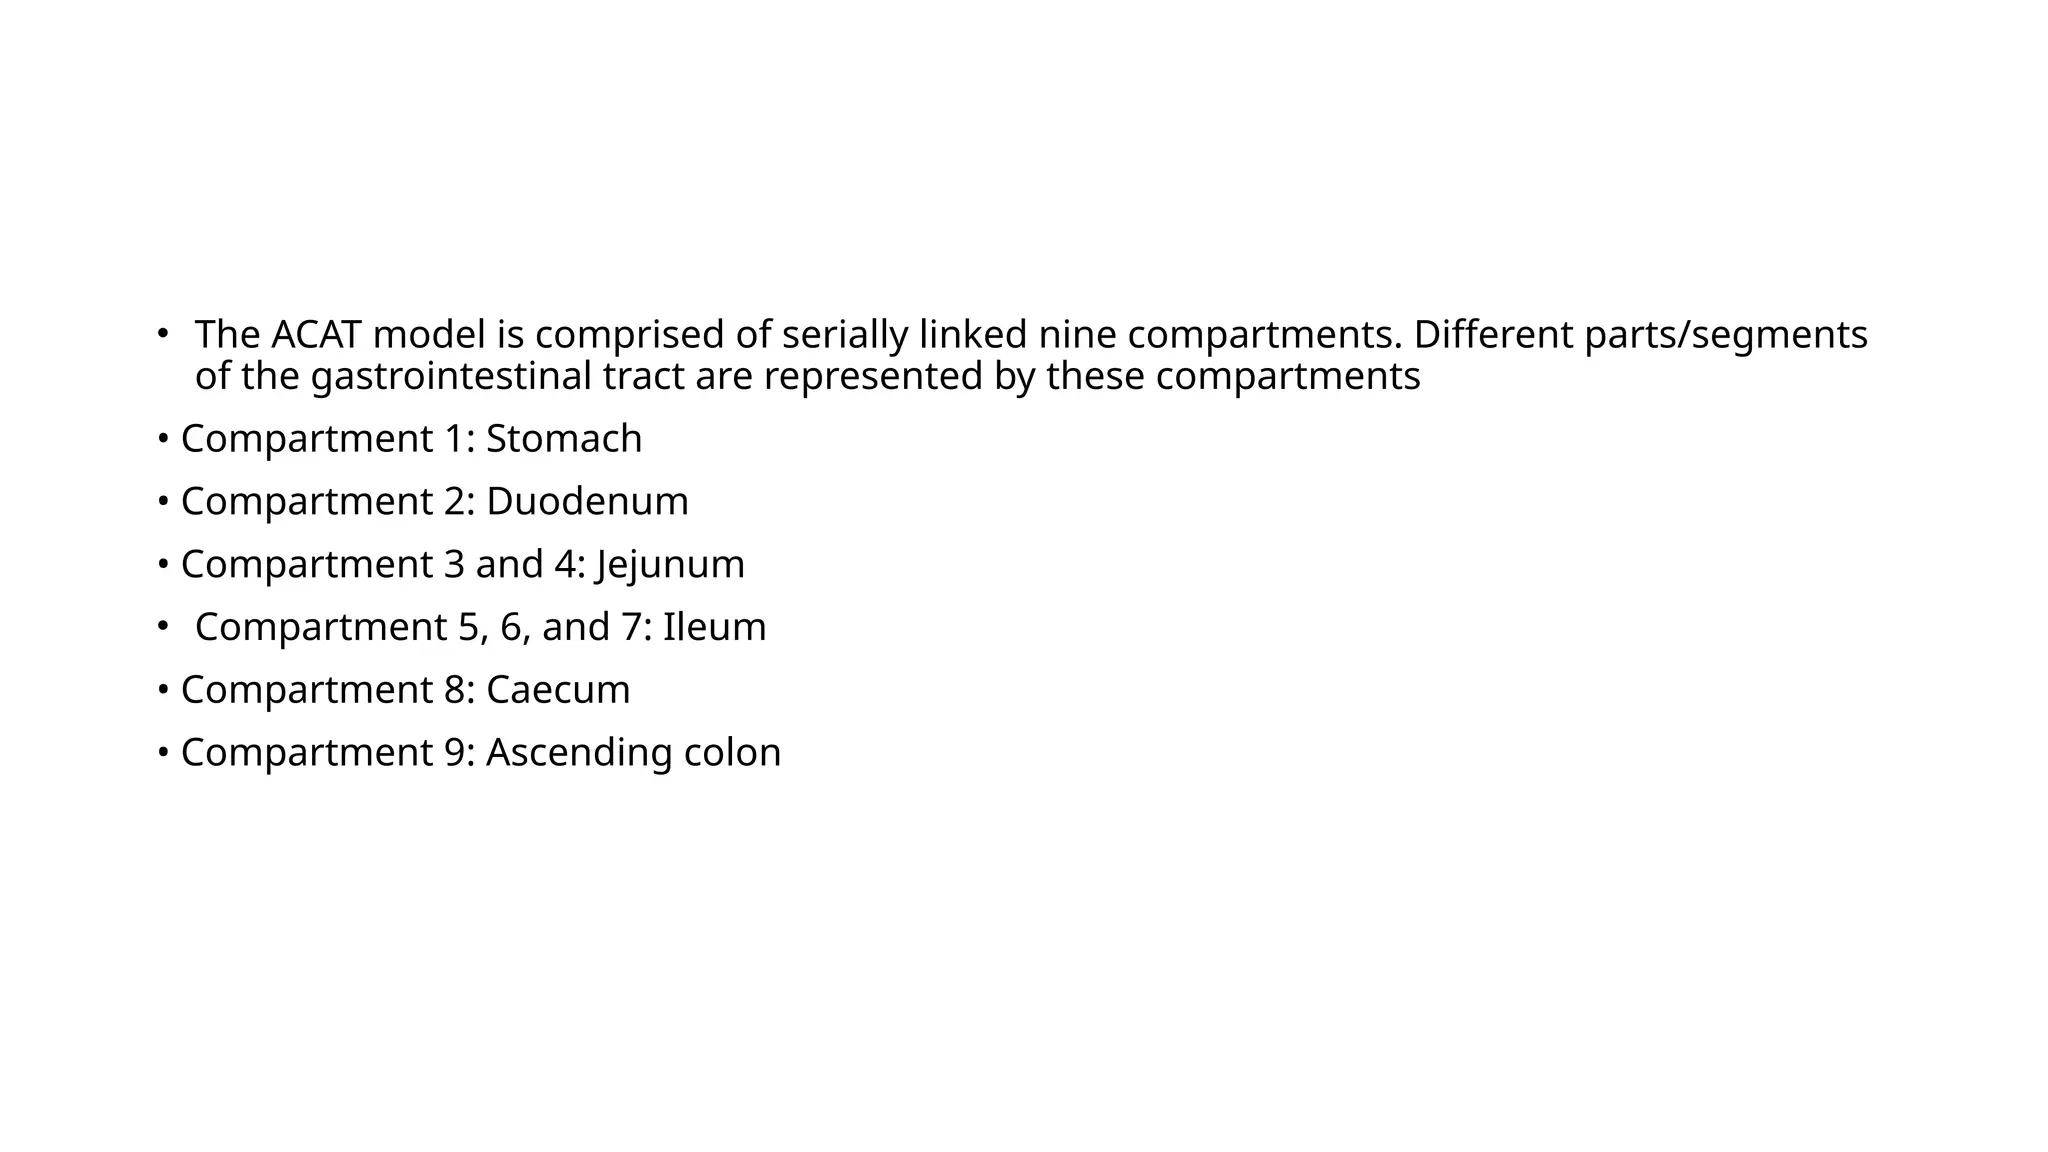
• The ACATmodel is comprised of serially linked nine compartments. Different parts/segments
of the gastrointestinal tract are represented by these compartments
• Compartment 1: Stomach
• Compartment 2: Duodenum
• Compartment 3 and 4: Jejunum
• Compartment 5, 6, and 7: Ileum
• Compartment 8: Caecum
• Compartment 9: Ascending colon
21.
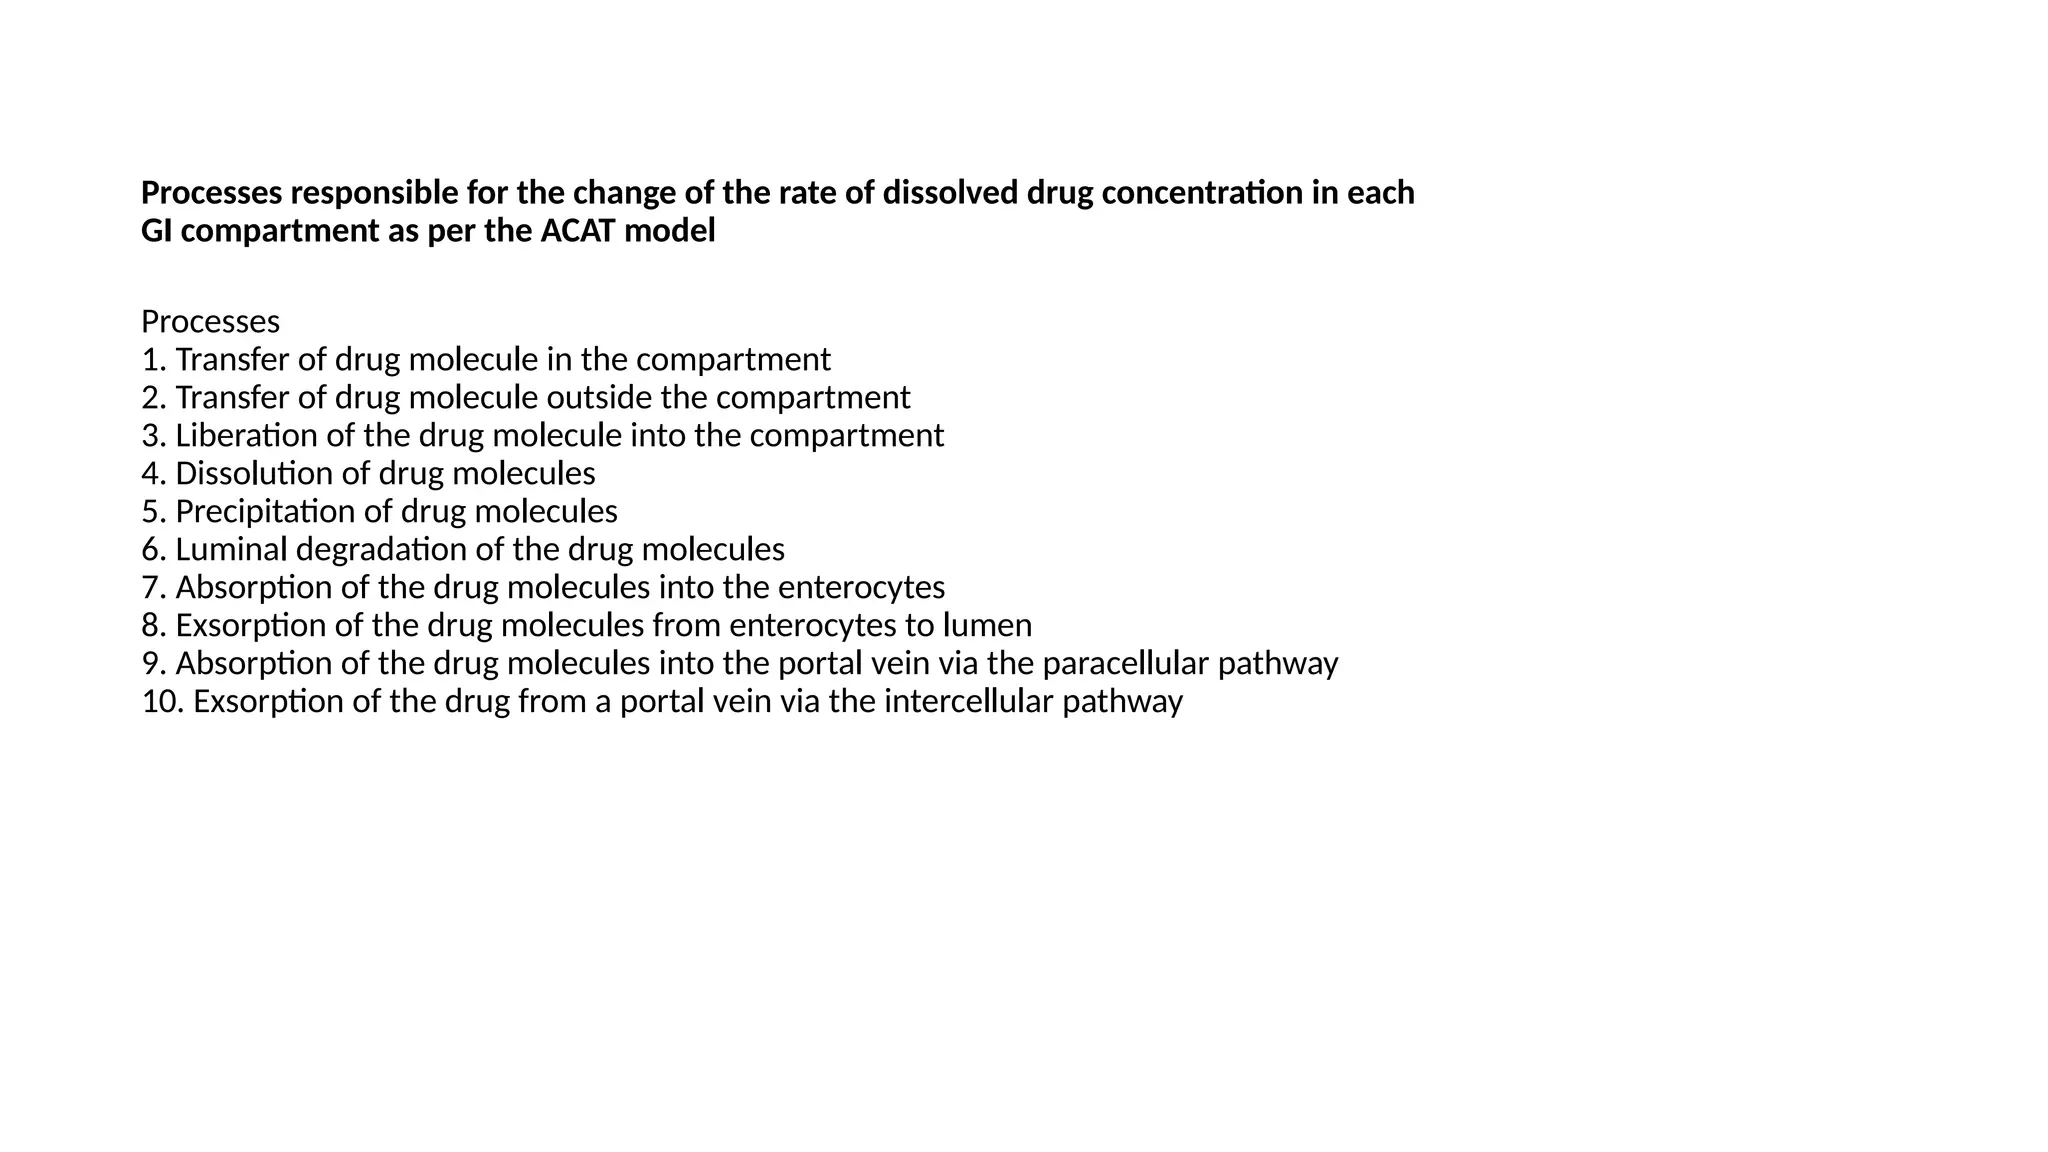
Processes responsible forthe change of the rate of dissolved drug concentration in each
GI compartment as per the ACAT model
Processes
1. Transfer of drug molecule in the compartment
2. Transfer of drug molecule outside the compartment
3. Liberation of the drug molecule into the compartment
4. Dissolution of drug molecules
5. Precipitation of drug molecules
6. Luminal degradation of the drug molecules
7. Absorption of the drug molecules into the enterocytes
8. Exsorption of the drug molecules from enterocytes to lumen
9. Absorption of the drug molecules into the portal vein via the paracellular pathway
10. Exsorption of the drug from a portal vein via the intercellular pathway
22.
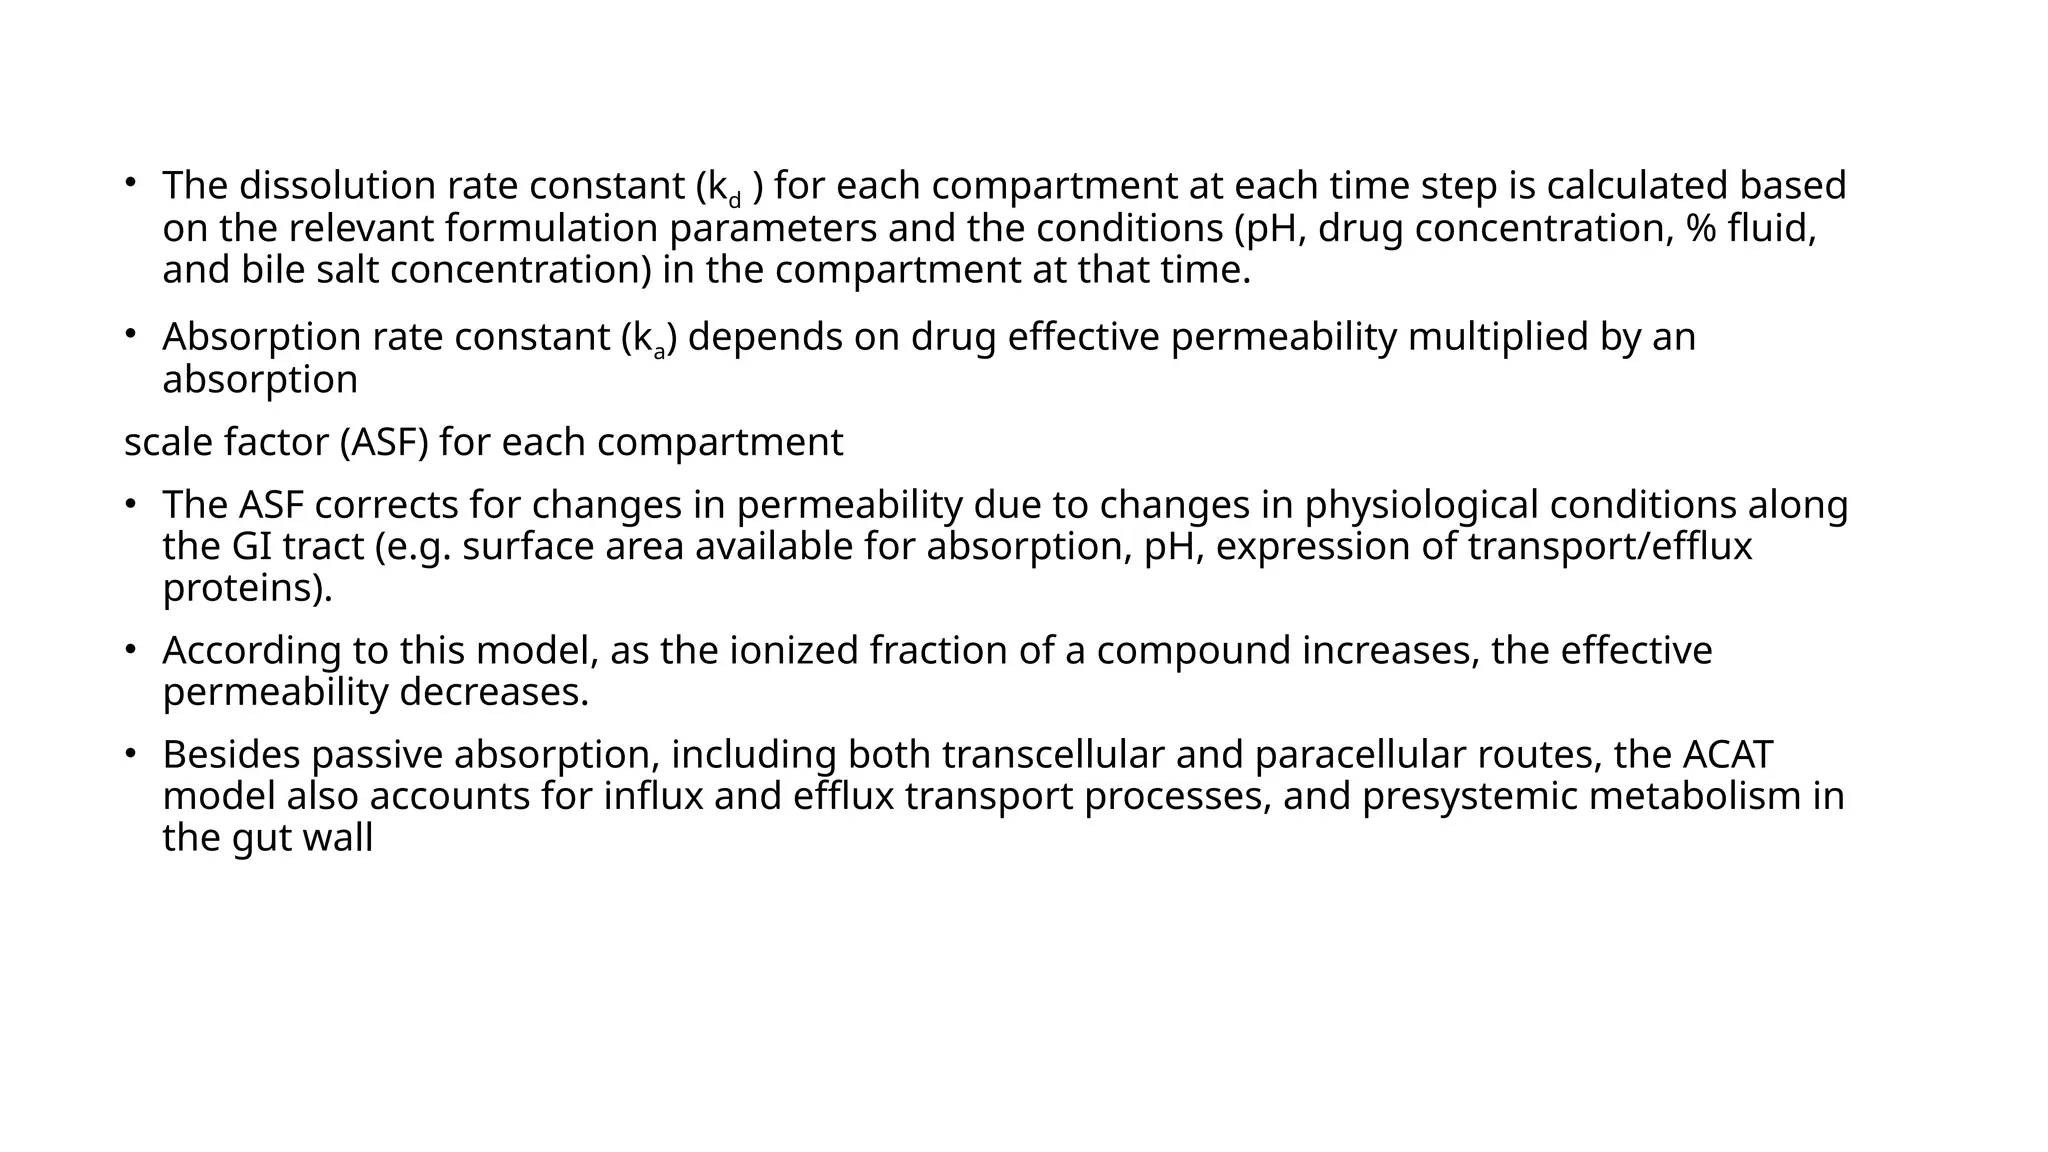
• The dissolutionrate constant (kd ) for each compartment at each time step is calculated based
on the relevant formulation parameters and the conditions (pH, drug concentration, % fluid,
and bile salt concentration) in the compartment at that time.
• Absorption rate constant (ka) depends on drug effective permeability multiplied by an
absorption
scale factor (ASF) for each compartment
• The ASF corrects for changes in permeability due to changes in physiological conditions along
the GI tract (e.g. surface area available for absorption, pH, expression of transport/efflux
proteins).
• According to this model, as the ionized fraction of a compound increases, the effective
permeability decreases.
• Besides passive absorption, including both transcellular and paracellular routes, the ACAT
model also accounts for influx and efflux transport processes, and presystemic metabolism in
the gut wall
23.
• Once thedrug passes through the basolateral membrane of enterocytes, it reaches the portal
vein and liver, where it can undergo first pass metabolism.
• From the liver, it goes into the systemic circulation from where the ACAT model is connected
to either a conventional PK compartment model or a physiologically based PK (PBPK)
disposition model.
• PBPK is an additional feature included in more recent versions of GastroPlus™.
24.
Advanced Dissolution, Absorption,and Metabolism (ADAM)
Model)
• The ADAM model is quite similar to the basic CAT and ACAT model. It also represents the small
intestine as seven different compartments similar to other compartment models.
• Similar to the CAT model, the ADAM model accounts for the processes of dissolution, GI fluid
transit, gut wall permeation, drug degradation, intestinal metabolism, and active transport
processes.
• Considerations regarding variability in the GI tract such as the varied distribution of
enterocytic blood flow, enzymes in the gut wall, food-induced changes in gastric emptying,
splanchnicmblood flow, and luminal pH are also included and simulated in the ADAM model.
• The main difference between the ADAM and CAT model is that in the ADAM model, the
dissolution is calculated using the more sophisticated Wang–Flanagan generalized model
rather than the conventional Noyes–Whitney equation.
• Commercially available simulation software Simcyp® (http://www.simCYP.com) was developed
to integrate the ADAM model [35]. Formerly, it was introduced as a simulator for the
metabolism process, but later on, it was expanded for determining pharmacokinetic
properties of drugs including absorption.
25.
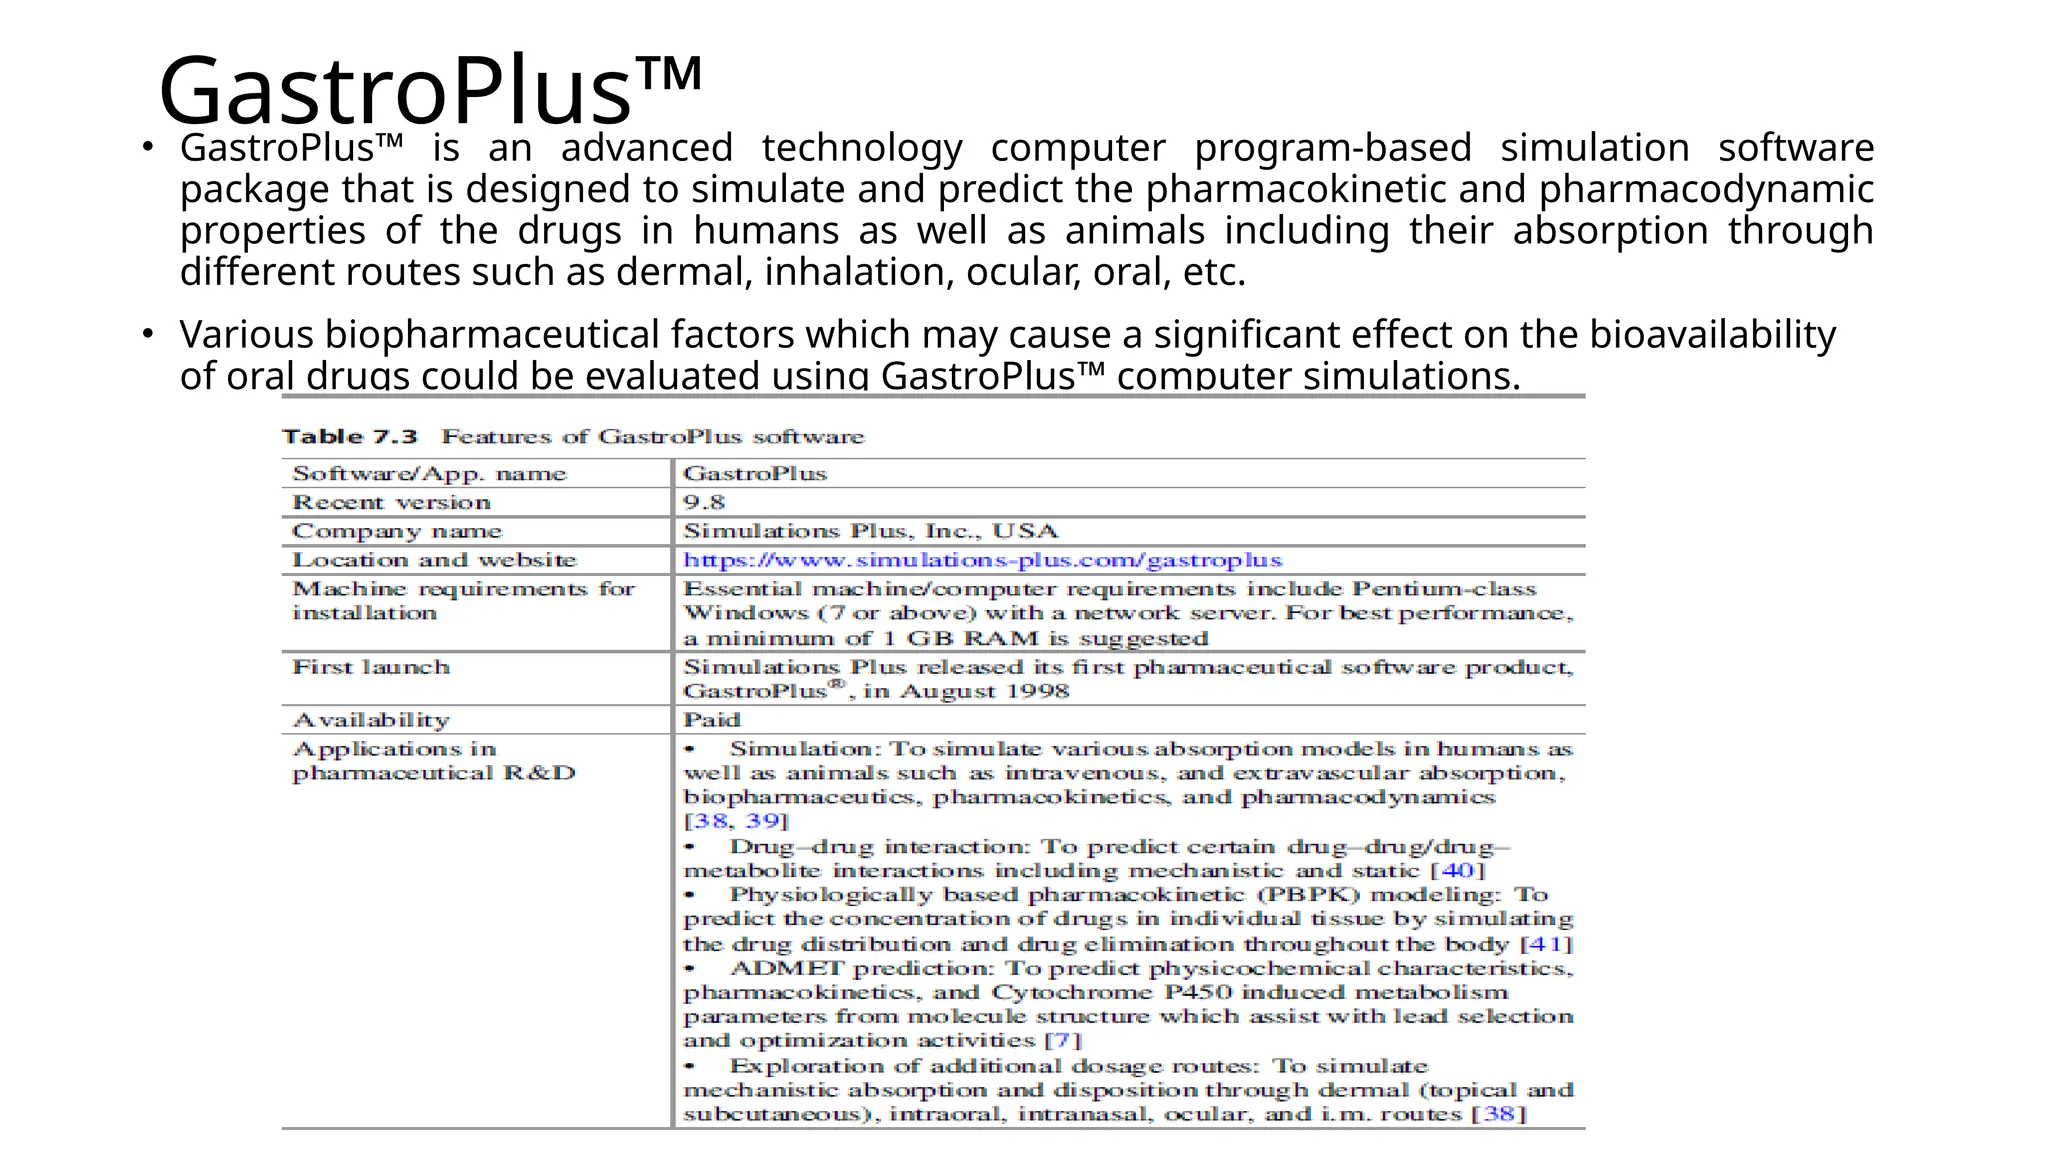
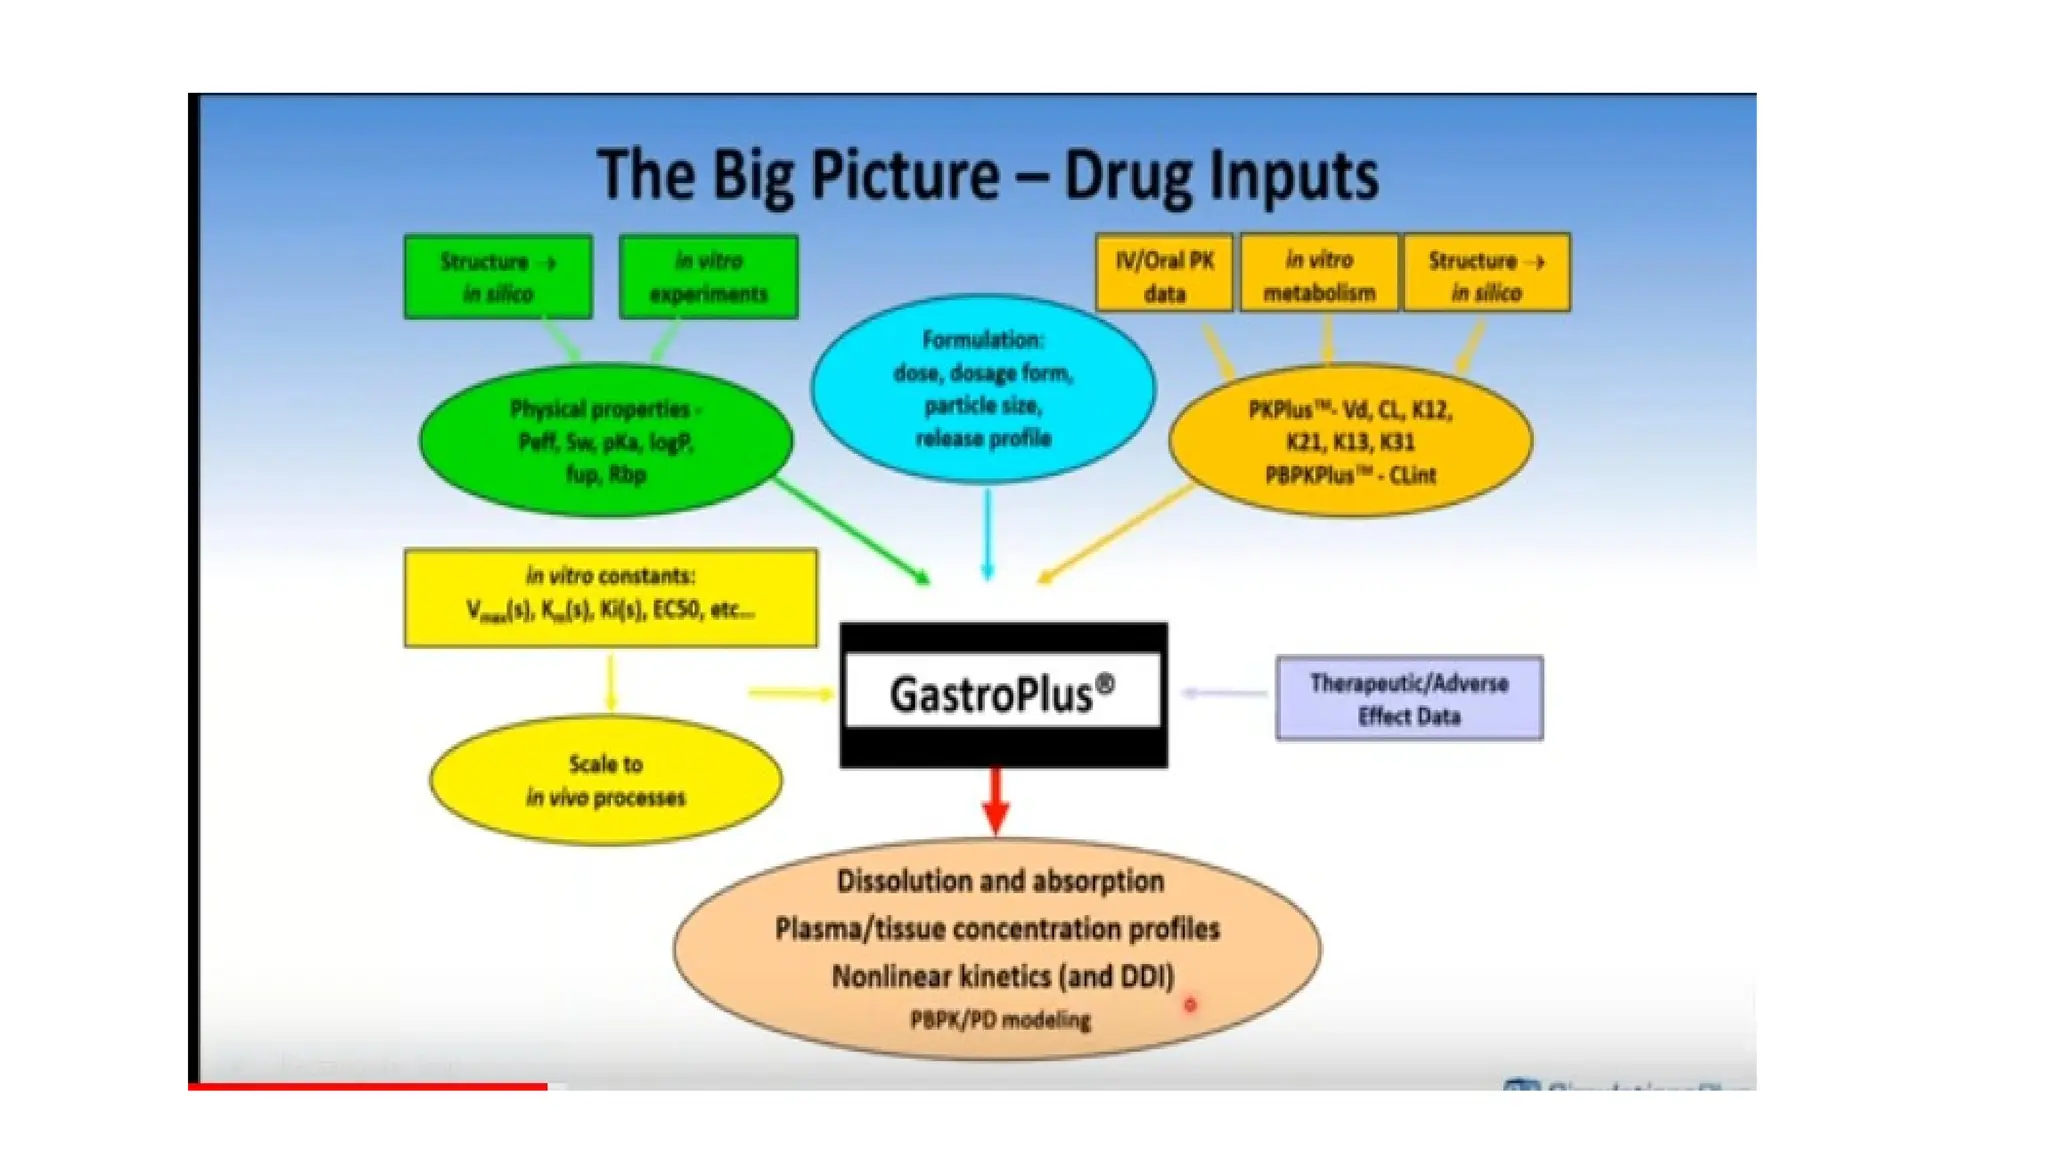
GastroPlus™
• GastroPlus™ isan advanced technology computer program-based simulation software
package that is designed to simulate and predict the pharmacokinetic and pharmacodynamic
properties of the drugs in humans as well as animals including their absorption through
different routes such as dermal, inhalation, ocular, oral, etc.
• Various biopharmaceutical factors which may cause a significant effect on the bioavailability
of oral drugs could be evaluated using GastroPlus™ computer simulations.
29.
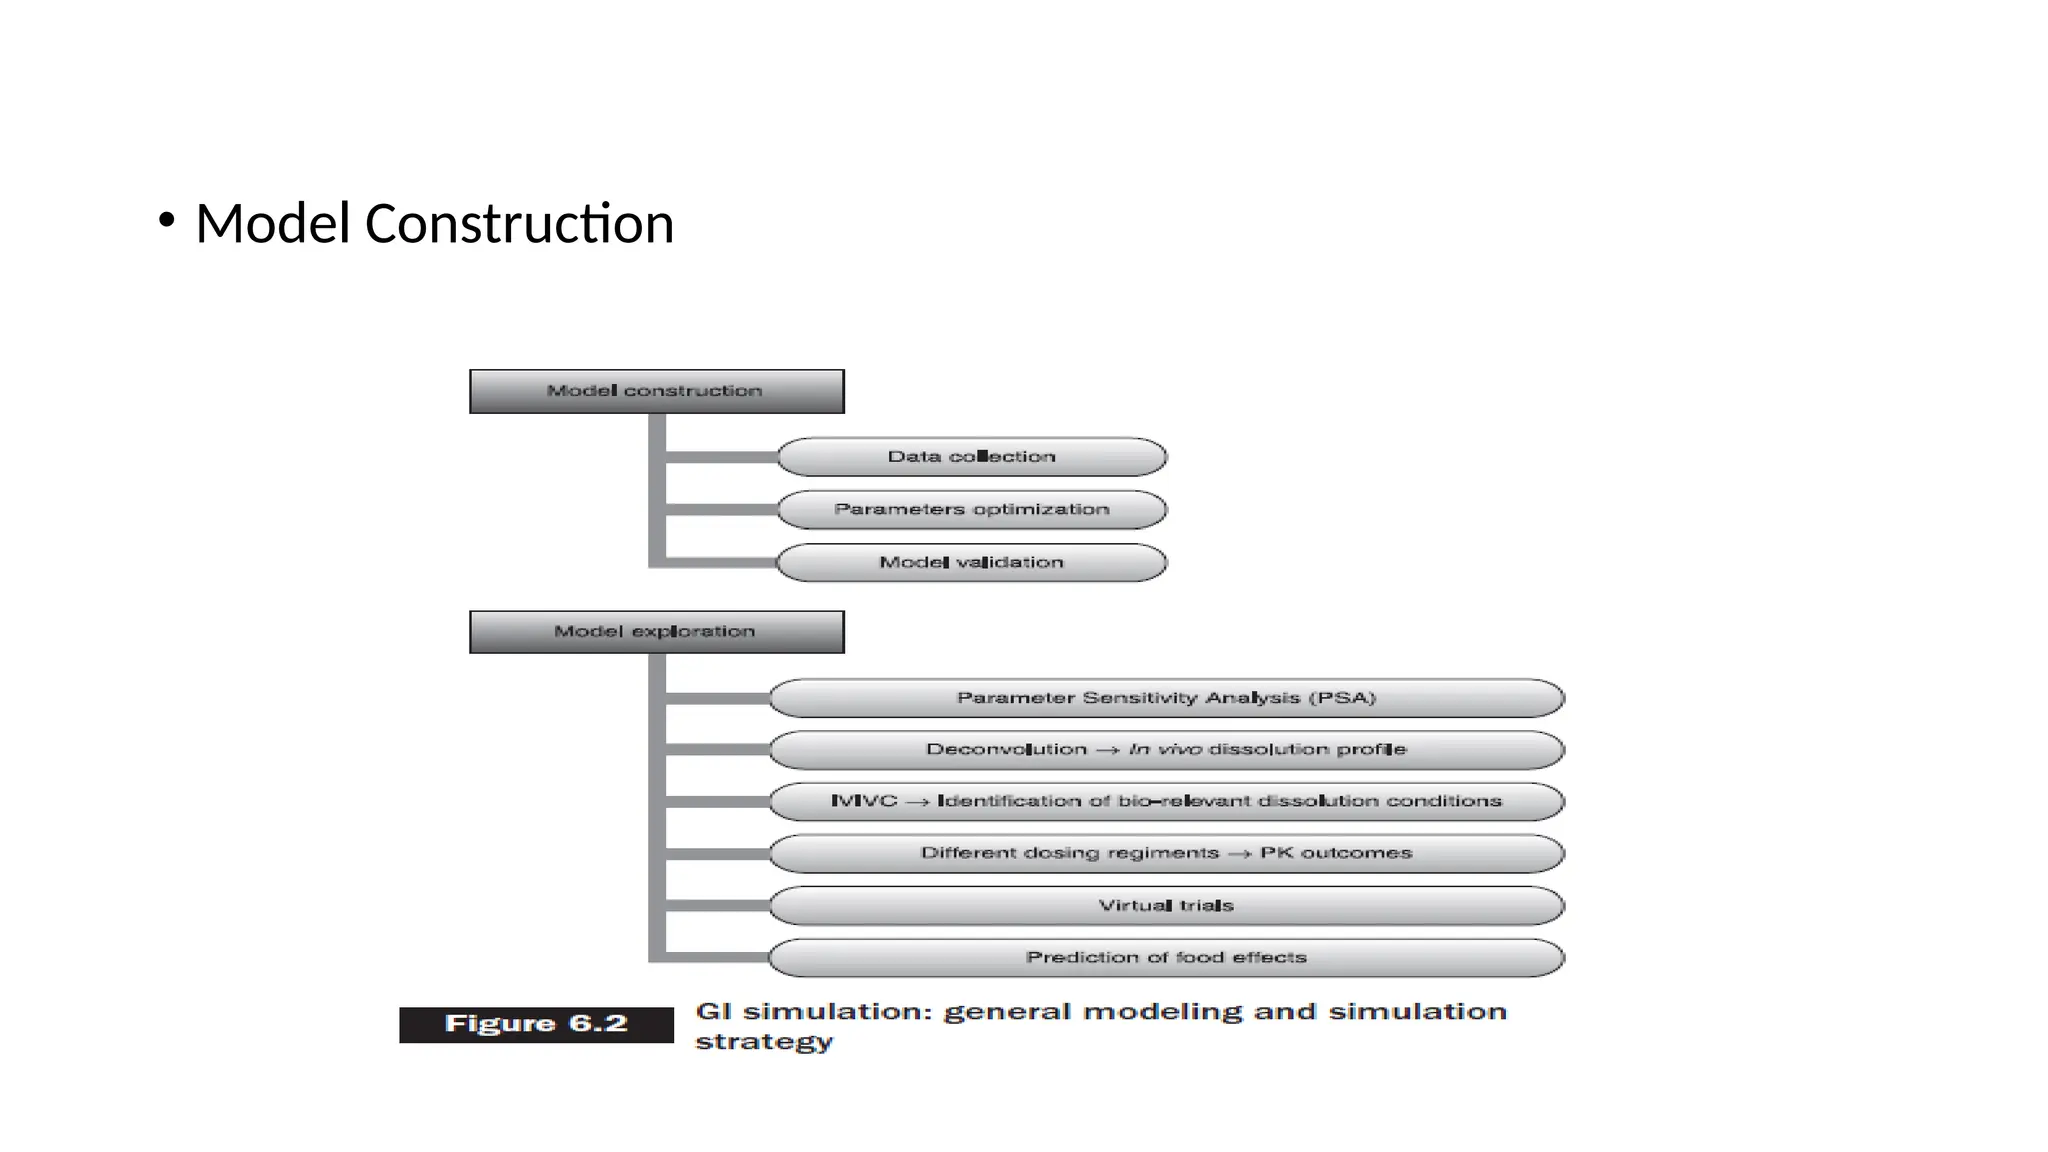
Model construction
• Theinitial step for model construction is data collection.
• Several input parameters are required in the mechanistic absorption model, which can either
be predicted using in silico techniques, literature survey, or can be determined
experimentally.
• Drug or dosage form-related properties such as drug solubility and its relationship with pH of
the aqueous solvent, particle size, drug permeability, type of dosage form, etc. can be
predicted either experimentally (in vitro and in vivo) or in silico can be used as input data for
the model.
• Certain physiological factors (such as gastrointestinal transit time, gastric emptying time,
gastric pH, the surface area of absorption site, concentration of bile salt and other enzymes,
size of compartment, fluid volume, etc.) are by default entered into the model and, however,
can be modified also as per the user requirements.
• Alternatively, the full ADMET Predictor program or the optional ADMET Predictor™ module
helps in predicting some input parameters for the GastroPlus model using the structural
features of the molecule
30.
• Biopharmaceutical propertiesof several drugs and dosage forms have been characterized
using the same methodologies such as gastrointestinal simulation of “nimesulide oral
absorption” which was carried out by Grbic and co-workers in 2012 [43].
• In this study, two self-regulating analysts have constructed drug-specific models for
absorption utilizing identical data (in vivo); however, in both cases, different assumptions
regarding major factors affecting the absorption of nimesulide were considered.
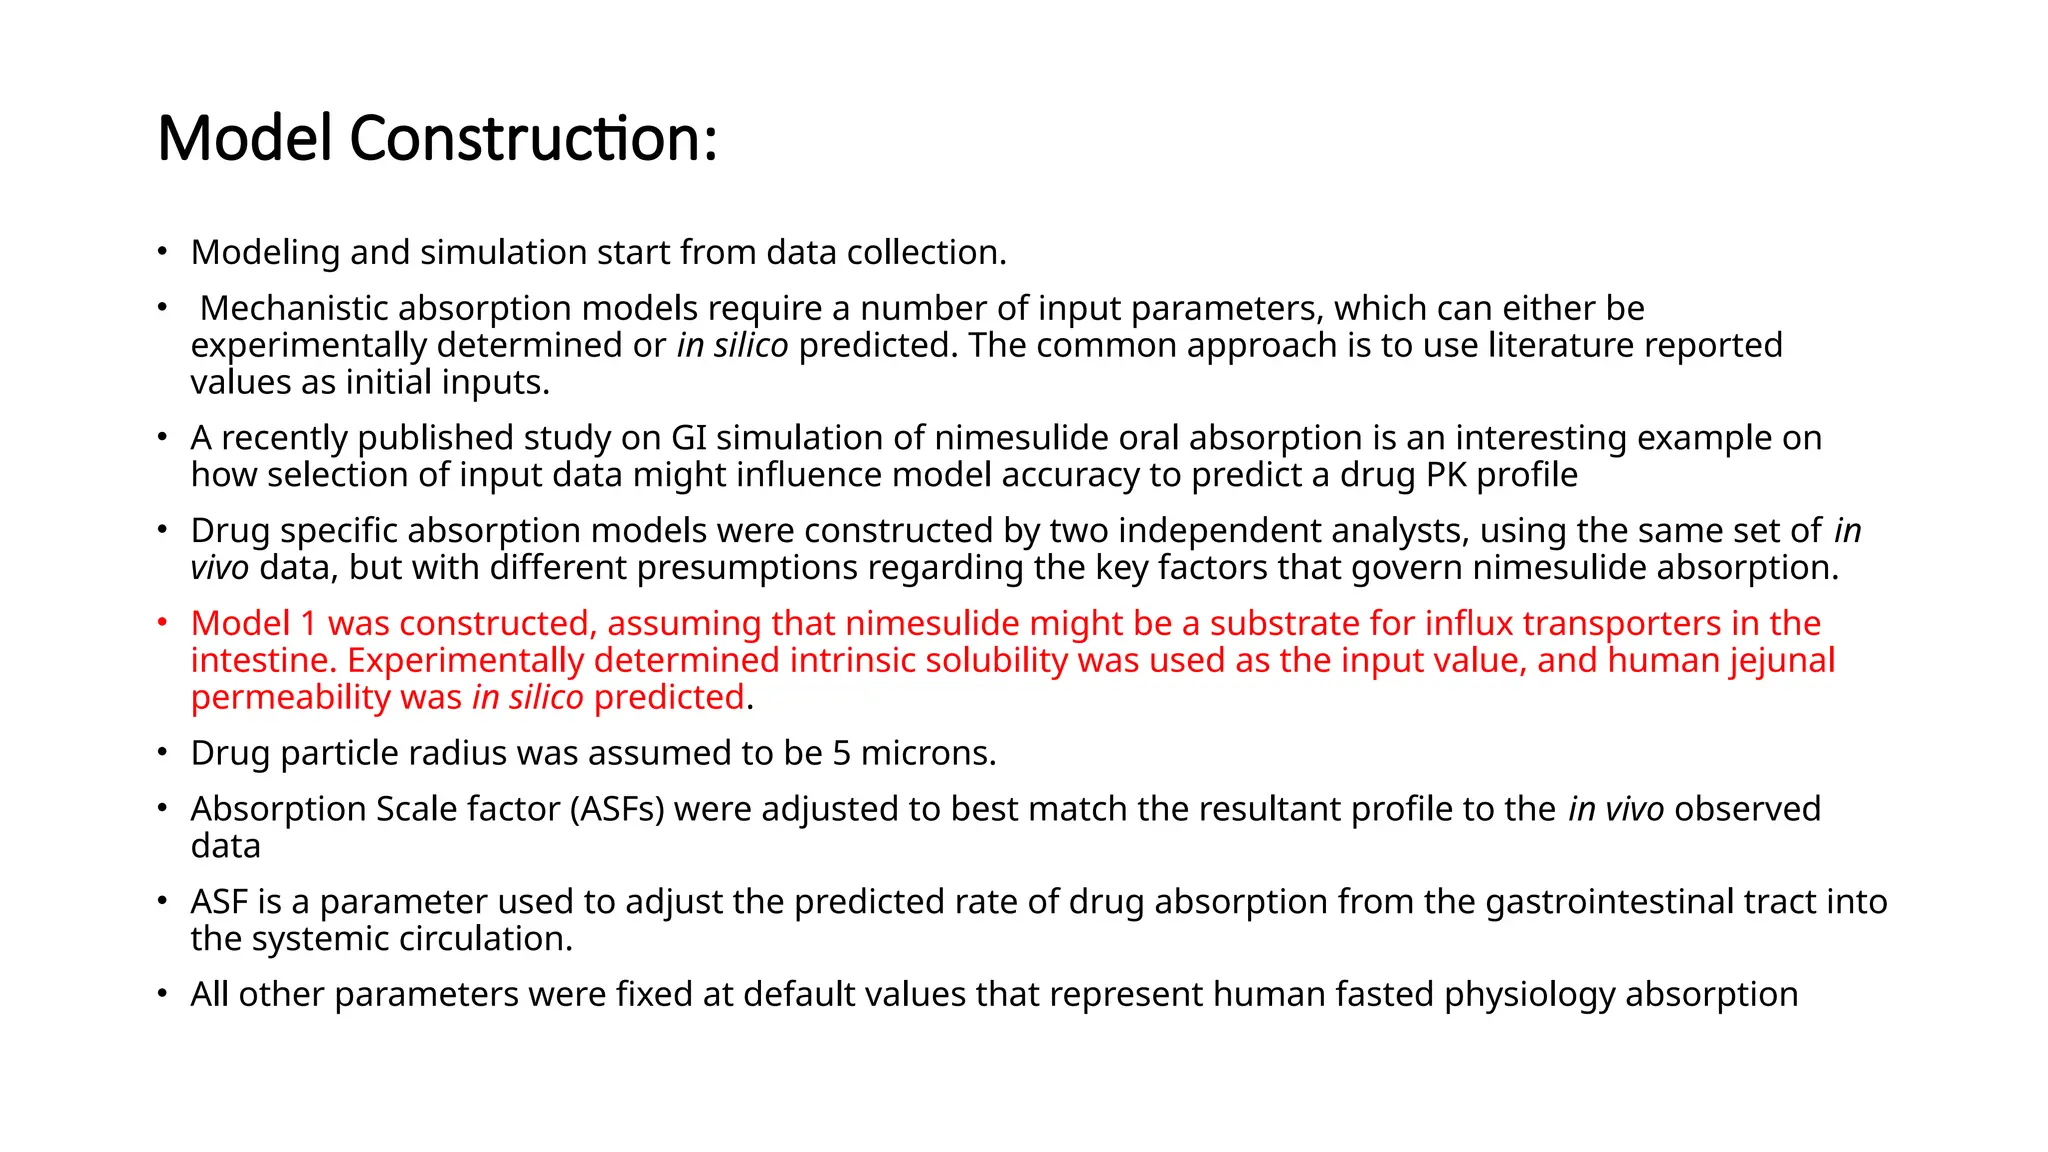
Model Construction:
• Modelingand simulation start from data collection.
• Mechanistic absorption models require a number of input parameters, which can either be
experimentally determined or in silico predicted. The common approach is to use literature reported
values as initial inputs.
• A recently published study on GI simulation of nimesulide oral absorption is an interesting example on
how selection of input data might influence model accuracy to predict a drug PK profile
• Drug specific absorption models were constructed by two independent analysts, using the same set of in
vivo data, but with different presumptions regarding the key factors that govern nimesulide absorption.
• Model 1 was constructed, assuming that nimesulide might be a substrate for influx transporters in the
intestine. Experimentally determined intrinsic solubility was used as the input value, and human jejunal
permeability was in silico predicted.
• Drug particle radius was assumed to be 5 microns.
• Absorption Scale factor (ASFs) were adjusted to best match the resultant profile to the in vivo observed
data
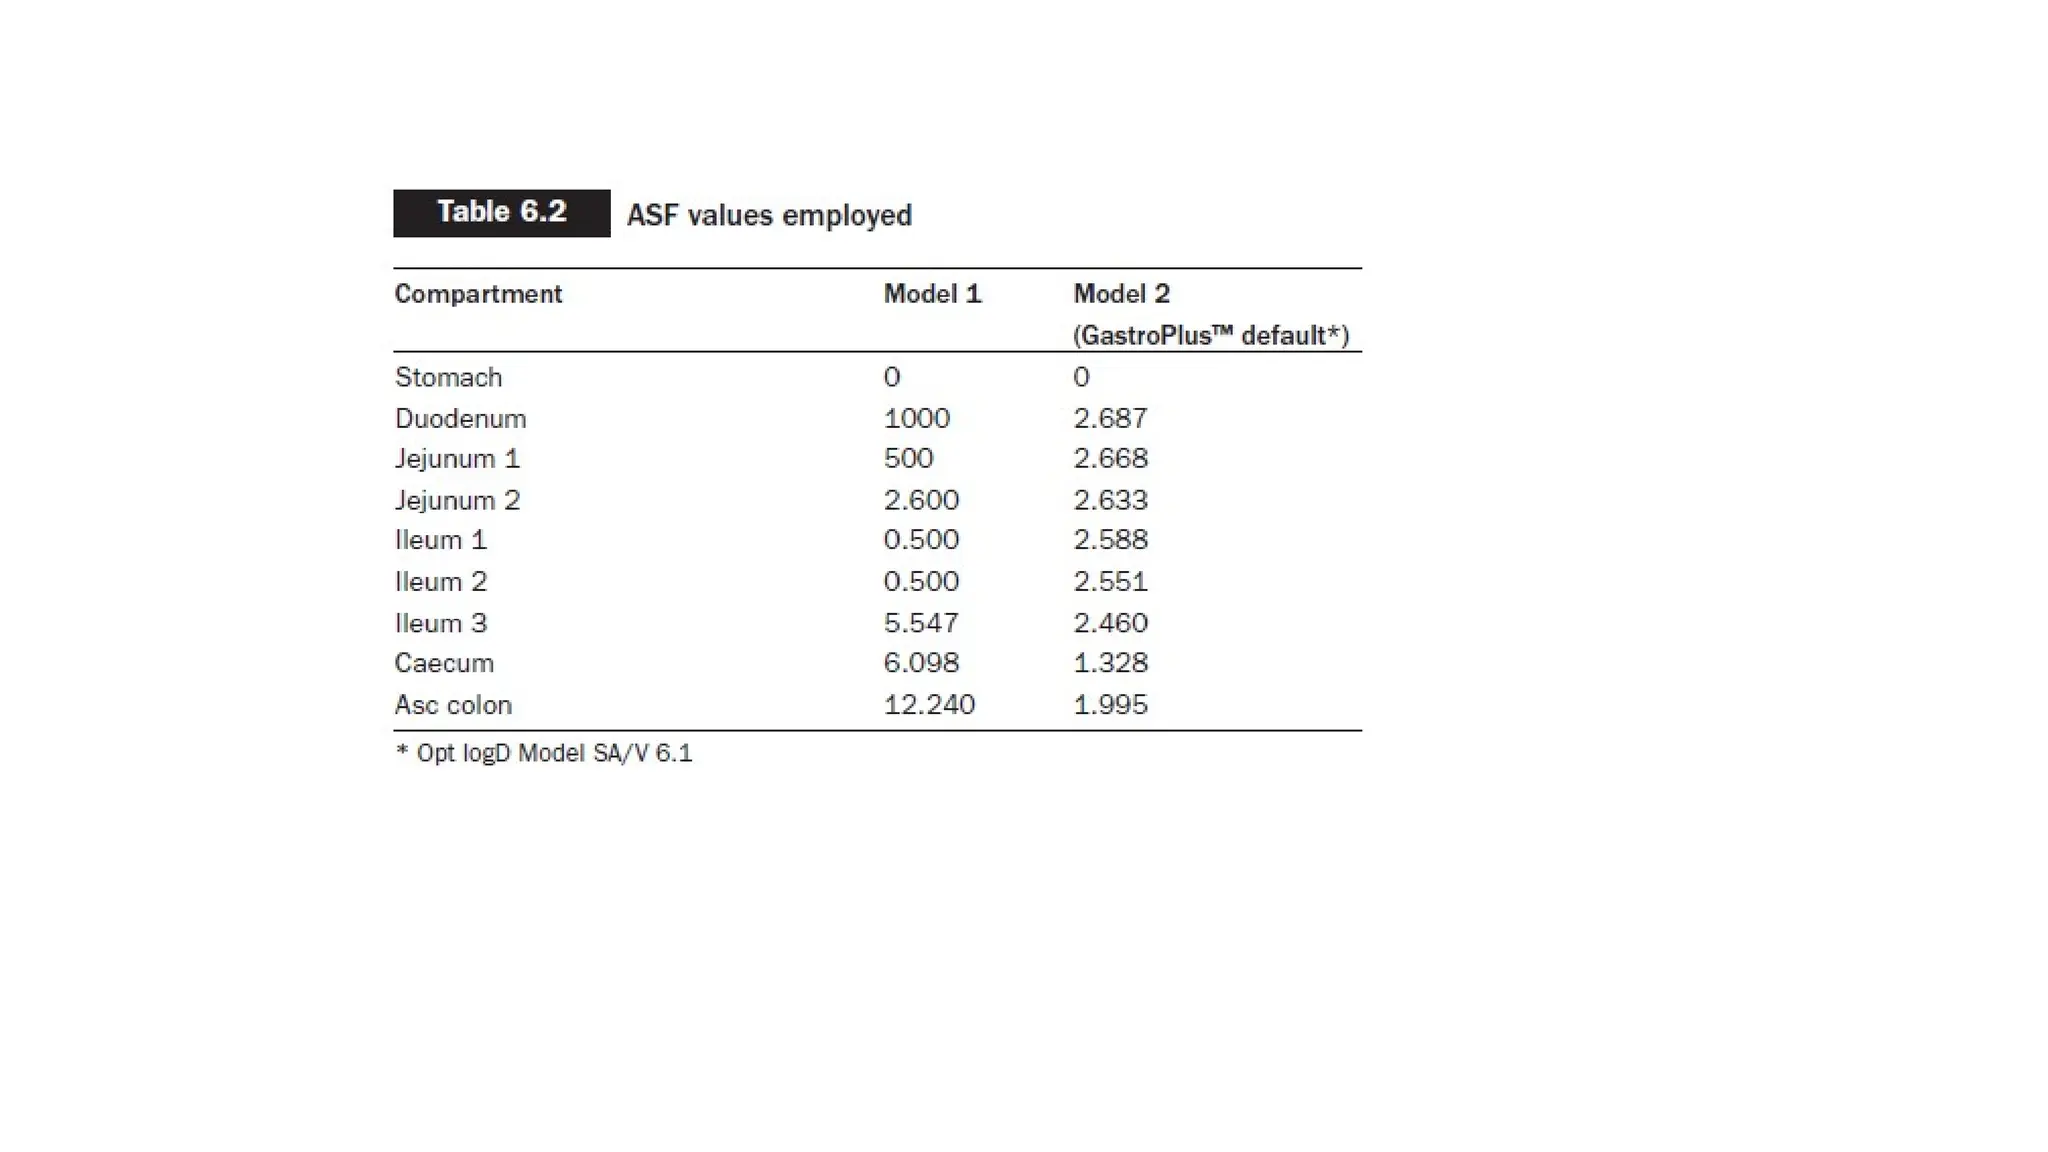
• ASF is a parameter used to adjust the predicted rate of drug absorption from the gastrointestinal tract into
the systemic circulation.
• All other parameters were fixed at default values that represent human fasted physiology absorption
33.
Model 2was based on the comparative study of two dosage forms of nimesulide (immediate-
release
(IR) suspension and IR tablet).
The absorption model was initially constructed for IR suspension, and was afterwards
validated for IR tablet
formulation.
The main premise in Model 2 was that nimesulide is well absorbed after oral administration
mainly due to the pH-surfactant induced increase in solubility in the GI milieu.
• Therefore, the ASFs were kept on default GastroPlus™ values
36.
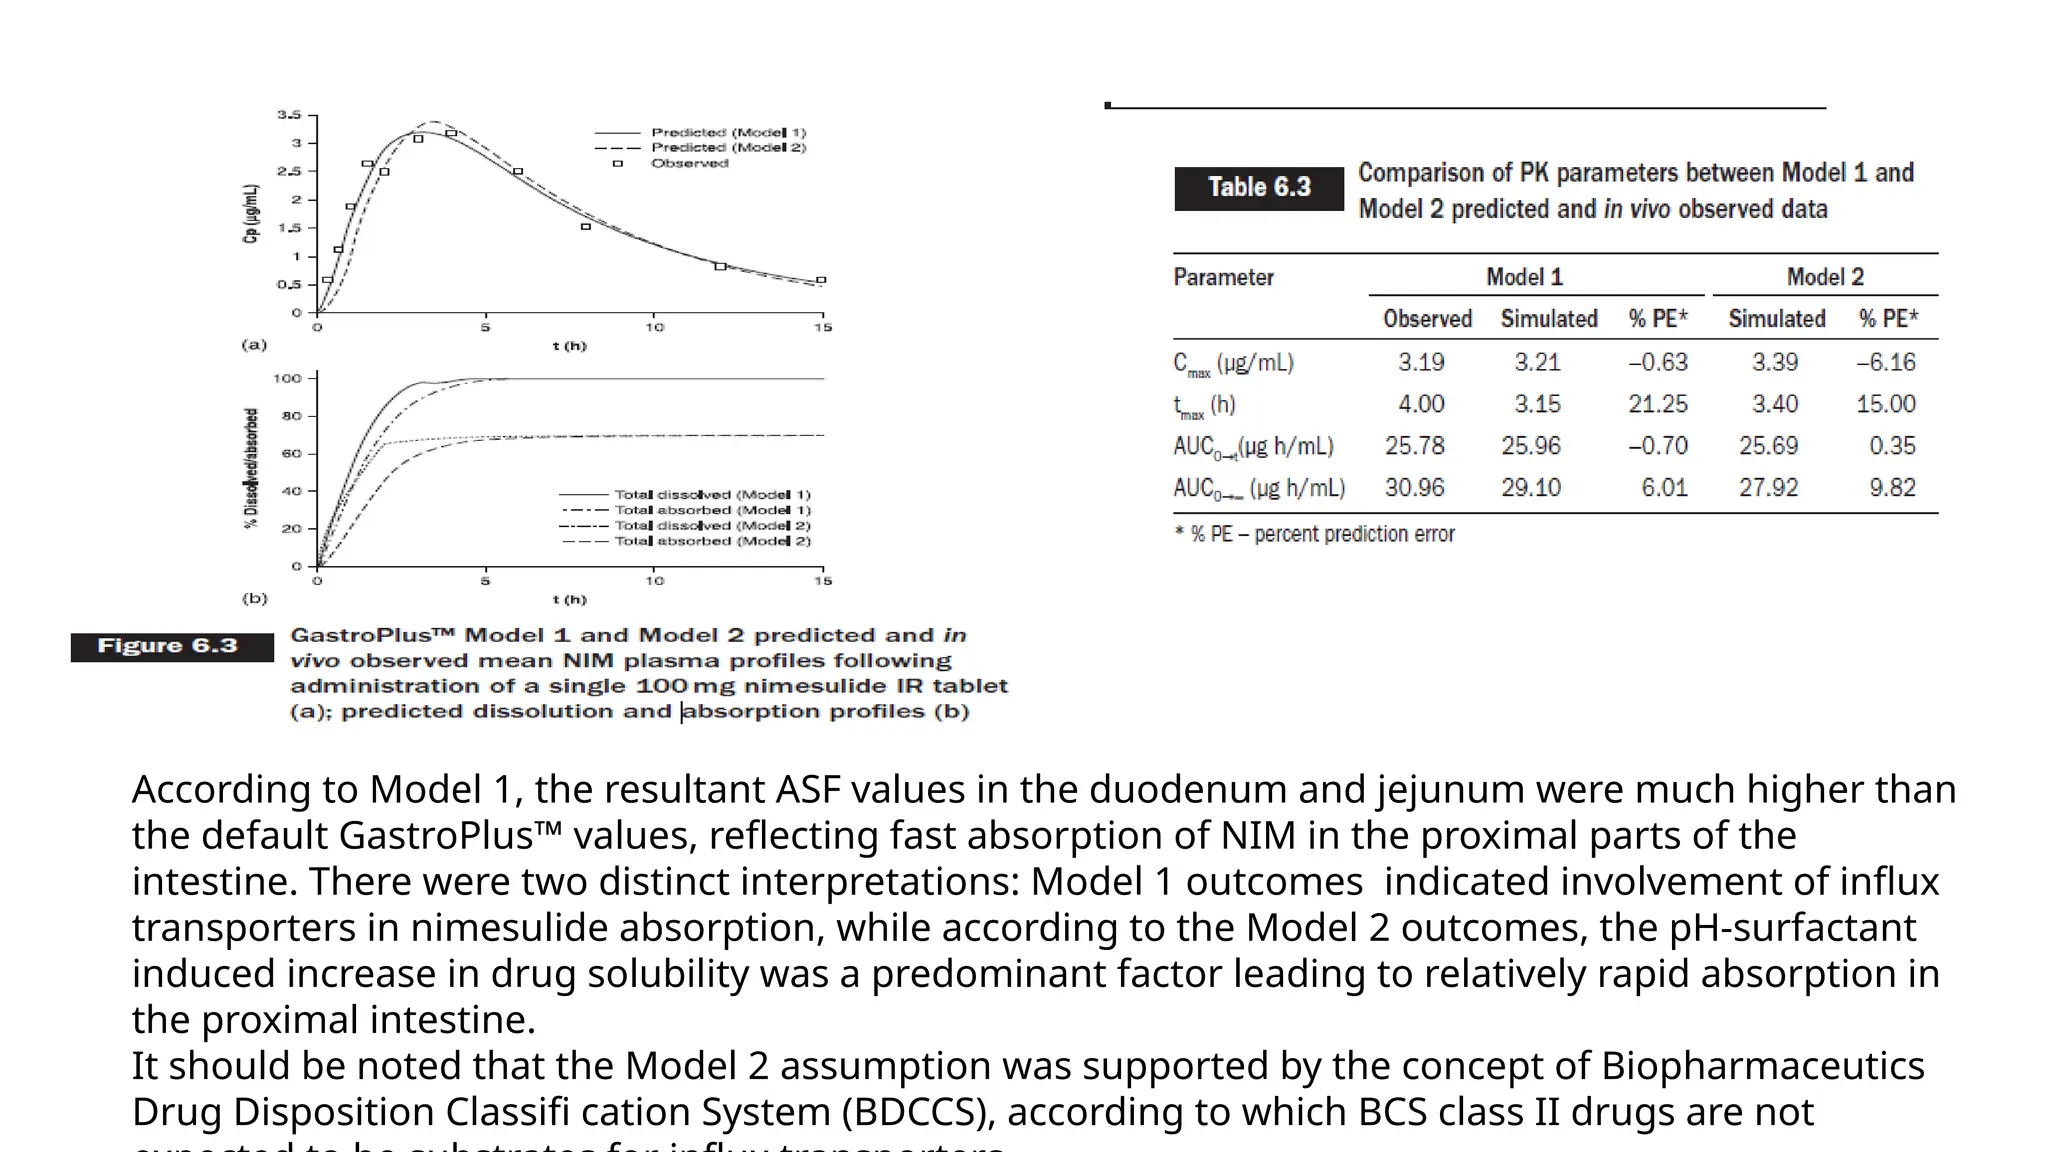
According to Model1, the resultant ASF values in the duodenum and jejunum were much higher than
the default GastroPlus™ values, reflecting fast absorption of NIM in the proximal parts of the
intestine. There were two distinct interpretations: Model 1 outcomes indicated involvement of influx
transporters in nimesulide absorption, while according to the Model 2 outcomes, the pH-surfactant
induced increase in drug solubility was a predominant factor leading to relatively rapid absorption in
the proximal intestine.
It should be noted that the Model 2 assumption was supported by the concept of Biopharmaceutics
Drug Disposition Classifi cation System (BDCCS), according to which BCS class II drugs are not
37.
•In addition, parametersfor which accurate data were not available (i.e. in vivo solubility and
human jejunal permeability) were optimized in Model 2.
•Also, Model 2 was developed using the set of in vivo data for two dosage forms (oral
suspension and IR tablet), and revealed incomplete drug absorption from the IR tablet (70% of
the administered dose, as compared to almost 100% drug absorbed estimated for the same set
of in vivo data when Model 1 was applied).
• This finding indicated that nimesulide dissolution from IR tablets is expected to be the limiting
factor for drug absorption.
38.
Sensitivity analysis
• Sensitivityanalysis is to indicate the sensitivity of simulation to uncertainties
in the input values of the model
• A sensitivity analysis determines how different values of an independent
variable affect a particular dependent variable under a given set of
assumptions. In other words, sensitivity analysis study how various sources
of uncertainty in a mathematical model contribute to the model’s overall
uncertainity.
• Sensitivity analysis allows for forecasting /predicting using historical,true
data
• By studying all the variables and possible outcomes,important decisions can
be made about dosage form design, route of administration etc
39.
Parameter sensitivity analysis(PSA)
• PSA is used to determine how much a parameter e.g. solubility will affect a PK property e.g.
absorbed
• The generated drug- specific absorption model can be used to further explore within the
model, such as understanding how the formulation parameters and/or drug physicochemical
properties affect the predicted PK profiles.
• This kind of evaluation is performed by the Parameter Sensitivity Analysis (PSA) feature in
GastroPlus™. When performing PSA, one parameter is changed gradually within a
predetermined range, which should be based on prior knowledge, while keeping all other
parameters at baseline levels.
• This can be helpful in devising methods such as excipients,salt formation,cosolvents or
permeability enhancers to overcome absorption or bioavailability limitations.
40.
Why is PSAnecessary
To determine the impact of a variable, sensitivity analysis can be useful for
a range of purposes including:
• Testing the robustness of results of model or system in presence of
uncertainty
• Increased understanding of relationship b/w input and output variables in
a system or model
• Uncertainty reduction: Through the identification of model inputs that
cause significant uncertainty in the output and should therefore be the
focus of attention
• Calibrating models for large number of parameters
• Searching for errors ( by encountering unexpected relationships b/w input
and output)
41.
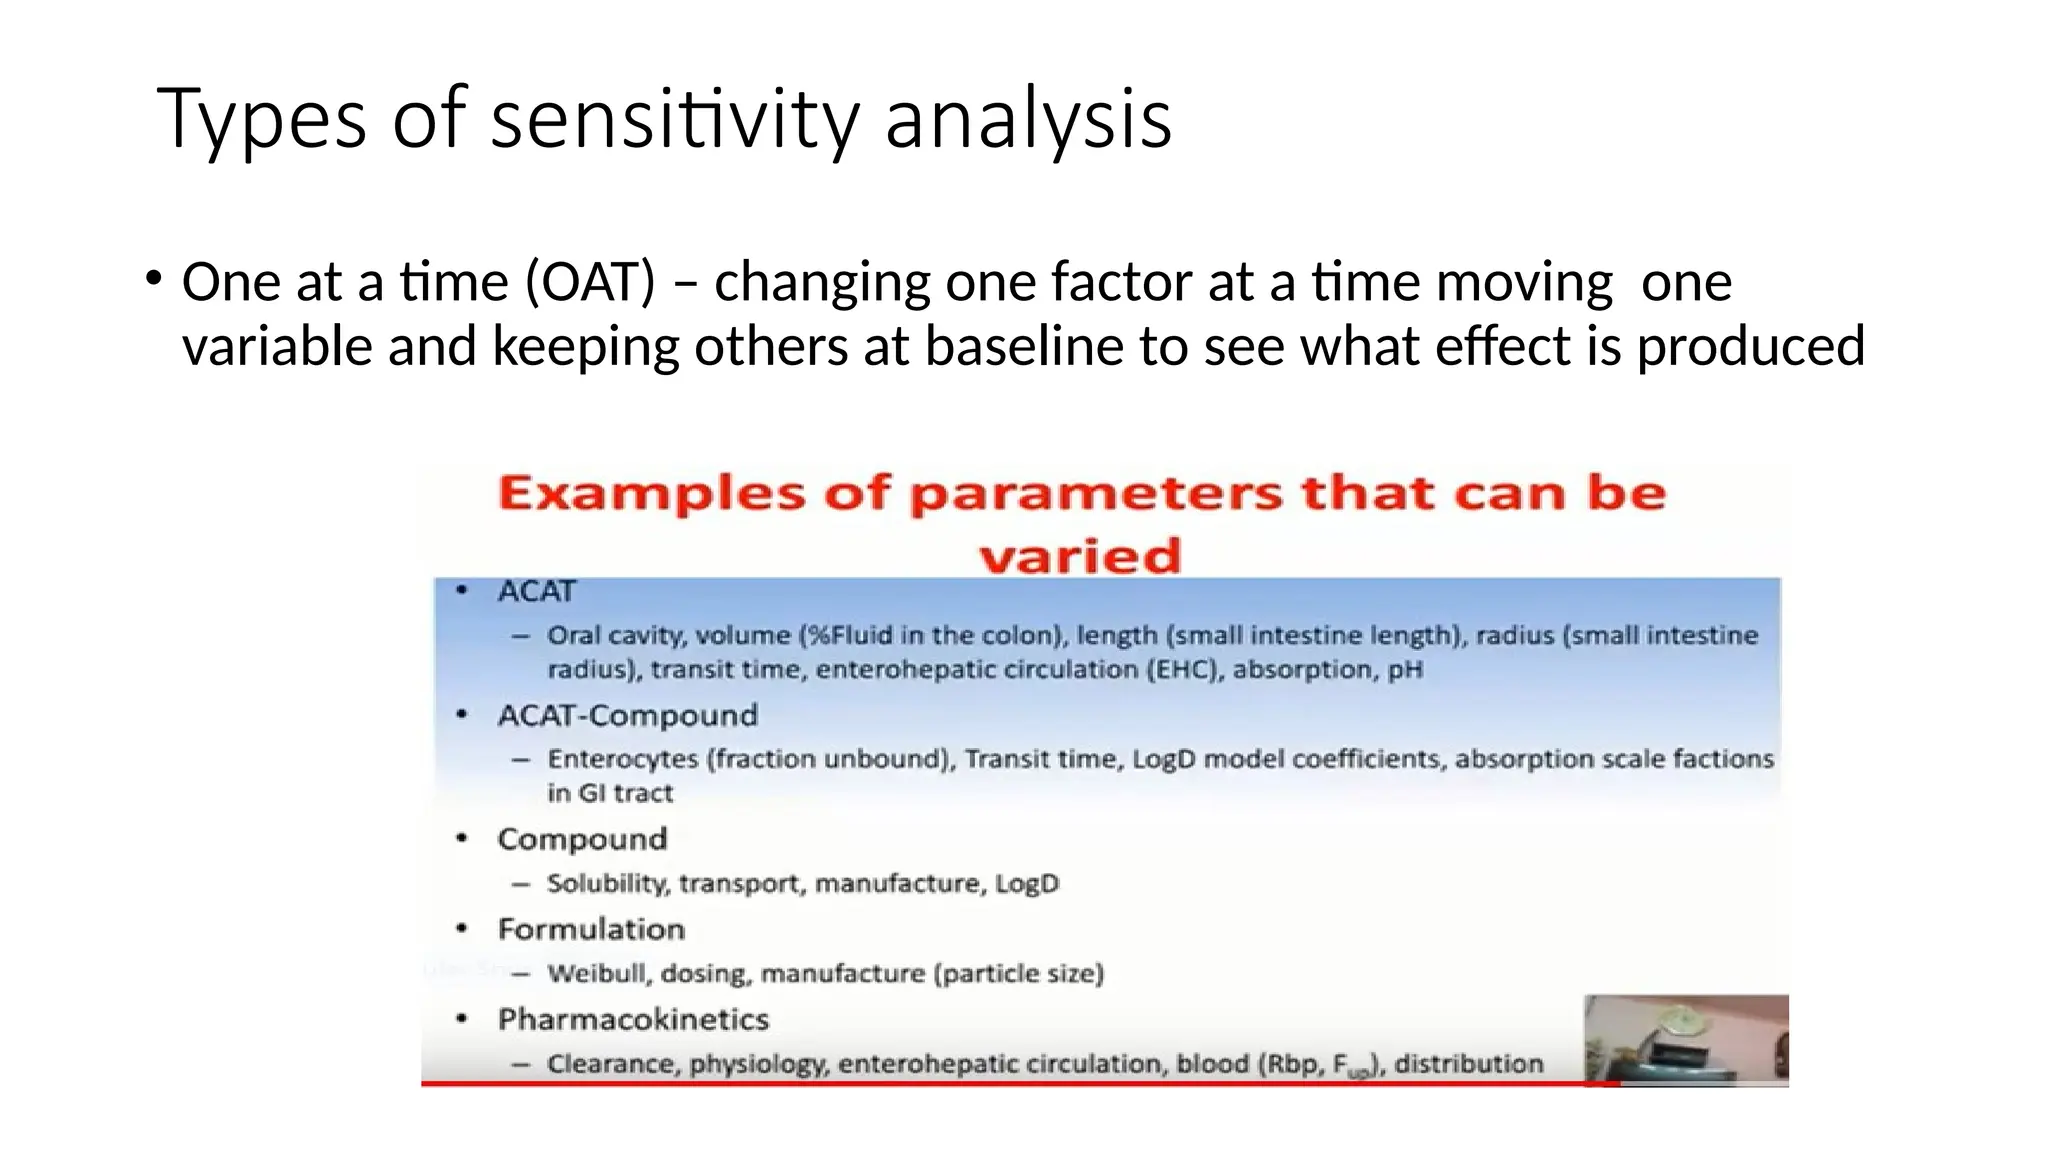
Types of sensitivityanalysis
• One at a time (OAT) – changing one factor at a time moving one
variable and keeping others at baseline to see what effect is produced
42.
Virtual Trial
• Inthe later stages of formulation development, it is especially valuable to anticipate inter-
subject variability that may influence oral drug bioavailability.
• In this way, the formulator might gain a better insight on what can be achieved by means of
the formulation.
• In order to in silico simulate the influence of population variability and/or the combined effect
of formulation variables that are not precise values, but for which distributions of values can
be estimated, the Virtual Trial feature in GastroPlus™ can be used.
• This feature allows the user to perform stochastic (random probability distribution)
simulations on a number of virtual subjects, wherein the values of the selected variables are
randomly sampled from predetermined distributions.
• The Virtual Trial mode can also be used to conduct virtual BE studies
43.
FED VS. FASTEDSTATE
• The presence of food may affect drug absorption via a variety of mechanisms; by impacting GI tract physiology
(e.g. food- induced changes in gastric emptying time, gastric pH, intestinal fluid composition, hepatic blood fl
ow), drug solubility and dissolution, and drug permeation
• For example, lipophilic drugs often show increased systemic exposure with food, and this phenomenon is
attributable to improved solubilization due to higher bile salt and lipid concentrations.
• Negative food effects are mostly seen for hydrophilic drugs, where food impedes permeation
• One of the frequently used approaches to assess the effect of food on oral drug absorption involves animal
studies.
• However, due to the fact that physiological factors are species dependent, the magnitude of food effect for a
given compound across species is usually different, thus complicating the prediction of food effects in humans.
• One alternative to animal experiments is to simulate food effects in humans using physiologically based
absorption models.
• Considering that these models are built based on a prior knowledge of GI physiology in the fasted and fed
states, they are able to describe the kinetics of drug transit, dissolution, and absorption on the basis of drug-
specifi c features such as permeability, biorelevant solubility, ionization constant(s), dose, metabolism and
distribution data, etc. Gastroplus™ default physiology parameters, which differ between fasted and fed states,
45.
IVIVC
• There aretwo approaches enabling the GastroPlus™ generated drug specific absorption model to be used
to assess the relationship between the in vitro and in vivo data:
• convolution to predict the plasma concentration profile,
• deconvolution to estimate the in vivo dissolution profile
• Once an IVIVC is developed, an in vitro dissolution test can be used to identify changes that may affect the
efficacy and safety of the drug product.
• In addition, biowaiver justification could be discussed in terms of whether dissolution from the dosage
form is expected to be the rate- limiting factor for drug in vivo absorption.
• In the convolution approach, a set of in vitro data representing different dissolution scenarios is used as
the input function in GastroPlus™ software to estimate the expected drug plasma concentration- time
profiles.
• In the next step, the obtained profiles are compared with the mean drug plasma concentration profile
observed in vivo , in order to establish an IVIVC
• In the deconvolution approach, the GastroPlus™ generated in vivo dissolution profile is plotted against the
in vitro obtained dissolution profiles, so that ‘bioperformance’ dissolution condition(s) can be identified
46.
Biowaver
• The roleof biowaivers in the drug approval process has been emphasized since the
introduction of BCS (Amidon et al., 1995) and the release of FDA guidance on waiver of in vivo
bioavailability and BE studies (US Food and Drug Adminstration, 2000).
• In this context, the term biowaiver refers to the situations in which in vivo BE studies can be
substituted with
the relevant in vitro data.
• The EMA and WHO issued guidelines widened the eligibility for biowaiver to some BCS class
III (eligible if very rapidly dissolving) (European Medicines Agency, 2010; WHO Expert
Committee on Specifications for Pharmaceutical Preparations, 2006) and BCS class II drugs
(eligible for biowaiver if the dose- to-solubility ratio at pH 6.8 is 250 mL or less and high
permeability is at 85% absorbed) (WHO Expert Committee on Specifi cations for
Pharmaceutical Preparations, 2006).
• The biowaiver concept concerning BCS II and III drugs should be further relaxed (e.g. BCS
class II drugs eligible for biowaiver under the assumption that the drug dissolves completely
during the GI passage (Yu et al., 2002), and BCS class III compounds eligible if rapidly
dissolving.

![Advanced Dissolution, Absorption, and Metabolism (ADAM)
Model)
• The ADAM model is quite similar to the basic CAT and ACAT model. It also represents the small
intestine as seven different compartments similar to other compartment models.
• Similar to the CAT model, the ADAM model accounts for the processes of dissolution, GI fluid
transit, gut wall permeation, drug degradation, intestinal metabolism, and active transport
processes.
• Considerations regarding variability in the GI tract such as the varied distribution of
enterocytic blood flow, enzymes in the gut wall, food-induced changes in gastric emptying,
splanchnicmblood flow, and luminal pH are also included and simulated in the ADAM model.
• The main difference between the ADAM and CAT model is that in the ADAM model, the
dissolution is calculated using the more sophisticated Wang–Flanagan generalized model
rather than the conventional Noyes–Whitney equation.
• Commercially available simulation software Simcyp® (http://www.simCYP.com) was developed
to integrate the ADAM model [35]. Formerly, it was introduced as a simulator for the
metabolism process, but later on, it was expanded for determining pharmacokinetic
properties of drugs including absorption.](https://image.slidesharecdn.com/caddppt-250303052943-9ca089bb/75/computer-aided-drug-development-presentation-24-2048.jpg)

![• Biopharmaceutical properties of several drugs and dosage forms have been characterized
using the same methodologies such as gastrointestinal simulation of “nimesulide oral
absorption” which was carried out by Grbic and co-workers in 2012 [43].
• In this study, two self-regulating analysts have constructed drug-specific models for
absorption utilizing identical data (in vivo); however, in both cases, different assumptions
regarding major factors affecting the absorption of nimesulide were considered.](https://image.slidesharecdn.com/caddppt-250303052943-9ca089bb/75/computer-aided-drug-development-presentation-30-2048.jpg)