This document is an updated guidebook from the California Department of Water Resources to help local water agencies prepare for drought. It discusses defining drought, relevant regulations for water shortage contingency planning, and establishing a water shortage response team. The guide provides a 7-step planning and implementation process and a checklist for water shortage contingency planning.
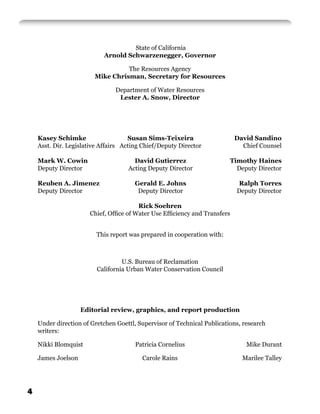

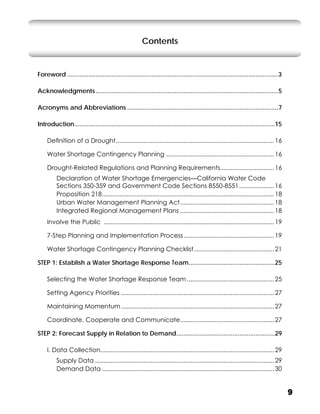
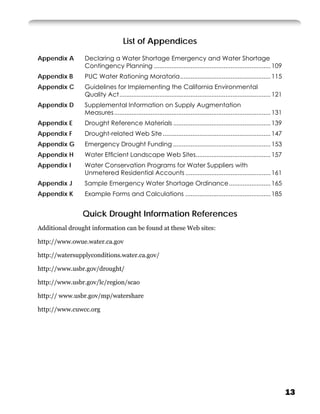

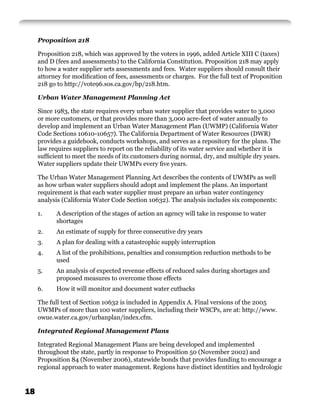
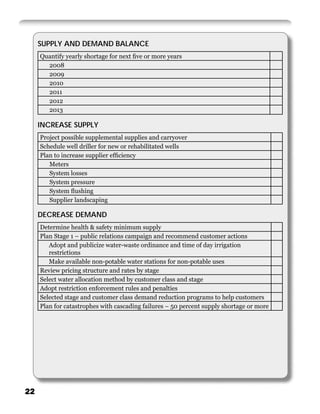

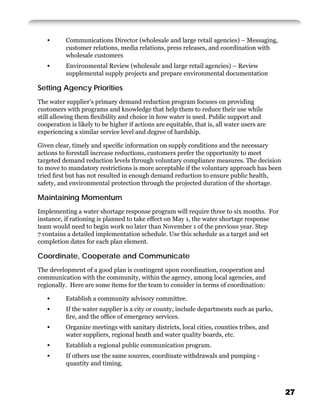
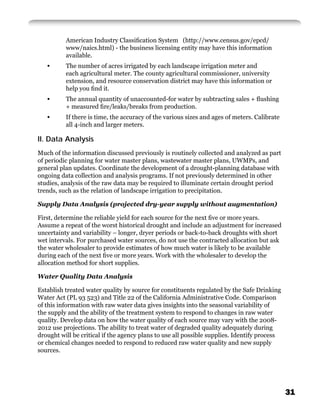
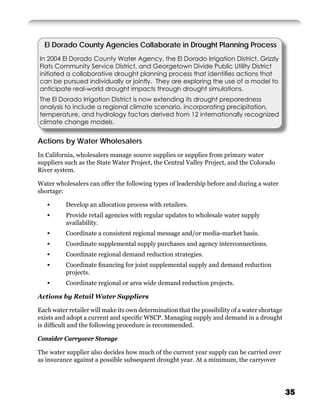

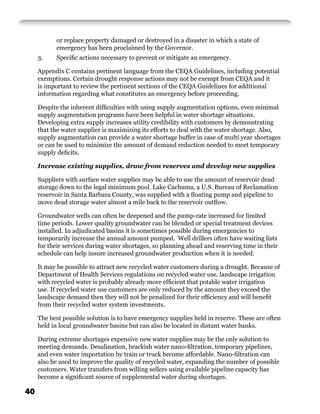
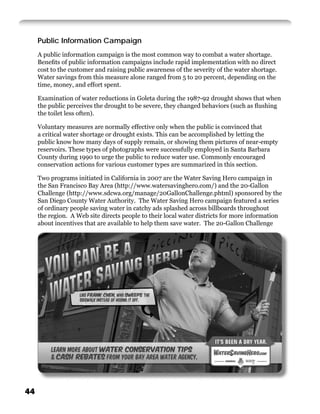
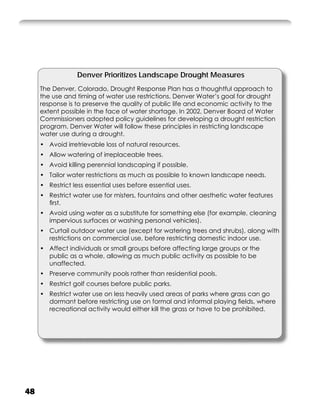
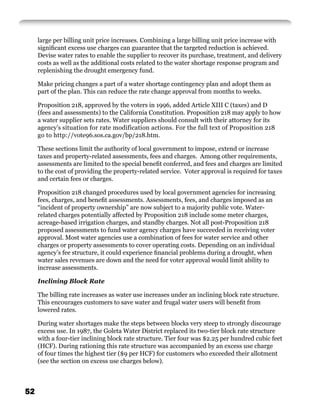
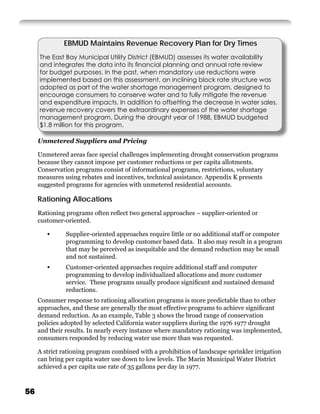
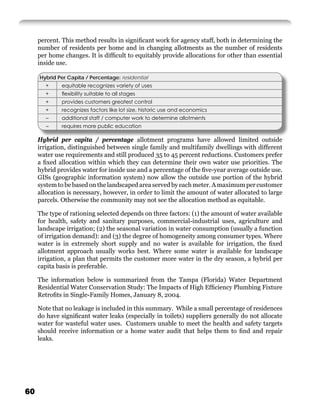
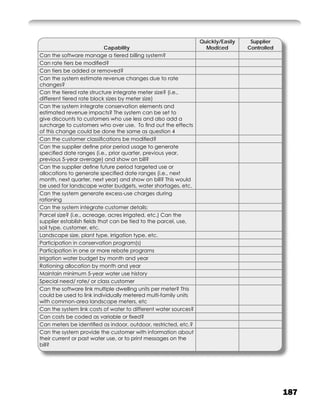
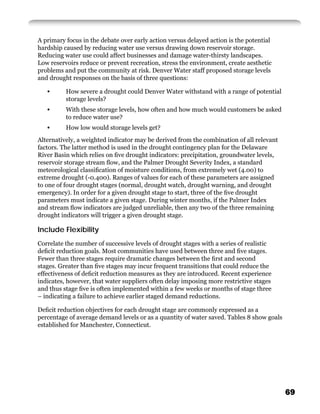
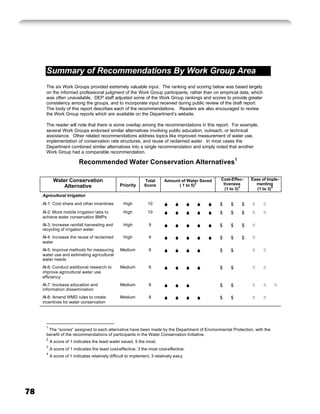
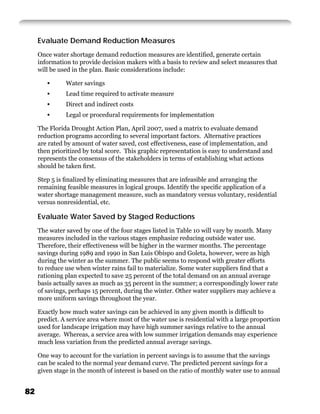
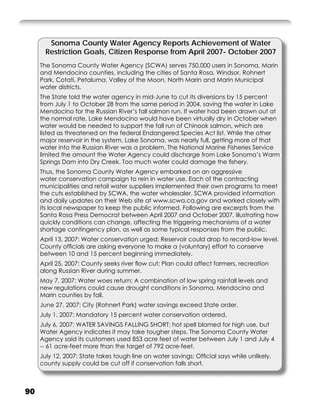
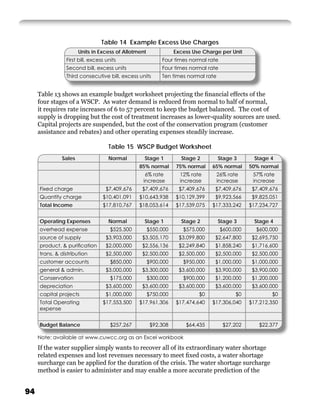
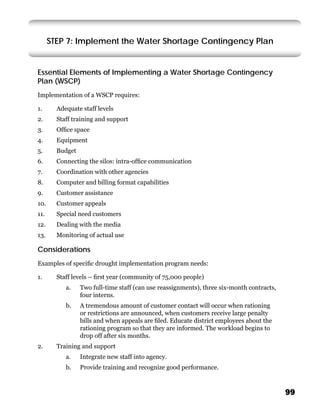
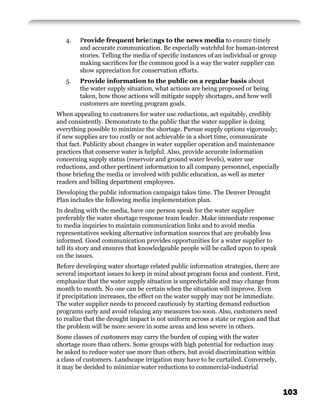
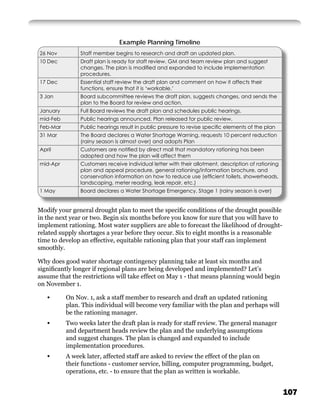
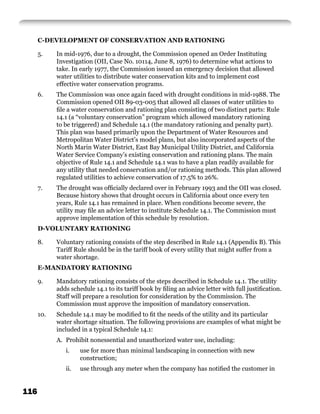
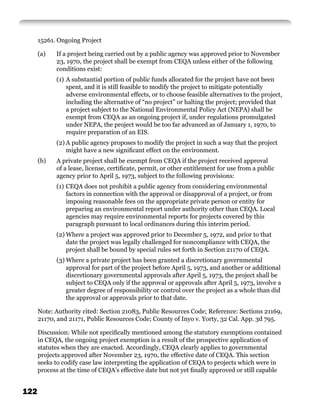
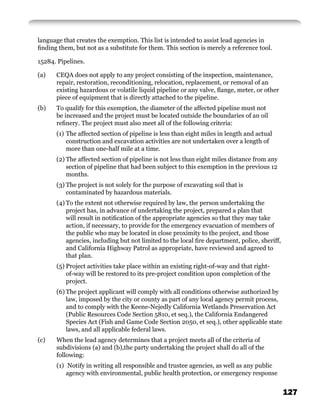
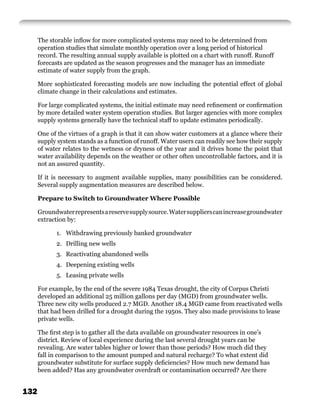
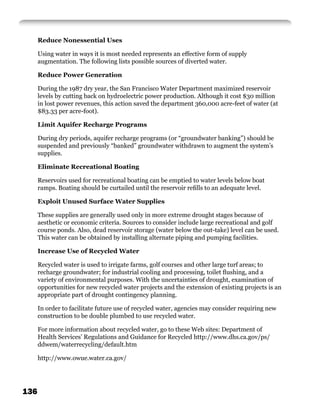
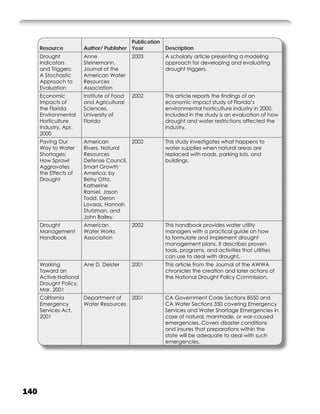
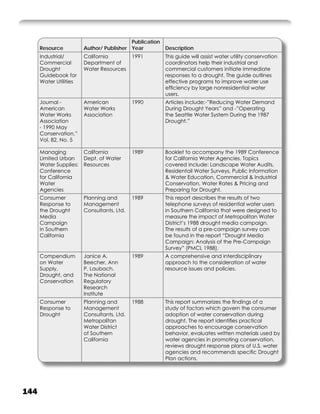
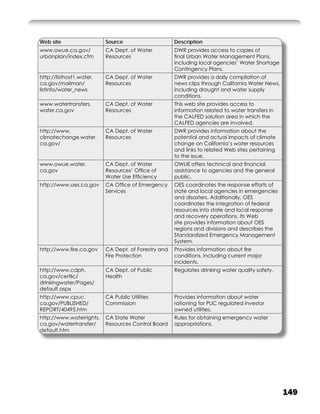
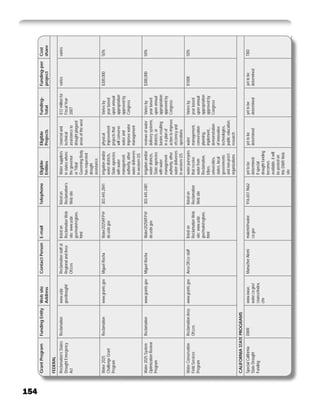
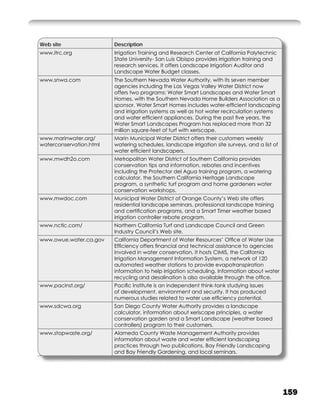
![Health & Safety Inside Residential Use (gallons per capita per day)
Non-conserving fixtures Conserving fixtures
Toilets 5 flushes x 3.6 gpf = 18.0 5 flushes x 1.6 gpf = 8.0
Shower / bath 12.7 shower/ 2.6 bath 15.3 9.2 shower & 2.6 bath 11.8
Clothes washer 1/3 load 14.7 1/3 load 7.8
Kitchen / bathroom Faucets & dishwasher 10.0 Faucets & dishwasher 6.7
Inside Total (gallons per capita per day) 58.0 34.3
Health & Safety Inside Residential Use with Habit Changes (gpcd)
Non-conserving fixtures Conserving fixtures
Toilets 4 flushes x 3.6 gpf = 14.4 4 flushes x 1.6 gpf = 6.4
Shower / bath 9.2 shower/ 2.4 bath 11.6 9.2 shower/ 2.4 bath 11.6
Clothes washer 1/4 load 11.0 1/4 load 6.0
Kitchen / bathroom Faucets & dishwasher 8.0 Faucets & dishwasher 6.0
Inside TOTAL (gallons per capita per day) 45.0 30.0
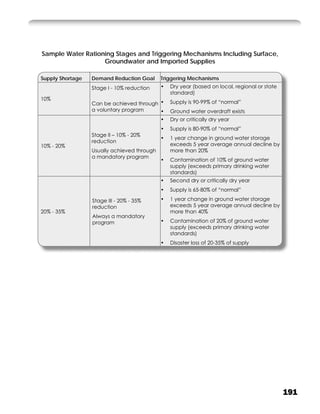
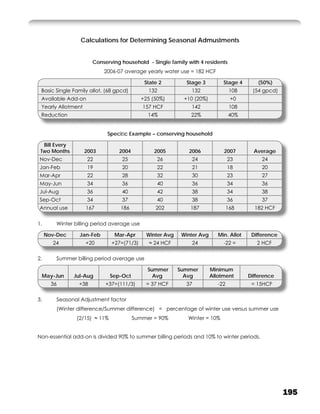
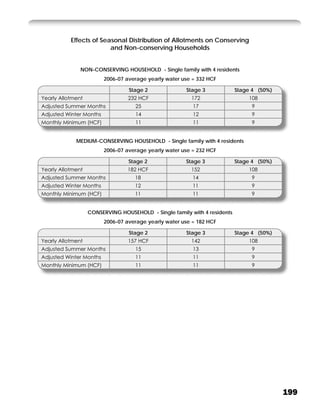
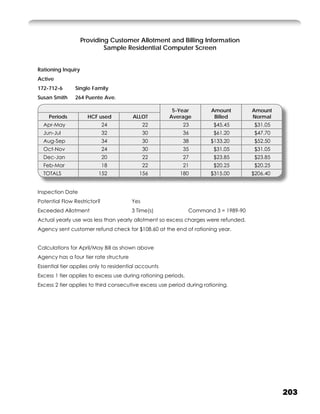
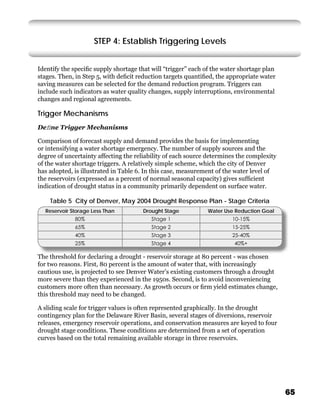
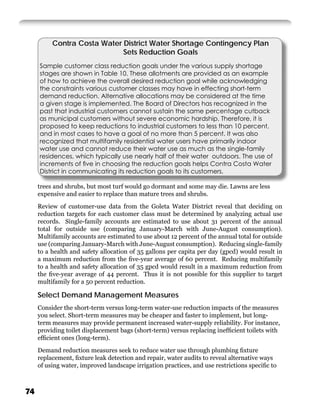
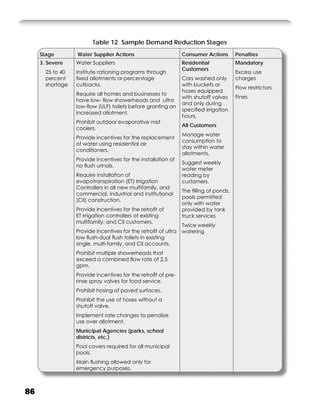
Goleta Combines Hybrid Per Capita and Percentage
Reduction Approaches
The Goleta Water District’s rationing plan established a hybrid per capita
and percentage reduction for residential accounts. Each residential account
received a health and safety allocation (11 HCF/month single family [68
gallons per capita per day (gpcd), four people], 7 HCF/month multi-residential
unit [58 gpcd, three people]) and a percentage of its average use. Reductions
ranged from 0 percent for the most conservative users (28 percent of
residential customers) to 45 percent for the largest users. If the water shortage
increases, the percentage add on can be reduced or eliminated.
Residential allocations were increased for additional residents at the service,
for health related problems and fruit trees, but only if the account had efficient
toilets and showerheads and drip irrigation. Commercial accounts were
reduced by a percentage from their five-year average. Agricultural accounts
were provided enough water to keep permanent crops (orchards) alive but
not enough to produce full yields.
This program was implemented in May 1989 with a goal of 15 percent
conservation and achieved a 30 percent reduction. When the drought
intensified during the winter of 1990, even with allocations staying the same,
residential accounts reduced use by 50 percent with a district reduction of 36
percent below the 1984-88 average.
61](https://image.slidesharecdn.com/urban-drought-guidebook-final-2008-121104173927-phpapp01/85/California-Urban-Drought-Guidebook-61-320.jpg)
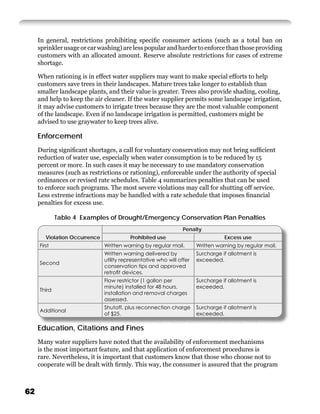

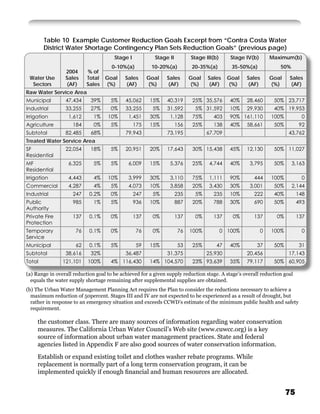
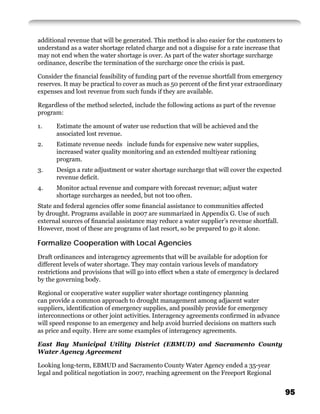

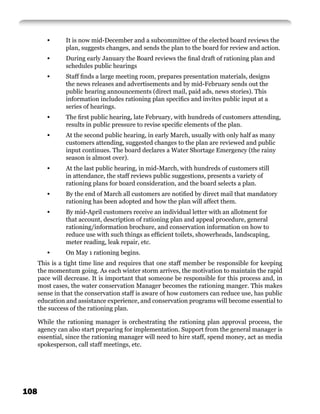

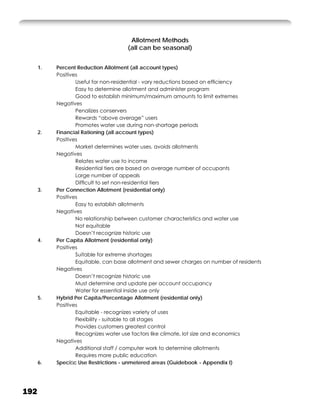
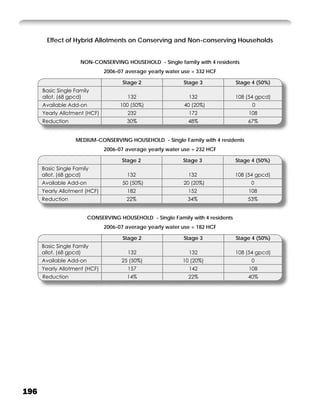
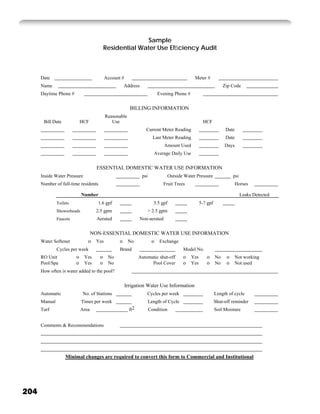
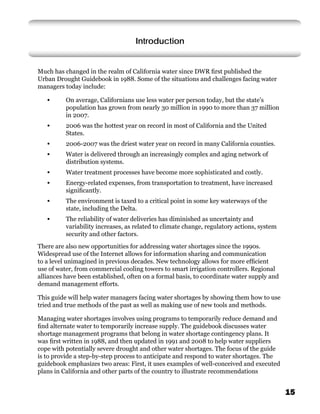
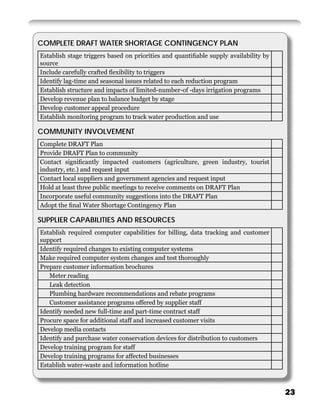
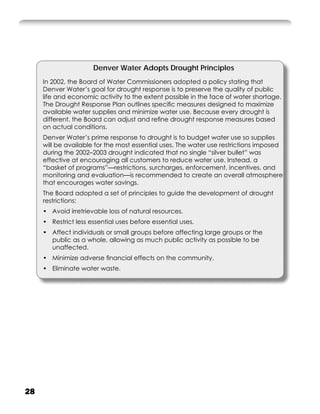
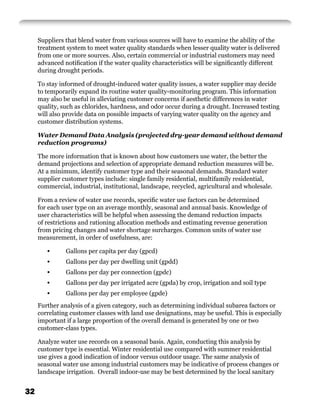
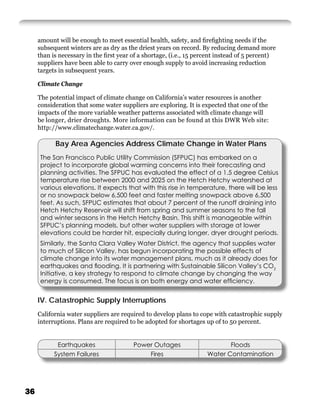
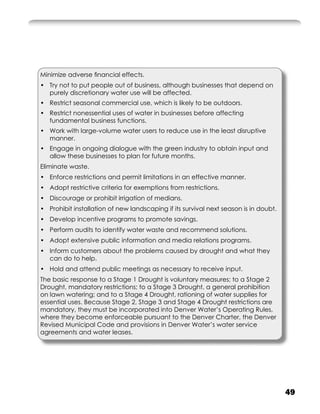
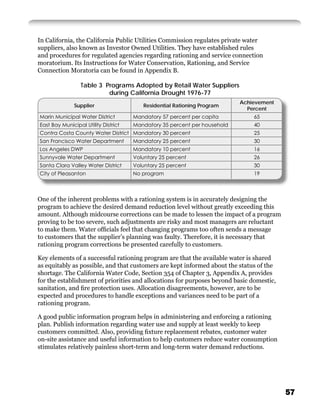
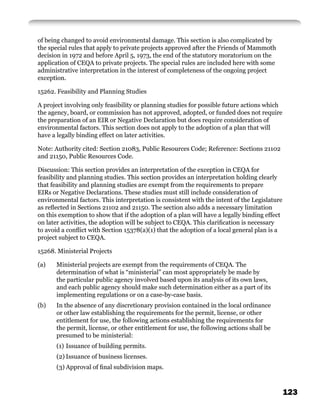
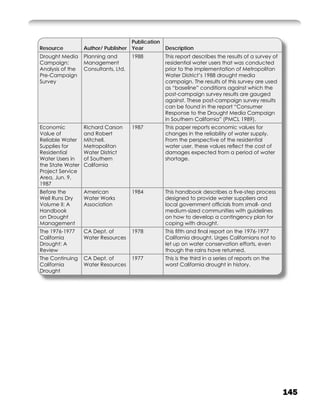
![G-Exemptions
14. Some decisions to impose a moratorium contain exceptions. For example in
Citizen’s Utilities (CUCC) Montara District:
“The moratorium shall not apply to owners of real property who are customers
of CUCC on or before the date of this order, or their successors in interest, if
any change in the use of their property will not increase their demand upon the
system.” (D.86-05-078, Ordering Paragraph 3.)
15. D.86-05-078 also provided that prospective customers could seek an exemption
from the moratorium by filing an application with the Commission showing that
extraordinary circumstances required an exemption.
16. In D.00-06-020, June 8, 2000 the Commission granted an application and
authorized Citizens Utilities to install a water service connection to applicant’s
property at APN 037-278-090 following cessation of service at applicant’s
property at 888 Ocean Boulevard in Montara. Costs were to be borne by
applicant. The order made it clear that water service could not be reinstated
at 888 Ocean Boulevard absent a lifting or easing of the moratorium. Such
determinations were also delegated to staff2.
The Commission’s Role in Water Planning
The two state agencies primarily responsible for overseeing water planning are the
California Department of Water Resources, which manages the State Water Project and
produces the California Water Plan, and the State Water Quality Control Board and
Regional Water Quality Control Boards that have authority over water allocation and
water quality protection.
In addition to the state agencies that have broad planning and management powers,
local government also has a part in water use decisions. For example, county boards
of supervisors, county water agencies, land use planning agencies, city governments,
municipal water districts and many special districts all have a role in the use of water in
California.
In this context, the Commission has recognized the futility of one party taking unilateral
action to protect a groundwater basin:
Rehabilitation of the Santa Maria Groundwater Basin is not the responsibility of, and
is beyond the physical and financial resources of any single individual, company, or
agency. Even if [Southern California Water Company] were to stop drawing from the
basin entirely and injected into the basin the entire 7,900 AFY it desires to obtain from
the [Central Coast Water Authority], the basin’s fundamental problems of declining
quantity and water quality would not be solved. Most simply put, the basin’s salvation as
a water resource requires the immediate, undivided, sincere and selfless attention of all
its users.
119](https://image.slidesharecdn.com/urban-drought-guidebook-final-2008-121104173927-phpapp01/85/California-Urban-Drought-Guidebook-119-320.jpg)
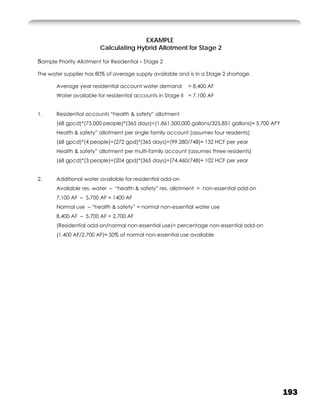
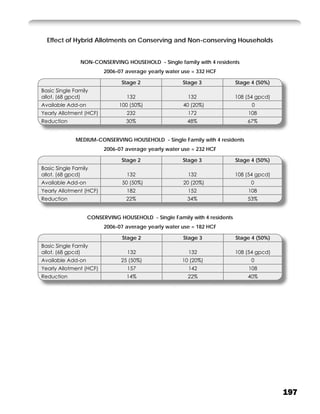
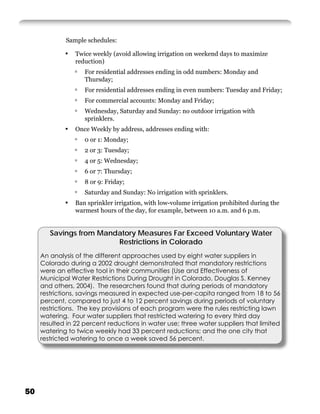
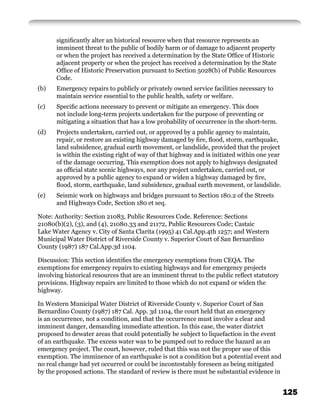
![APPENDIX C
Guidelines for Implementing the California
Environmental Quality Act
Excerpts from:
http://ceres.ca.gov/topic/env_law/ceqa/guidelines/art18.html Page 1 of 15
Title 14. California Code of Regulations
Chapter 3. Guidelines for Implementation of the California Environmental Quality Act
Article 18. Statutory Exemptions
Sections 15260 to 15285
15260. General
This article describes the exemptions from CEQA granted by the Legislature. The
exemptions take several forms. Some exemptions are complete exemptions from CEQA.
Other exemptions apply to only part of the requirements of CEQA, and still other
exemptions apply only to the timing of CEQA compliance.
Note: Authority cited: Section 21083, Public Resources Code; Reference: Section
21080(b), Public Resources Code.
Discussion: This section serves as an introduction to this article on statutory
exemptions. The section notes that the exemptions take basically three forms, being
either complete exemptions, partial exemptions, or special timing requirements. The
court in Western Municipal Water District of Riverside County v. Superior Court of
San Bernardino County (1986) 187 Cal. App. 3d 1104, pointed out that “the self-evident
purpose of a [statutory] exemption is to provide an escape from the EIR requirement
despite a project’s clear, significant impact.” This is in contrast to categorical exemptions
which are disallowed if the project would otherwise have an environmental impact.
By way of example, the Supreme Court held in Napa Valley Wine Train, Inc. v. Public
Utilities
Commission (1990) 50 Cal 3d 370, that CEQA is a legislative act subject to legislative
limitations and legislative amendment. Through that premise, the court held that
statutory exemptions were enacted to avoid the environmental review process for an
entire class of projects. In the specific case, an excursion train proposed for operation
within an existing railroad right-of-way fell within the exemption language in Public
Resources Code Section 21080(b)(11), even though the use might have potential
environmental consequences. Subsequent legislation enacted Public Resources Code
Section 21080.04 making the wine train project subject to CEQA.
121](https://image.slidesharecdn.com/urban-drought-guidebook-final-2008-121104173927-phpapp01/85/California-Urban-Drought-Guidebook-121-320.jpg)
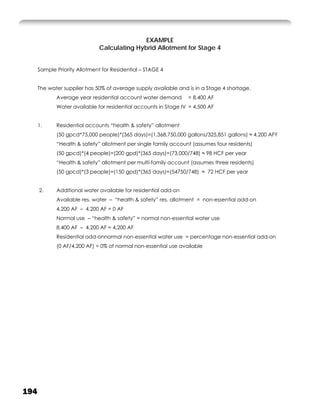
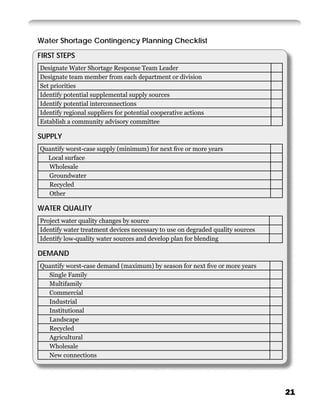
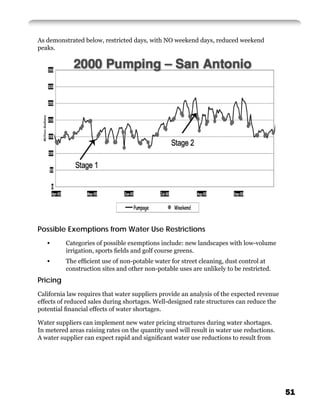
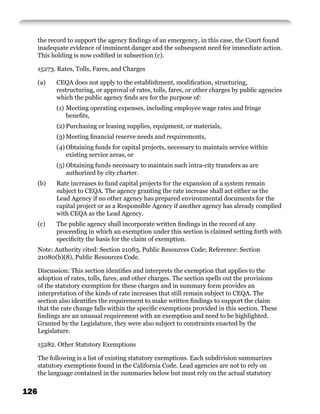
![(4) Approval of individual utility service connections and disconnections.
(c) Each public agency should, in its implementing regulations or ordinances,
provide an identification or itemization of its projects and actions which are
deemed ministerial under the applicable laws and ordinances.
(d) Where a project involves an approval that contains elements of both a ministerial
action and a discretionary action, the project will be deemed to be discretionary
and will be subject to the requirements of CEQA.
Note: Authority cited: Section 21083, Public Resources Code; Reference: Section
21080(b)(1), Public Resources Code; Day v. City of Glendale, 51 Cal. App. 3d 817.
Discussion: This section provides an interpretation of the exemption for ministerial
projects. The term “ministerial” is defined in Section 15369. This section provides
additional explanation. The key point is that the determination of whether a particular
project is ministerial must be based on an examination of the law or ordinance
authorizing the particular permit. The problem is that ordinances vary. Ordinances in
adjacent counties requiring permits for the same kind of activity may provide different
kinds of controls over the activity. In one county, the ordinance may be ministerial, and
in the other the permit may be discretionary and therefore subject to CEQA. The section
identifies four types of permits or licenses which are normally ministerial in most
jurisdictions. The section creates a presumption that these activities are ministerial
unless evidence is presented showing that there are discretionary provisions in the
relevant local ordinance. The section encourages public agencies to identify their
ministerial permits in their implementing procedures. This approach will simplify the
administration of the process in the individual agency. This section also codifies the
ruling in Day v. City of Glendale cited in the note and other court decisions which have
held that where a project approval involves elements of both ministerial action and
discretionary action, the project will be deemed to be discretionary and therefore subject
to CEQA. The court in Friends of Westwood, Inc. v. Los Angeles (1986) 191 Cal. App. 3d
259, provided guidance, and held that the legislative history of CEQA indicates that the
term ‘Ministerial’ is limited to those approvals which can be legally compelled without
substantial modification or change. “It is enough that the [agency] possesses discretion
to require changes which would mitigate in whole or part one or more of the [significant
or potentially significant] environmental consequences an EIR might conceivably
uncover.”
15269. Emergency Projects
The following emergency projects are exempt from the requirements of CEQA.
(a) Projects to maintain, repair, restore, demolish, or replace property or facilities
damaged or destroyed as a result of a disaster in a disaster stricken area in
which a state of emergency has been proclaimed by the Governor pursuant
to the California Emergency Services Act, commencing with Section 8550 of
the Government Code. This includes projects that will remove, destroy, or
124](https://image.slidesharecdn.com/urban-drought-guidebook-final-2008-121104173927-phpapp01/85/California-Urban-Drought-Guidebook-124-320.jpg)


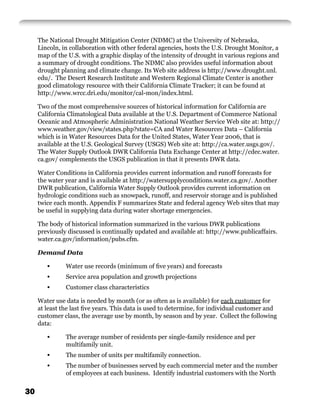
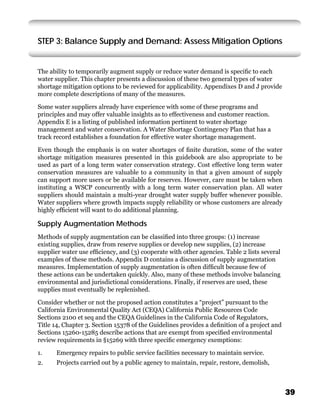
![APPENDIX J
Sample Emergency Water Shortage Ordinance
ORDINANCE NO. XXX
AN ORDINANCE ENACTED AS AN EMERGENCY MEASURE ESTABLISHING RULES
AND REGULATIONS FOR RATIONING WATER DURING A WATER SHORTAGE
EMERGENCY AND ESTABLISHING PENALTIES FOR VIOLATIONS THEREOF
THE CITY COUNCIL OF THE CITY OF HAYWARD DOES ORDAIN AS FOLLOWS:
SECTION 1. FINDINGS AND DETERMINATIONS
(a) A water shortage emergency condition prevails within the area served by the
Hayward Water System.
(b) The San Francisco Water Department, at the direction of the San Francisco
Public Utilities Commission, has requested that all resale customers, including
the Hayward Water System, immediately institute a water conservation program
designed to effect a [TBD] percent reduction in water usage.
(c) The rules, regulations and restrictions set forth in this ordinance are intended to
conserve the water supply of the Hayward Water System for the greatest public
benefit with particular regard to domestic use, sanitation and fire protection.
(d) The specific uses prohibited or restricted by this ordinance are nonessential, if
allowed, would constitute wastage of Hayward Water System water, and should
be prohibited pursuant to the City of Hayward’s general authority under its
charter as well as the authority granted by State Water Code Section 350 et seq.
and the common law.
(e) The actions taken hereinafter are exempt from the provisions of Sections 21000
et seq. of the Public Resources Code as a project undertaken as immediate action
necessary to prevent or mitigate an emergency pursuant to Title 14, California
Code of Regulations Section 15269 (State CEQA Guidelines).
(f) The following measures are therefore found to be necessary as an emergency
measure for preserving the public peace, health or safety.
SECTION 2. DEFINITIONS
(a) The “Hayward Water System” is the Hayward Municipal Water System operated
under Divisions of the City of Hayward Public Works Department.
(b) “Director” is Director of Public Works of the City of Hayward.
(c) “Person” means any person, firm, partnership association, corporation, company,
organization or governmental entity.
165](https://image.slidesharecdn.com/urban-drought-guidebook-final-2008-121104173927-phpapp01/85/California-Urban-Drought-Guidebook-165-320.jpg)
![(d) “Customer” means any person, whether within or without the geographic
boundaries of the City of Hayward, who uses water supplied by the Hayward
Water System.
(e) “Process Water” means water used to manufacture, alter, convert, clean, heat or
cool a product, including water used in laundries and recycled car wash facilities.
(f) “Unit of Water” is 100 cubic feet of water.
(g) “Water” is water from the Hayward Water System.
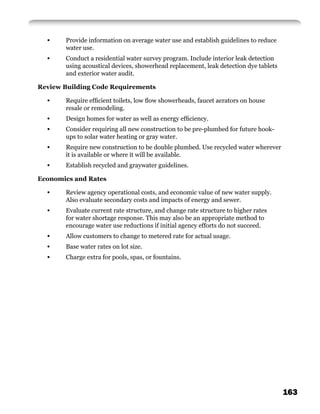
SECTION 3. PROHIBITION OF NONESSENTIAL WATER USE
It shall be unlawful for any person to use water obtained from the Hayward Water
System for nonessential uses as hereinafter defined.
SECTION 4. NONESSENTIAL USES DEFINED
The following uses of water are hereby determined to be nonessential, except as further
provided herein:
(a) Use of water in excess of those certain allotments set forth in Schedule A entitled
“Allotment System For Water Use During Water Shortage Emergency” attached
hereto and hereby made a part hereof. Allotments as established herein shall be
based on [Year TBD] use with adjustments for unusual conditions. New services
or services without [Year TBD] history shall be allotted on comparable customer
usage. The City Council is hereby authorized from time to time to establish by
resolution allotments different from the allotments set forth in said Schedule A
due to changes in circumstances.
(b) Use of water through any meter when the customer has been given 10 days
written notice to repair broken or defective plumbing, sprinkler, watering or
irrigation systems and has failed to effect such repairs.
(c) Use of water that results in flooding or runoff in gutters or streets.
(d) Use of water through a hand-held hose for washing cars, buses, boats, trailers or
other vehicles, unless the hose is equipped with a positive shutoff nozzle.
(e) Use of water through a hand-held hose for washing buildings, structures,
sidewalks, walkways, driveways, patios, parking lots, tennis courts, or other hard-
surfaced areas.
(f) Use of water for filling any existing or new swimming pool or hot tub.
(g) Use of water to clean, fill or maintain levels in decorative fountains.
(h) Use of water for construction purposes such as consolidation of backfill unless no
other source of water or other method can be used.
(i) Service of water by restaurants except upon the request of a customer.
166](https://image.slidesharecdn.com/urban-drought-guidebook-final-2008-121104173927-phpapp01/85/California-Urban-Drought-Guidebook-166-320.jpg)
![(c) Discontinuance of Water Service: Continued water consumption in violation
of the provisions of this ordinance may result in the discontinuance of water
service by the Hayward Water System. A charge shall be paid prior to reactivating
a service that has been discontinued as provided herein. The charge shall be
specified from time to time by resolution of the City Council.
SECTION 8. EFFECTIVE DATE
The findings and determinations set forth in Section 1. hereof constitute the statement
of reasons for adopting this ordinance as an emergency measure in the manner provided
by Section 617 of the Charger. This ordinance shall be effective immediately.
SECTION 9. OPERATIVE DATE
The requirements of this ordinance shall be operative as of [Date TBD].
INTRODUCED at a regular meeting of the City Council of the City of Hayward, held the
[Date TBD], by Councilmember
168](https://image.slidesharecdn.com/urban-drought-guidebook-final-2008-121104173927-phpapp01/85/California-Urban-Drought-Guidebook-168-320.jpg)
![Sample Escalated Water Rationing Ordinance
ORDINANCE NO. XXX
AN ORDINANCE ENACTED TO ESTABLISH RULES AND REGULATIONS FOR
INCREASED WATER RATIONING DURING A WATER SHORTAGE EMERGENCY
AND ESTABLISHING PENALTIES FOR VIOLATIONS THEREOF
THE CITY COUNCIL OF THE CITY OF HAYWARD DOES ORDAIN AS FOLLOWS:
SECTION 1. FINDINGS AND DETERMINATIONS
(a) A water shortage emergency condition prevails within the area served by the
Hayward Water System.
(b) On [Date TBD), the San Francisco Water Department, at the direction of the
San Francisco Public Utilities Commission, requested that all resale customers,
including the Hayward Water System, immediately institute a water conservation
program designed to effect a [TBD] percent reduction in water usage.
(c) Such action was taken by the City of Hayward’s adoption of Ordinance No. [TBD]
(d) On [Date TBD], the San Francisco Water Department, at the direction of the San
Francisco Public Utilities Commission, recommended that all resale customers,
including the Hayward Water System adopt additional water use restrictions to
enhance their water conservation programs.
(e) The rules, regulations and restrictions set forth in this ordinance are intended to
conserve the water supply of the Hayward Water System for the greatest public
benefit with particular regard to domestic use, sanitation, and fire protection.
(f) The specific uses prohibited or restricted by this ordinance are nonessential, if
allowed, would constitute wastage of Hayward Water System water, and should
be prohibited pursuant to the City of Hayward’s general authority under its
Charter as well as the authority granted by State Water Code sections 350 et seq.
and the common law.
(g) The actions taken hereinafter are exempt from the provisions of sections 21000
et seq. of the Public Resources Code as a project undertaken as immediate action
necessary to prevent or mitigate an emergency pursuant to Title 14, California
Administrative Code section 15071 (State of California Environmental Impact
Report Guidelines).
(h) The following measures are therefore found to be necessary as an emergency
measure for preserving the public peace, health, and safety.
SECTION 1.5 AMENDED PROGRAM
This ordinance supersedes Ordinance No. [TBD]
169](https://image.slidesharecdn.com/urban-drought-guidebook-final-2008-121104173927-phpapp01/85/California-Urban-Drought-Guidebook-169-320.jpg)
![SECTION 2. DEFINITIONS
(a) The “Hayward Water System” as operated under divisions of the City of Hayward
Public Works Department.
(b) “Director” is Director of Public Works of the City of Hayward.
(c) “Person” means any person, firm, partnership, association, corporation,
company, organization, or governmental entity.
(d) “Customer” means any person, whether within or without the geographic
boundaries of the City of Hayward, who uses water supplied by the Hayward
Water System.
(e) “Process Water” means water used to manufacture, alter, convert, clean, heat, or
cool a product, including water used in laundries and recycled car wash facilities.
(f) “Unit of water” is 100 cubic feet of water.
(g) “Water” is water from the Hayward Water System.
SECTION 3. PROHIBITION OF NONESSENTIAL WATER USE
It shall be unlawful for any person to use water obtained from the Hayward Water
System for nonessential uses as hereinafter defined.
SECTION 4. NONESSENTIAL USES DEFINED
The following uses of water are hereby determined to be nonessential, except as further
provided herein:
(a) Use of water in excess of those certain allotments set forth in Schedule A entitled
“Allotment System For Water Use During Water Shortage Emergency” attached
hereto and hereby made a part hereof. Allotments as established herein shall be
based on [Year TBD] use with adjustments for unusual conditions. New services
or services without [Year TBD] history shall be allotted on comparable customer
usage. The City Council is hereby authorized from time to time to establish by
resolution allotments different from the allotments set forth in said Schedule A
due to changes in circumstances.
(b) Use of water through any meter when the person billed for the water service
has been given 10 days written notice to repair broken or defective plumbing,
sprinkler, watering, or irrigation systems and has failed to affect such repairs.
(c) Use of water that results in flooding or runoff in gutter or streets.
(d) Use of water through a hand-held hose for washing buildings, structures, mobile
homes, sidewalks, walkways, driveways, patios, parking lots, tennis courts, or
other hard-surfaced areas.
(e) Use of water for filling or refilling after draining of any existing or new swimming
pool, spa, or hot tub; topping off will be allowed to the extent the designated
170](https://image.slidesharecdn.com/urban-drought-guidebook-final-2008-121104173927-phpapp01/85/California-Urban-Drought-Guidebook-170-320.jpg)
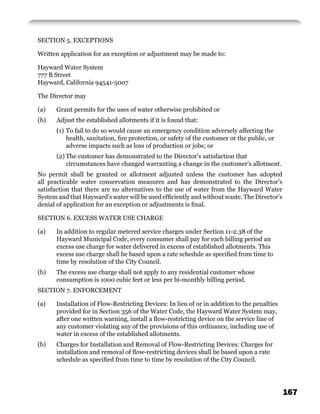
![allotment. No permit shall be granted or allotment adjusted unless the
person billed for the service has adopted all practicable water conservation
measures and has demonstrated to the Director’s satisfaction that there are
no alternatives to the use of water from the Hayward Water System and that
Hayward’s water will be used efficiently and without waste.
(c) Upon the filing of a written request for an exception, the owner of a multiple
residential development or a single-family household shall include a certification
that the following water conservation efforts, at a minimum, have been
implemented in every toilet and shower in the multiple residential development
or single-family household:
(1) All toilet tanks have been tested for leaks with leak detection dye tablets;
(2) A two-quart plastic bag filled with water has been installed in all toilet tanks;
and
(3) An approved flow restrictor has been installed in every shower head.
In multiple residential unit developments served by a master meter where the
owner does not own the units within the development, the owner shall provide
certification under penalty of perjury that a kit containing the equipment for the
above described water conservation efforts was delivered to every unit and each
unit owner or occupant was urged to install the kits.
(d) The Director’s denial of an application for an exception or adjustments is final.
(e) The following service charges or other charges approved from time to time by
City Council resolution shall be applied to allotment changes:
(1) Temporary residents – a fee of [Fee TBD] for changing existing allotments;
(2) Adjustments to prior billings – a minimum fee of [Fee TBD] to adjust prior
billings.
SECTION 6. EXCESS WATER USE CHARGE
(a) In addition to regular metered service charges under Section 11-2.38 of the
Hayward Municipal Code, every person billed for water service shall pay for each
billing period an excess use charge for water delivered in excess of established
allotments. This excess use charge shall be based upon a rate schedule as
specified from time to time by resolution of the City Council.
(b) The excess use charge shall not apply to any residential customer whose
consumption is 1000 cubic feet or less per bi-monthly billing period.
(c) In addition to the exception set forth in subsection
(d) and notwithstanding any other provision of law, the Director of Public Works
is authorized to adopt rules and regulations providing for waiver of excess use
or other charges where their imposition would give rise to a civil right of action
against the City by the person billed or would constitute a manifest and gross
miscarriage of fairness and equity.
172](https://image.slidesharecdn.com/urban-drought-guidebook-final-2008-121104173927-phpapp01/85/California-Urban-Drought-Guidebook-172-320.jpg)
![INTRODUCED at a regular meeting of the City Council of the City of Hayward, held the
[Date TBD], by Councilmember
Sample 50 Percent Water Rationing Ordinance
ORDINANCE NO. XXX
AN ORDINANCE ENACTED AS AN EMERGENCY MEASURE TO ESTABLISH RULES
AND REGULATIONS FOR INCREASED WATER RATIONING DURING A WATER
SHORTAGE EMERGENCY AND ESTABLISHING PENALTIES FOR VIOLATIONS
THEREOF
THE CITY COUNCIL OF THE CITY OF HAYWARD DOES ORDAIN AS FOLLOWS:
SECTION 1. FINDINGS AND DETERMINATIONS
(a) A water shortage emergency condition prevails within the area served by the
Hayward Water System.
(b) On [Date TBD], the San Francisco Water Department, at the direction of the
San Francisco Public Utilities Commission, requested that all resale customers,
including the Hayward Water System, immediately institute a water conservation
program designed to effect a [TBD] percent reduction in water usage.
(c) Such action was taken by the City of Hayward’s adoption of Ordinance No. [TBD]
(d) The severity of the water shortage has prompted the Governor of the State of
California to call upon all communities to adopt water rationing plans to effect a
50 percent reduction in water usage.
(e) On [Date TBD], the San Francisco Water Department, at the direction of the
San Francisco Public Utilities Commission, requested that all resale customers,
including the Hayward Water System, immediately increase water conservation
programs to effect a 50 percent reduction in water usage.
(f) The rules, regulations and restrictions set forth in this ordinance are intended to
conserve the water supply of the Hayward Water System for the greatest public
benefit with particular regard to domestic use, sanitation, and fire protection.
(g) The specific uses prohibited or restricted by this ordinance are nonessential, if
allowed, would constitute wastage of Hayward Water system water, and should
be prohibited pursuant to the City of Hayward’s general authority under its
Charter as well as the authority granted by State Water Code sections 350 et seq.
and the common law.
(h) The actions taken hereinafter are exempt from the provisions of sections 21000
et seq. of the Public Resources Code as a project undertaken as immediate action
necessary to prevent or mitigate an emergency pursuant to Title 14, California
Administrative Code section 15071 (State of California Environmental Impact
Report Guidelines).
175](https://image.slidesharecdn.com/urban-drought-guidebook-final-2008-121104173927-phpapp01/85/California-Urban-Drought-Guidebook-175-320.jpg)
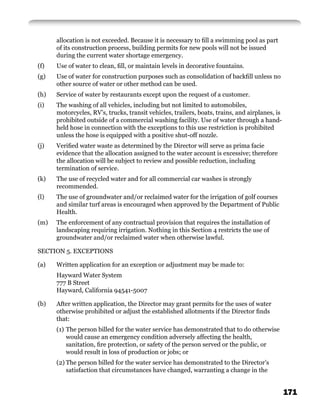
![(i) The following measures are therefore found to be necessary as an emergency
measure for preserving the public peace, health, and safety.
SECTION 1.5 AMENDED PROGRAM
This ordinance supersedes Ordinance No. [TBD]
SECTION 2. DEFINITIONS.
(a) The “Hayward Water System” as operated under divisions of the City of Hayward
Public Works Department.
(b) “Director” is Director of Public Works of the City of Hayward.
(c) “Person” means any person, firm, partnership, association, corporation,
company, organization, or governmental entity.
(d) “Customer” means any person, whether within or without the geographic
boundaries of the City of Hayward, who uses water supplied by the Hayward
Water System.
(e) “Process Water” means water used to manufacture, alter, convert, clean, heat, or
cool a product, including water used in laundries and recycled car wash facilities.
(f) “Unit of Water” is 100 cubic feet of water.
(g) “Water” is water from the Hayward Water System.
SECTION 3. PROHIBITION OF NONESSENTIAL WATER USE
It shall be unlawful for any person to use water obtained from the Hayward Water
System for nonessential uses as hereinafter defined.
SECTION 4. NONESSENTIAL USES DEFINED
The following uses of water are hereby determined to be nonessential, except as further
provided herein:
(a) Use of water in excess of those certain allotments set forth in Schedule A entitled
“Allotment System for Water Use During Water Shortage Emergency” attached
hereto and hereby made a part hereof. 3 Allotments as established herein shall be
based on [Year TBD] use with adjustments for unusual conditions. New services
or services without [Year TBD] history shall be allotted on comparable customer
usage. The City Council is hereby authorized from time to time to establish by
resolution allotments different from the allotments set forth in said Schedule A
due to changes in circumstances.
(b) Use of water through any meter when the person billed for the water service
has been given 10 days written notice to repair broken or defective plumbing,
sprinkler, watering, or irrigation systems and has failed to affect such repairs.
(c) Use of water that results in flooding or runoff in gutters or streets.
(d) Use of water through a hand-held hose for washing buildings, structures,
176](https://image.slidesharecdn.com/urban-drought-guidebook-final-2008-121104173927-phpapp01/85/California-Urban-Drought-Guidebook-176-320.jpg)
![prohibited or adjust the established allotments if the Director finds that:
(a) The person billed for the water service has demonstrated that to do otherwise
would cause an emergency condition adversely affecting the health, sanitation,
fire protection or safety of the person served or the public, or would result in loss
of production or jobs; or
(b) The person billed for the water service has demonstrated to the Director’s
satisfaction that circumstances have changed, warranting a change in the
allotment; or
(c) The person billed for the water service has demonstrated to the Director’s
satisfaction that an adjustment in the allotment based upon 60 gallons per day
per person in a single-family household or 150 gallons per day in a multifamily
living unit is warranted. No permit shall be granted or allotment adjusted unless
the person billed for the service has adopted all practicable water conservation
measures and has demonstrated to the Director’s satisfaction that there are
no alternatives to the use of water from the Hayward Water System and that
Hayward’s water will be used efficiently and without waste.
Upon the filing of a written request for an exception, the owner of a multiple
residential development or a single-family household shall include a certification
that the following water conservation efforts, at a minimum, have been
implemented in every toilet and shower in the multiple residential development
or single-family household:
1) All toilet tanks have been tested for leaks with leak detection dye tablets;
2) A two-quart plastic bag filled with water has been installed in all toilet tanks;
and
3) An approved flow restrictor has been installed in every showerhead.
In multiple residential unit developments served by a master meter where the
owner does not own the units within the development, the owner shall provide
certification under penalty of perjury that a kit containing the equipment for the
above described water conservation efforts was delivered to every unit and each
unit owner or occupant was urged to install the kits. The Director’s denial of an
application for an exception or adjustments is final. The following service charges
or other charges approved from time to time by City Council resolution shall be
applied to allotment changes:
1) Temporary residents – a fee of [Fee TBD] for changing existing allotments;
2) Adjustments to prior billings – a minimum fee of [Fee TBD] to adjust prior
billings.
SECTION 6. EXCESS WATER USE CHARGE
(a) In addition to regular metered service charges under Section 11-2.38 of the
178](https://image.slidesharecdn.com/urban-drought-guidebook-final-2008-121104173927-phpapp01/85/California-Urban-Drought-Guidebook-178-320.jpg)
![Hayward Municipal Code, every person billed for water service shall pay for each
billing period an excess use charge for water delivered in excess of established
allotments. This excess use charge shall be based upon a rate schedule as
specified from time to time by resolution of the City Council.
(b) The excess use charge shall not apply to any residential customer whose
consumption is 1000 cubic feet or less per bi-monthly billing period.
SECTION 7. ENFORCEMENT
(a) Installation of Flow-Restricting Devices: In lieu of or in addition to the penalties
provided for in Section 356 of the Water Code, the Hayward Water System may,
after one written warning, install a flow-restricting device on the service line of
any customer violating any of the provisions of this ordinance, including use of
water in excess of the established allotments.
(b) Charges for Installation and Removal of Flow-Restricting Devices: Charges for
installation and removal of flow-restricting devices shall be based upon a rate
schedule as specified from time to time by resolution of the City Council.
(c) Reduction or Discontinuance of Water Service: Verified water waste consisting
of continued water consumption in violation of the provisions of this ordinance
will serve as prima facie evidence that the allotment to the water account is
excessive and may result in the reduction or discontinuance of water service by
the Hayward Water System. A charge shall be paid prior to reactivating a service
that has been discontinued as provided herein. The charge shall be specified from
time to time by resolution of the City Council.
SECTION 8. EFFECTIVE DATE
The findings and determinations set forth in Section 1 hereof constitute the statement of
reasons for adopting this ordinance as an emergency measure in the manner provided
by section 617 of the Charter. This ordinance shall be effective immediately.
SECTION 9. OPERATIVE DATE
The requirements of this ordinance shall be operative as of [Date TBD].
INTRODUCED at a regular meeting of the City Council of the City of Hayward, held the
[Date TBD], by Councilmember
179](https://image.slidesharecdn.com/urban-drought-guidebook-final-2008-121104173927-phpapp01/85/California-Urban-Drought-Guidebook-179-320.jpg)
![Sample Excess Water Use Charges Resolution
HAYWARD CITY COUNCIL
RESOLUTION NO. __________
Introduced by Councilmember
RESOLUTION ESTABLISHING EXCESS WATER USE CHARGES AND
ENFORCEMENT CHARGES FOR RATIONING WATER DURING A WATER
SHORTAGE EMERGENCY
WHEREAS, by Ordinance No. [TBD] the City Council adopted an emergency ordinance
establishing rules and regulations operative [Date TBD], for water rationing during the
current water emergency; and
WHEREAS, excess water use charges and enforcement charges shall be based upon rate
schedules specified from time to time by resolution of the City Council.
NOW, THEREFORE, be it resolved by the City Council of the City of Hayward that said
Council does hereby adopt the following charges:
SECTION 1
In addition to regular meter service charges, charges based upon the amount of water
supplied and surcharges under Section 11-2.38 of the Hayward Municipal Code,
the following amounts will be charged for water delivered in excess of established
allotments.
Excess Use Charges In Addition to All Other Water Charges for All Hayward
Water Customers
Excess Use Range Percent of Water Used In Excess Use Charge per 100
Excess of Allotment Cubic Feet for all Water Used
in Excess of Allotment
A 0% to 10% over allotment Charges TBD
B 10.01% to 20% over allotment Charges TBD
C Over 20.01% over allotment Charges TBD
180](https://image.slidesharecdn.com/urban-drought-guidebook-final-2008-121104173927-phpapp01/85/California-Urban-Drought-Guidebook-180-320.jpg)
![SECTION 2.
In accordance with Section 7 of Ordinance No. [TBD] the following charges shall be
established for enforcement purposes:
(a) Charges for installation and removal of flow-restricting devices shall be as
follows:
Meter Size Installation Charge Removal Charge
5/8” to 1” Charges TBD
1-1/2” and 2” Charges TBD
(b) A charge of [Charge TBD] shall be paid prior to reactivating a service which has
been discontinued as provided in Ordinance No. [TBD]
IN COUNCIL HAYWARD, CALIF. ,
ADOPTED BY THE FOLLOWING VOTE:
181](https://image.slidesharecdn.com/urban-drought-guidebook-final-2008-121104173927-phpapp01/85/California-Urban-Drought-Guidebook-181-320.jpg)
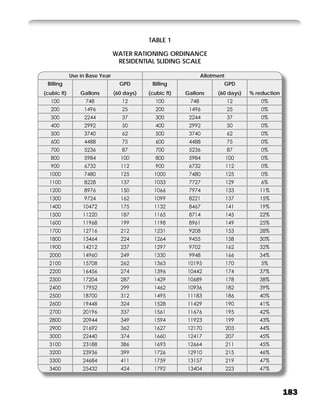
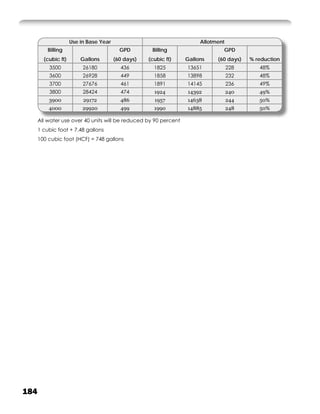
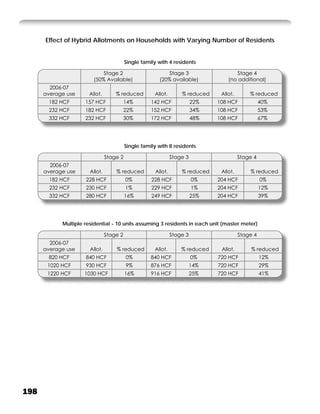
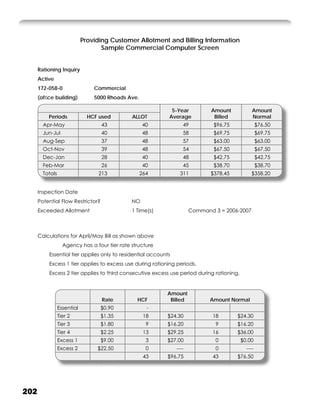
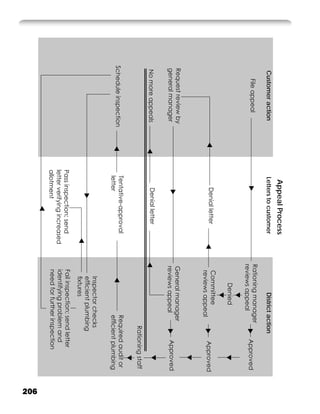
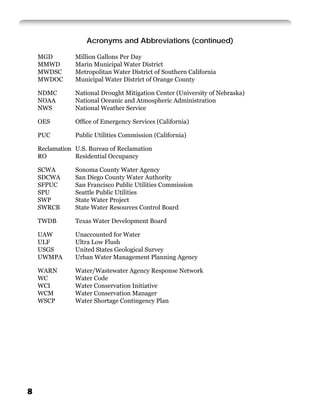
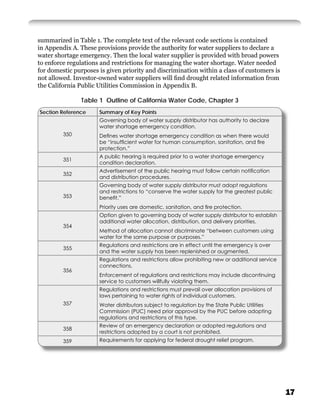
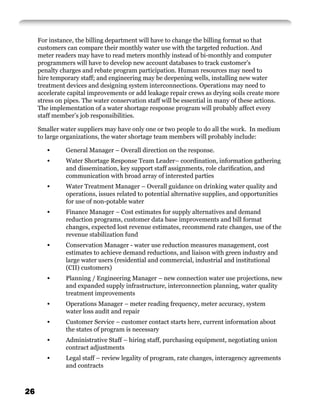
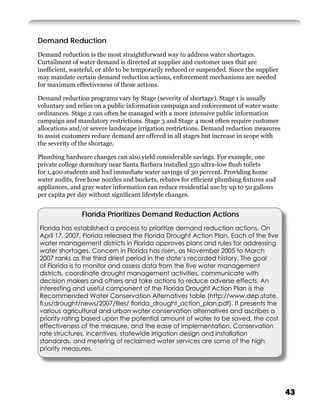
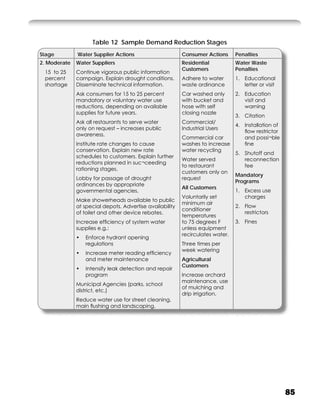
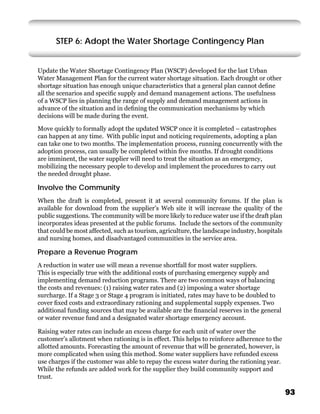
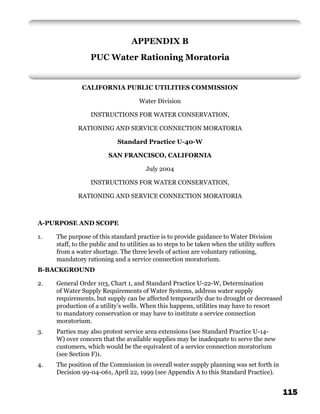
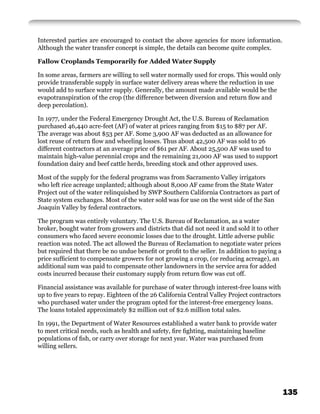
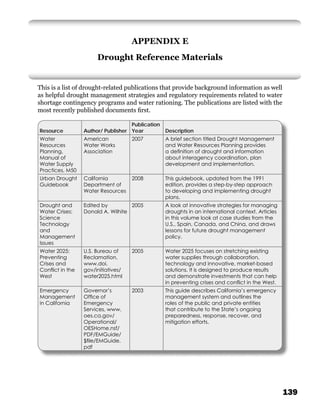
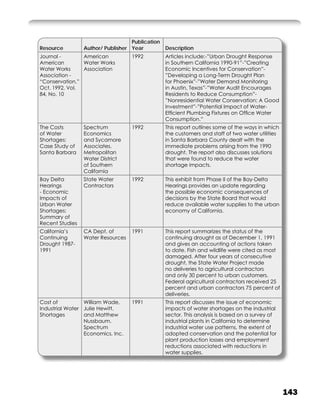
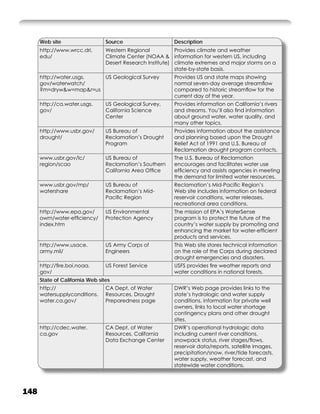
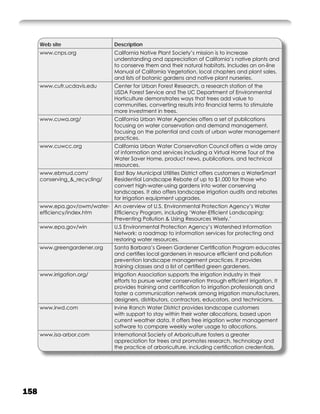
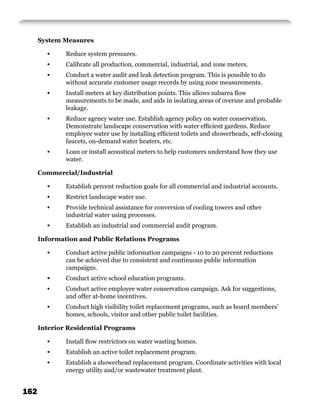
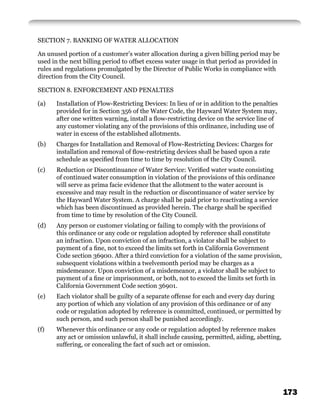
![SCHEDULE A
ALLOTMENT SYSTEM FOR WATER USE DURING
WATER SHORTAGE EMERGENCY
SINGLE FAMILY RESIDENTIAL UNITS:
Allotments to provide for a minimum overall decrease of 50% of [Year TBD] use
(Table 1.)
BI-MONTHLY BILLING-in HCF % REDUCTION
0 to 10 None
11 to 40 Sliding scale from 5% to 50%
All use over 40 90% all over 40
MULTIPLE RESIDENTIAL UNITS:
DESCRIPTION REDUCTION
Domestic with irrigation water 50%
Domestic without irrigation water 20%
Irrigation Only Services 90%
COMMERCIAL AND INDUSTRIAL:
Process Water 20%
Domestic Water 50%
Irrigation Only Services 90%
GOVERNMENTAL:
Domestic Water 50%
Irrigation Services 90%
CONSTRUCTION SERVICES:
Allowed by permit only ---
Water from other sources will be used where available
182](https://image.slidesharecdn.com/urban-drought-guidebook-final-2008-121104173927-phpapp01/85/California-Urban-Drought-Guidebook-182-320.jpg)