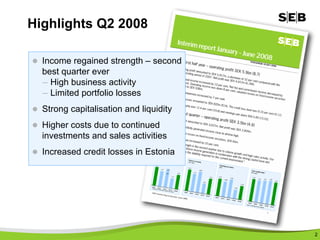
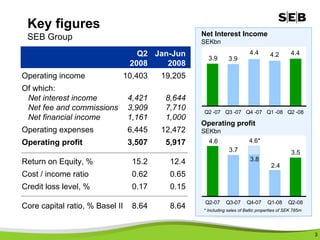
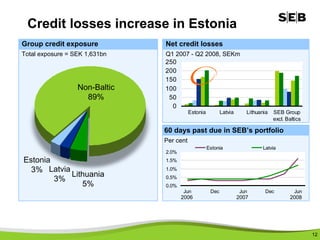
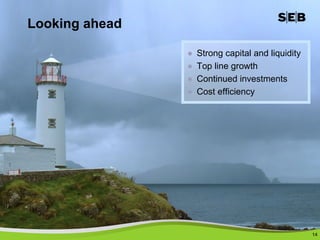
1) SEB reported strong second quarter results with income regaining strength and operating profit reaching its second highest level ever, though costs were higher due to continued investments and business activity was impacted by losses in the Baltic region.
2) Business activity was generally strong across most areas including merchant banking, asset management, and retail banking in Sweden, though the Baltic countries saw economic slowdowns and increased credit losses in Estonia.
3) SEB remains well capitalized and has sufficient liquidity, but expects costs to continue growing around 4% in 2008 due to ongoing investments while maintaining a cost savings program targeting 1.5-2 billion kronor by 2009.
1) SEB reported strong second quarter results with income regaining strength and operating profit of SEK3.5 billion.
2) Business activity was high across various business segments including merchant banking, long-term savings, and retail banking in Sweden.
3) Credit losses increased in Estonia due to the economic slowdown in the Baltic countries. SEB remains well capitalized and liquid.
SEB Resultatpresentation January Juni 2008SEBgroup
1) SEB Group reported strong financial results in the second quarter of 2008, with operating income of 10.4 billion SEK, an operating profit of 3.5 billion SEK, and a return on equity of 15.2%.
2) There was high business activity across SEB's divisions, including increased lending in retail banking and strong sales and inflows in asset management, though portfolio valuations declined.
3) SEB maintains a strong capital position and liquidity, with core capital ratios of 8.64% under Basel II rules and significant long-term funding raised in the first half of 2008.
SEB provided a business update and summarized key financial details for the first half of 2008. Merchant Banking saw high business activity in trading and capital markets, corporate banking, and global transaction services. While income was up, costs also increased due to investments. Credit losses accelerated in Estonia and Latvia. SEB remains well capitalized with a strong liquidity position. The presentation concluded with an overview of priorities for various business divisions, including expanding the Nordic client base and energy sector coverage.
This document provides an executive summary and key figures from the annual accounts of SEB for 2008. It summarizes that SEB had higher operating income but lower commission income. Operating profit was lower due to mark-to-market valuation losses of SEK 1 billion and redundancy costs of SEK 1 billion. Credit loss provisions increased, mainly driven by developments in the Baltic region. Key figures show returns and capital ratios remained strong despite the challenges in 2008.
SEB Group reported lower profits in Q1 2008 compared to Q1 2007 and Q4 2007. Net profit declined 43% year-over-year and 51% quarter-over-quarter due to lower net interest income and net financial income. Total operating income and net fee and commission income also declined. Asset quality remained stable with a low credit loss level of 0.13%. Return on equity fell to 9.6% from 19% in Q1 2007.
The document provides an executive summary of SEB's performance in Q1 2008. Key points include:
- Operating profit of SEK 2.4bn, down 42% from Q1 2007 due to valuation losses and higher credit losses.
- Net interest income grew 8% due to higher lending volumes and margins despite higher funding costs. Fee income was down in retail and capital markets.
- Cost control efforts kept costs flat excluding acquisitions while credit losses increased in Estonia and Latvia.
- The outlook remains uncertain due to ongoing financial turbulence and potential economic slowdowns. SEB is focused on operational excellence and long-term investments.
SEB Resultatpresentation Januari Mars 2008 Annika Falkengren, CeoSEBgroup
SEB reported lower profits in Q1 2008 compared to the previous year due to challenging market conditions and losses on its bond portfolio. Operating profit fell 42% to SEK 2.4 billion as net interest income rose but fees declined. Credit losses increased in Estonia and Latvia as those economies slowed. SEB maintained a strong capital position and is focused on cost control, operational excellence, and long-term investments to create sustainable profit growth through changing economic cycles.
This document provides an overview of SEB's performance in Q1 2008. Key points include:
- Operating profit was SEK 2.4 billion, down 42% from Q1 2007, driven by valuation losses and weaker markets.
- Income declined across most business areas like capital markets, retail Sweden, and the Baltics. However, private banking saw strong net new money inflows.
- Credit losses increased, particularly in Estonia and Latvia as those markets enter their next stage. Cost control efforts helped offset declines.
- While markets remain turbulent, SEB has a strong balance sheet and liquidity position to weather challenges. Long-term, it aims to be the leading bank in Northern
Swedbank reported net profit of SEK 3.4 billion for Q2 2011. Key highlights included a core Tier 1 capital ratio of 14.8% and return on equity of 14.4%. Business areas like Retail and Large Corporates & Institutions performed well, with improved results driven by higher net interest income. Expenses remained flat while lending and deposit volumes were stable year-to-date. Liquidity reserves were further increased and term funding issuance was on plan. Overall, asset quality improved but macroeconomic risks remained.
Goldman Sachs hosted a basic materials conference where Newmont presented. Newmont discussed its focus on eliminating its hedge book, divesting non-core assets, and growing reserves through acquisitions like Miramar. Newmont also provided updates on major projects like its Nevada power plant, Yanacocha gold mill, and Boddington mine. Newmont emphasized that it is the largest unhedged gold producer and expects to continue delivering strong financial and operating performance in 2008 through focus and execution.
Dividend idea Philip Morris (PM) By http://long-term-investments.blogspot.comDividend Yield
Philip Morris International Inc. is a holding company that manufactures and sells cigarettes and other tobacco products in markets outside of the United States. Some key details from the document include that the company has seen steady growth in revenue, earnings per share, and dividends paid over the past decade. The company also maintains strong profit margins between 30-40% and has increased its dividend for the past 5 years at a rate of 13-39% annually. The balance sheet indicates the company has more long-term debt than cash but maintains a high level of retained earnings.
SEB's third quarter 2011 results presentationSEBgroup
- SEB reported higher operating income and profit for Q3 2011 compared to previous quarters, though profit was down 13% from Q2 2011.
- The bank maintained a strong capital position and liquidity reserve sufficient to cover maturing debt over the next two years.
- Net interest income was stable compared to previous quarters, with growth in lending and deposits offsetting lower non-customer income. Fees and commissions were also stable.
This document provides an overview of Skandinaviska Enskilda Banken (SEB) for the first half of 2008. It includes key figures on operating profit, asset quality, divisions, and ratings. SEB saw operating profit decline 23% compared to the second quarter of 2007, though net interest income increased 12% due to growth in lending volume and margins. The document also outlines SEB's organization structure and provides profit and loss statements by quarter comparing 2008 to 2007.
1) The document outlines SEB Group's Q3 2008 results including highlights on asset quality, operations in the Baltics, and capitalization.
2) It shows that SEB had resilient underlying business performance in Q3 2008 but negative financial effects from the financial crisis.
3) The tables and charts present data on topics like income sources, credit exposure by sector and geography, property management portfolio, and asset quality for SEB and their key markets.
- Alcoa reported income from continuing operations of $546 million or $0.66 per share for Q2 2008, an 80% increase over Q1 2008. Revenues increased 3% to $7.6 billion.
- Input costs continued to climb across the industry, with increases in caustic soda, calcined coke, fuel oil, and other materials. However, Alcoa saw double digit profit increases across all operating segments sequentially.
- Cash from operations exceeded $1 billion. The company repurchased $175 million in shares, reaching 10% of shares outstanding under the repurchase program. Global aluminum demand is expected to increase 7.9% in 2008 despite weakness in the US market.
1) The document summarizes a presentation by the CEO of SEB on Q3 2008 results, highlighting a resilient underlying business despite negative financial effects from the crisis.
2) It shows stable income generation and market shares, but higher provisions in Baltic countries due to economic downturn.
3) The Nordic outlook predicts a global recession will import downturn to Sweden and Baltics, with Baltics facing a hard landing though to varying degrees, requiring continued balance sheet management and cost controls at SEB.
Atmos Energy Corporation held an analyst conference on February 26, 2009 to discuss forward-looking statements and projections. The company operates regulated natural gas distribution and transmission operations across 12 states as well as nonregulated midstream businesses. It has achieved steady earnings growth per share of over 5% annually through successful rate case strategies and capital investment programs. Management outlined continued growth opportunities in both regulated and nonregulated operations.
- Alcoa reported net income of $268 million for 3Q 2008, which included $29 million for restructuring. Revenues were $7.2 billion, up from $6.5 billion in 3Q 2007 excluding divested businesses.
- The aluminum industry is facing significant increases in input costs such as caustic soda, calcined coke, ocean freight, and fuel oil. These rising costs have squeezed margins across the industry.
- Compared to 3Q 2007, Alcoa's income from continuing operations excluding special items fell from $340 million to $298 million due to higher costs that were only partially offset by productivity gains and price increases.
This annual report summarizes the financial highlights and strategic goals of Quest Diagnostics for 2007. Some key points:
- Revenues increased 7% to $6.7 billion, operating income was $1.1 billion, and net earnings per share were $2.84.
- The company aims to grow revenues above industry rates, expand operating margins to 20% of revenues, and derive 10% of revenues internationally within 5 years.
- The strategy focuses on putting patients first, driving growth, and investing in people. Diversification efforts include expanding offerings in cancer diagnostics, gene-based testing, and point-of-care testing.
- Information technology is highlighted as a key differentiator
This document summarizes Braskem's 4Q08 earnings conference call. It discusses the significant financial crisis and volatility in exchange rates, raw materials, and resin prices during the quarter. Braskem's net revenue was R$4.1 billion in 4Q08, down 18% from 3Q08. EBITDA was R$633 million, positively impacted by a R$74 million adjustment not related to the period. A R$1.9 billion real depreciation increased liabilities pegged to the US dollar. Braskem's priorities are focusing on financial strength and liquidity, accelerating synergies from acquisitions, maintaining profitability, recovering plant utilization rates, and assessing growth opportunities during the
This investor presentation provides an overview of SEB Group's business segments and financial performance. It discusses SEB's market position in various Nordic and Baltic markets, earnings results for Q3 2008, net interest income and fee income trends, asset quality, business activity updates for different divisions, and the group's bond investment portfolio exposures and related financial effects. Overall, it summarizes SEB's resilient underlying business and franchise while also addressing some negative financial impacts from the global financial crisis.
1) ArcelorMittal reported a 6.6% increase in EBITDA to $8.6 billion for Q3 2008 compared to Q2 2008, supported by its three-dimensional strategy.
2) In response to the current economic environment, ArcelorMittal is increasing planned production cuts to accelerate inventory reduction and increasing its management gains target to $5 billion through additional SG&A savings.
3) Guidance for Q4 2008 EBITDA is provided in the range of $2.5-3 billion, reflecting increased voluntary production cuts. The base dividend is maintained at $1.50 per share for 2009.
The document summarizes Alcoa's 1st quarter 2008 financial results and outlook. Key highlights include income from continuing operations of $303 million, revenues of $7.4 billion, and segment ATOI increasing 42% excluding packaging. Business conditions included lower aluminum prices, unfavorable currency and energy costs, and continued pressure in automotive. The outlook anticipates production increases and improved efficiencies. Alcoa reviews growth opportunities in aerospace, transportation, and infrastructure and discusses strategic priorities around profitable growth, competitive advantages, and disciplined execution.
Swedbanks fourth quarter results 2010 ceo presentationSwedbank
Swedbank reported its fourth quarter 2010 results. Net profit for 2010 was SEK 7.4 billion, with a core Tier 1 capital ratio of 13.94%. Priorities in 2010 included customer satisfaction, lower risk levels, earnings growth, and strengthened liquidity and capitalization. Credit impairments decreased to SEK -483 million in Q4 2010. Risk-weighted assets were reduced by SEK 18.4 billion during the quarter through positive rating migration and de-leveraging in Baltic countries. Swedbank also strengthened its funding position by extending average debt maturity to 27 months and reducing reliance on central bank and government guaranteed funding.
SEB provided a business update and summarized key financial details for the first half of 2008. Merchant Banking saw high business activity in trading and capital markets, corporate banking, and global transaction services. While income was up, costs also increased due to investments. Credit losses accelerated in Estonia and Latvia. SEB remains well capitalized with a strong liquidity position. The presentation concluded with an overview of priorities for various business divisions, including a focus on mid-corporate growth in Nordic and Baltic countries.
SEB second quarter 2011 results presentationSEBgroup
- The document is a presentation of Swedbank's Q2 2011 results.
- Key highlights include an operating profit of SEK 4.3 billion and continued growth in credit volume of SEK 91 billion.
- Net interest income grew year-over-year however fees and commissions declined slightly.
- Credit losses remained low across the Baltics and elsewhere in Europe.
The document summarizes SKF Group's third quarter 2009 results. Key points include a 24.9% year-over-year drop in sales volume but continued strong price/mix gains. Despite restructuring costs, the operating margin excluding restructuring was 8.7%. Cash flow remained strong at SEK 1.36 billion for the quarter. SKF expects demand in the fourth quarter to be slightly higher than Q3.
The document summarizes SKF Group's 9-month results for 2009. Key points include:
- Sales volumes dropped significantly year-over-year due to the economic downturn but price/mix increased.
- Strong cash flow generation despite lower sales.
- Cost reduction efforts through restructuring programs resulted in annual savings of SEK 800 million.
- Operating margins declined from prior years but were higher excluding restructuring costs.
This document summarizes a presentation given by Christoph Brunner, COO of Private Banking at Vontobel, at a banking event in Zurich on November 19, 2008. The presentation discusses Vontobel's strategy and performance, with a focus on continued international growth, client centricity, leveraging their integrated bank model, and efficiency management. It provides targets of maintaining a pre-tax income margin above 40% and net new asset growth above 6% for wealth management.
Highlights of the fourth quarter of 2009. Net sales amounted to SEK 28,215m (28,663) and income for the period was SEK 664m (-474), or SEK 2.34 (-1.68) per share. Net sales declined by 1% in comparable currencies, due to continued weak markets.
1) The document presents the quarterly results for 2010 of a bank. It highlights solid results given the current economic climate with lower provisions for credit losses and no new non-performing loans.
2) The bank saw a decline in income compared to previous periods but operating expenses also declined, leading to a higher operating profit. Net interest income decreased primarily from lower lending income.
3) The bank has initiated a Nordic growth plan to expand its corporate banking business across the Nordic region and strengthen its position through regional hubs in each country.
SEB Facts And Figures January September 2008SEBgroup
This document provides an overview of key financial information for SEB Group for Q3 and January-September 2008. Some key points:
- Operating profit decreased 46% in Q3 2008 and 36% January-September compared to the same periods in 2007, driven by lower net financial income and higher credit losses.
- Net interest income increased 16% in Q3 2008 supported by higher lending volumes and margins, despite pressure from funding costs and deposit margins.
- Ratings agencies have changed their outlook on SEB to negative in recent months due to the deteriorating economic environment.
- The majority of SEB's operating profit in January-September 2008 came from its Swedish banking operations, with other key contributors
Imperial reported an 18% increase in revenue and a 12% increase in operating profit for the first six months of fiscal year 2013. While most divisions performed well, logistics divisions faced challenging conditions in South Africa and Europe. The automotive retail and aftermarket parts divisions achieved strong growth. Overall, the results represent a good performance despite difficult market conditions in some areas.
BBVA demonstrated the recurrent nature and sustainability of its business model in 2008. In the first quarter of 2009, BBVA continued its strong performance with recurrent operating income supported by recurrent revenues and greater efficiency. Risk management also remained prudent with lower entries to NPAs, provisioning in line with the second half of 2008, and ample generic provisions to cover losses.
Highlights of the third quarter of 2009. Net sales amounted to SEK 27,617m (26,349) and income for the period to SEK 1,631m (847), or SEK 5.74 (2.99) per share. Net sales declined by 3% in comparable currencies, due to continued market downturn in Electrolux main markets.
The document summarizes Eni's third quarter 2011 results. Some key highlights include:
- Libya's oil export volumes were improving with Greenstream restarting in October and Bahr-Essalam expected to restart in November. This reduced Eni's production by approximately 190kboe/d for 2011.
- Eni made its largest discovery ever at Mamba South in Mozambique.
- Adjusted operating profit was €4.6 billion, up from €4.1 billion in Q3 2010. Adjusted net profit was €1.8 billion, up from €1.7 billion.
- Oil and gas production was 1,954 kboe/d,
SEB Executive Summary January September 2008SEBgroup
This document provides a summary of SEB's performance from January to September 2008. It highlights the challenging market conditions but notes SEB's resilient underlying business. Key figures show a decline in operating profit and net profit compared to previous periods. The summary also discusses SEB's strong capital and liquidity positions, continued growth in lending and deposits, and efforts to manage costs.
Highlights of the second quarter of 2009. Net sales amounted to SEK 27,482m (25,587) and income for the period to SEK 658m (99), or SEK 2.32 (0.36) per share. Net sales declined by 8.4%, in comparable currencies, due to continued sharp market downturn in Electrolux main markets.
The SKF Group reported record quarterly cash flow in Q2 2009 despite a dramatic 30.8% drop in sales volume from the previous year. SKF implemented cost reduction efforts including restructuring programs that achieved annual savings of around SEK 800 million. Demand outlook for Q3 2009 is expected to be significantly lower than the previous year but leveling off sequentially.
This annual report summarizes Tele2's financial results for 2008. Key highlights include:
- Net sales of SEK 39.5 billion and EBITDA of SEK 8.2 billion.
- 24.5 million total customers across 11 countries at the end of 2008.
- Continued strong growth in Russia, adding 1.8 million new customers to reach 10.4 million total.
- Proposes a total dividend of SEK 5 per share, including an ordinary dividend of SEK 3.50 per share and a special dividend of SEK 1.50 per share.
SEB reported strong results in the second quarter of 2012, with continued growth in income and efficiency. Net interest income grew due to increased lending and deposit volumes. Fees also increased due to growth in advisory and fund management services. Cost control led to improved operating leverage. Asset quality remained high, with low credit losses. The balance sheet was further strengthened in the quarter through capital generation and liquidity management. Going forward, SEB expects the economic recovery to proceed slowly, but aims to benefit from its strong franchise and customer-centric strategy.
Highlights of the second quarter of 2010. Net sales amounted to SEK 27,311m (27,482) and income for the period was SEK 1,028m (658), or SEK 3.61 (2.32) per share. Net sales increased by 2.8% in comparable currencies, due to higher sales volumes.
Highlights of the first quarter of 2012. Net sales amounted to SEK 25,875m (23,436) and income for the period was SEK 559m (457), or SEK 1.96 (1.61) per share. Net sales improved by 10.4%, of which 3.5% was organic growth. The acquisitions of CTI and Olympic Group impacted sales by 5.8%.
Similar to SEB Telephone Conference Presentation 2008 Q2 (20)
SEB third quarter 2015 results presentationSEBgroup
- SEB reported financial results for the first three quarters of 2015, with operating profit of SEK 16.3 billion, up 5% from the same period in 2014.
- Net interest income declined 4% due to lower lending margins, while net fee and commission income rose 9% driven by higher asset management fees.
- Asset quality remained strong with a low net credit loss level of 0.06% and non-performing loans declining to SEK 8.5 billion.
SEB's second quarter 2015 results presentationSEBgroup
This document contains a press conference presentation by Annika Falkengren, President & CEO of SEB, covering the bank's financial results for January-June 2015. The key points are:
- SEB reported an underlying profit before credit losses of SEK 12.4 billion for the first half of 2015, up 17% from the same period in 2014. Reported profit was SEK 11 billion.
- Net interest income was down 1% to SEK 9.6 billion due to margin pressure, while net fee and commission income rose 48% to SEK 2.8 billion due to higher market volatility and customer activity.
- All business divisions reported higher profits compared to the first half of 2014
SEB's first quarter 2015 results presentationSEBgroup
- SEB reported strong results for the first quarter of 2015, with operating income increasing 5% and operating profit increasing 18% compared to the first quarter of 2014.
- Increased volatility in financial markets drove higher customer demand for risk management products. Net interest income and net fee and commission income both increased compared to the first quarter of 2014.
- SEB continues to execute its strategy of growing its asset gathering franchise, with strong inflows in unit-linked assets under management, private banking assets, and household deposits.
This document summarizes the Q3 2014 results presentation from SEB, a major Nordic and Baltic bank. It highlights that SEB experienced income and operating profit growth in the first three quarters of 2014, with strong asset quality and financial strength. All of SEB's business divisions contributed to improved operating leverage and profit growth. Going forward, SEB aims to continue its disciplined execution and focus on customer relationships amid increased global uncertainty.
SEB reported strong financial results for the first half of 2014, with total operating income increasing 7% compared to the first half of 2013. Net interest income grew 7% driven by higher lending volumes, and net fee and commission income increased 12% from higher asset management fees. The bank continued its customer-driven growth across the Nordic region and Germany. Looking forward, SEB aims to deepen customer relationships, execute its business plan efficiently, and adapt to ongoing regulatory changes.
The annual report summarizes Swedbank's financial performance in 2013. Key highlights include growing operating profit by 27% to 18.1 billion SEK through customer-driven growth, broadening earnings across divisions, and maintaining cost and capital efficiency. Swedbank achieved a return on equity of 13.1% and increased its common equity tier 1 capital ratio to 15%. Looking forward, the bank will continue focusing on long-term customer relationships through relationship banking to deliver competitive and sustainable returns.
SEB reported improved third quarter 2013 results with increased operating leverage and profit. Key points include:
1) Operating profit increased 21% in Q3 and 15% year-to-date on higher net interest income and fees despite renewed regulatory uncertainty.
2) Business sentiment surveys show improved conditions in Sweden while operating expenses declined and pre-provision profits grew.
3) Divisional performance was strong across Retail, Wealth, Baltic, and Merchant Banking units though regulatory issues continue to impact the financial sector.
SEB reported higher business activity and more customers in the first half of 2013. Key highlights included:
1) Increased operating income and profits compared to previous periods due to higher business volumes and more retail customers.
2) Strong asset quality and capital ratios were maintained.
3) The presentation outlined strategies for continued growth in customer base and markets.
Annika Falkengren, President & CEO of SEB, summarized the bank's annual report for 2012 in the following areas:
1. Business expansion with increased number of clients and credit portfolio in both large corporate and SME segments across Nordics and Germany.
2. Improved customer satisfaction ratings compared to peers for both large corporate and SME segments.
3. Increased operating leverage with higher average quarterly income and lower average quarterly expenses.
4. Strong balance sheet with capital and liquidity ratios exceeding requirements.
SEB's third quarter 2012 results presentationSEBgroup
The document summarizes SEB's financial results for the third quarter of 2012. It highlights a robust result in a defensive market environment, more customers and higher customer satisfaction, and resilience in capital, liquidity and costs. Key figures presented include operating income of SEK 9.7 billion, pre-provision operating profit of SEK 4.1 billion, and net interest income growth. SEB is focusing investments on strengthening its corporate franchise in the Nordics and Germany, expanding its SME platform in Sweden, and developing long-term savings offerings.
EU to save banks but abandon state if Greece rejects austeritySEBgroup
The EU will save its banks but abandon the state if Greece rejects austerity in the upcoming vote on 17 June, SEB’s chief strategist Johan Javeus projects in a presentation where he outlines what might lie ahead for the recession-hit country. Recent opinion polls suggest the country will get a pro-austerity government, but the final outcome is far from certain and since Greek law does not allow more polls until the election, Europe will be flying blind for a couple of weeks.
Economic growth has led to lower employment and combined with earnings from abroad and remittances this has added a significant amount of funds to households’ disposable income in all three Baltic countries, SEB’s latest Baltic Household Outlook shows.
SEB sees 25 per cent chance of Riksbank cutSEBgroup
The document summarizes an internal survey by SEB of expectations for the upcoming Riksbank monetary policy decision and market reaction. Key points:
1) 82% of respondents expect the Riksbank to keep rates unchanged, while 18% expect a 25 basis point cut.
2) If rates stay unchanged, the survey expects Swedish bond yields to rise up to 10 basis points and the euro to fall 2-6 figures against the krona.
3) If rates are cut, yields could fall 7-12 basis points and the euro rise 4-7 figures against the krona.
4) On average, respondents expect the repo rate to be 1.27% by
SEB-report: EU financial transactions tax unlikely to passSEBgroup
The European Commission will propose a Tobin tax on financial transactions this autumn with the aim of introducing it by 2018. The tax is intended to raise revenue, reduce market volatility, and discourage risky behavior by financial institutions. However, previous attempts to implement financial transaction taxes have raised less revenue than expected and had unclear effects on volatility. Actual implementation of an EU-wide Tobin tax is unlikely due to opposition from Sweden and the UK. A stability levy on balance sheet positions may be easier to implement.
SEB:s Boprisindikator visar att hushållen är mindre positiva till bostadsmark...SEBgroup
Färre än tidigare tror på stigande bostadspriser och fler tror på fallande priser. Det visar SEB:s Boprisindikator för juni, som faller tillbaka jämfört med förra månaden.
University of North Carolina at Charlotte degree offer diploma Transcripttscdzuip
办理美国UNCC毕业证书制作北卡大学夏洛特分校假文凭定制Q微168899991做UNCC留信网教留服认证海牙认证改UNCC成绩单GPA做UNCC假学位证假文凭高仿毕业证GRE代考如何申请北卡罗莱纳大学夏洛特分校University of North Carolina at Charlotte degree offer diploma Transcript
Enhancing Asset Quality: Strategies for Financial Institutionsshruti1menon2
Ensuring robust asset quality is not just a mere aspect but a critical cornerstone for the stability and success of financial institutions worldwide. It serves as the bedrock upon which profitability is built and investor confidence is sustained. Therefore, in this presentation, we delve into a comprehensive exploration of strategies that can aid financial institutions in achieving and maintaining superior asset quality.
Fabular Frames and the Four Ratio ProblemMajid Iqbal
Digital, interactive art showing the struggle of a society in providing for its present population while also saving planetary resources for future generations. Spread across several frames, the art is actually the rendering of real and speculative data. The stereographic projections change shape in response to prompts and provocations. Visitors interact with the model through speculative statements about how to increase savings across communities, regions, ecosystems and environments. Their fabulations combined with random noise, i.e. factors beyond control, have a dramatic effect on the societal transition. Things get better. Things get worse. The aim is to give visitors a new grasp and feel of the ongoing struggles in democracies around the world.
Stunning art in the small multiples format brings out the spatiotemporal nature of societal transitions, against backdrop issues such as energy, housing, waste, farmland and forest. In each frame we see hopeful and frightful interplays between spending and saving. Problems emerge when one of the two parts of the existential anaglyph rapidly shrinks like Arctic ice, as factors cross thresholds. Ecological wealth and intergenerational equity areFour at stake. Not enough spending could mean economic stress, social unrest and political conflict. Not enough saving and there will be climate breakdown and ‘bankruptcy’. So where does speculative design start and the gambling and betting end? Behind each fabular frame is a four ratio problem. Each ratio reflects the level of sacrifice and self-restraint a society is willing to accept, against promises of prosperity and freedom. Some values seem to stabilise a frame while others cause collapse. Get the ratios right and we can have it all. Get them wrong and things get more desperate.
A toxic combination of 15 years of low growth, and four decades of high inequality, has left Britain poorer and falling behind its peers. Productivity growth is weak and public investment is low, while wages today are no higher than they were before the financial crisis. Britain needs a new economic strategy to lift itself out of stagnation.
Scotland is in many ways a microcosm of this challenge. It has become a hub for creative industries, is home to several world-class universities and a thriving community of businesses – strengths that need to be harness and leveraged. But it also has high levels of deprivation, with homelessness reaching a record high and nearly half a million people living in very deep poverty last year. Scotland won’t be truly thriving unless it finds ways to ensure that all its inhabitants benefit from growth and investment. This is the central challenge facing policy makers both in Holyrood and Westminster.
What should a new national economic strategy for Scotland include? What would the pursuit of stronger economic growth mean for local, national and UK-wide policy makers? How will economic change affect the jobs we do, the places we live and the businesses we work for? And what are the prospects for cities like Glasgow, and nations like Scotland, in rising to these challenges?
The Universal Account Number (UAN) by EPFO centralizes multiple PF accounts, simplifying management for Indian employees. It streamlines PF transfers, withdrawals, and KYC updates, providing transparency and reducing employer dependency. Despite challenges like digital literacy and internet access, UAN is vital for financial empowerment and efficient provident fund management in today's digital age.
Discover the Future of Dogecoin with Our Comprehensive Guidance36 Crypto
Learn in-depth about Dogecoin's trajectory and stay informed with 36crypto's essential and up-to-date information about the crypto space.
Our presentation delves into Dogecoin's potential future, exploring whether it's destined to skyrocket to the moon or face a downward spiral. In addition, it highlights invaluable insights. Don't miss out on this opportunity to enhance your crypto understanding!
https://36crypto.com/the-future-of-dogecoin-how-high-can-this-cryptocurrency-reach/
STREETONOMICS: Exploring the Uncharted Territories of Informal Markets throug...sameer shah
Delve into the world of STREETONOMICS, where a team of 7 enthusiasts embarks on a journey to understand unorganized markets. By engaging with a coffee street vendor and crafting questionnaires, this project uncovers valuable insights into consumer behavior and market dynamics in informal settings."
2. Highlights Q2 2008
Income regained strength – second
best quarter ever
– High business activity
– Limited portfolio losses
Strong capitalisation and liquidity
Higher costs due to continued
investments and sales activities
Increased credit losses in Estonia
2
3. Key figures
Net Interest Income
SEB Group SEKbn
Q2 Jan-Jun 4.4 4.4
4.2
3.9 3.9
2008 2008
Operating income 10,403 19,205
Of which:
Net interest income 4,421 8,644
Net fee and commissions 3,909 7,710 Q2 -07 Q3 -07 Q4 -07 Q1 -08 Q2 -08
Net financial income 1,161 1,000
Operating profit
Operating expenses 6,445 12,472 SEKbn
4.6*
4.6
Operating profit 3,507 5,917
3.7 3.5
3.8
Return on Equity, % 15.2 12.4 2.4
Cost / income ratio 0.62 0.65
Credit loss level, % 0.17 0.15
Q2-07 Q3-07 Q4-07 Q1-08 Q2-08
Core capital ratio, % Basel II 8.64 8.64 * Including sales of Baltic properties of SEK 785m
3
4. High business activity – Merchant Banking
Merchant Banking: Operating Income Portfolio valuations, SEKm
SEKm Accumulated
Q2 07 Q1 08 Q2 08 since
Q2 08 Q3 07
2,000
Income -66 -2,707
Equity -56 -2,384
Total -122 -5,091
Portfolios
1,000
Q2 08
Available Held for
89%
for sale trading
11% (MTM over
(MTM over
income)
equity)
0
TCM excl Corporate GTS
CPM Banking
4
5. High business activity – long-term savings
Swedish mutual funds: net inflows Life – Total sales
Jan-Jun, SEKbn SEKbn
3.8 13.3
12.0 12.0 11.9
10.7
9.7
-3.0
-7.2 -8.5
-13.3
Q1-07 Q2 Q3 Q4 Q1-08 Q2
Robur SHB Nordea SEB Others
Private Banking – Net sales
SEKbn
5.8
4.9
4.1
3.5
2.9 2.6
Q1 Q2 Q3 Q4 Q1 Q2
2007 2008
5
7. Volume growth supported
by strong capital
Risk-weighted assets (Basel I) Core capital ratios
Q1 2007 - Q2 2008, SEKbn Per cent
600 10
+26% Basel II Basel I
+13%
500
9
400
8
300
200
7
100
6
0
Q1 Q2 Q3 Q4 Q1 Q2
Merchant Banking Retail Banking
2007 2007 2007 2007 2008 2008
7
8. Net liquidity position across maturities
30 June, SEKbn
250
SEB is match-
200 funded approx.
one year
SEK 113bn in long-term funding
150
raised in H1 2008
Examples of transactions:
100
April: Euro covered bond at spread
of 17 bps
50
May/June: Euro floating rate notes
at spread of 48 bps
0
-50
1 week
2 weeks
4 weeks
2 months
3 months
4 months
5 months
6 months
9 months
12 months
8
9. Cost development
~4% total cost growth due to acquisitions, pensions and One IT Roadmap
SEK 202m in efficiency gains achieved in H1
Cost management program 2007 - 2009
Achieved Target
SEK -748m SEK 1.5 – 2.0bn
*
2007 2008 2009 2010
*
9
11. Baltic countries:
economic slowdown accelerates
Annual GDP growth
Per cent Estonia Latvia Lithuania
15
10
5
0
2002 2003 2004 2005 2006 2007 2008 (f) 2009 (f)
-5
SEB’s credit exposure
Estonia Latvia Lithuania
Corporate Property Management Households Public Administration Banks
SEKbn 83
79
76
50 51
49
41 42
41
2007 Q1 08 Jun 08
Q2 '08 2007 Q1 08 Q2 08 2007 Q1 08
Mar '08 Q2 08
Dec '07 Mar '08 Dec '07 Mar '08 Jun '08 Dec '07 Jun '08
+3%
+18% -1% +30% +3% +4%
+17% 0% +2%
Growth rates in local currency
11
12. Credit losses increase in Estonia
Group credit exposure Net credit losses
Total exposure = SEK 1,631bn Q1 2007 - Q2 2008, SEKm
250
200
150
Non-Baltic 100
89% 50
0
Estonia Latvia Lithuania SEB Group
excl. Baltics
60 days past due in SEB’s portfolio
Per cent
Estonia Latvia
2.0%
Estonia 1.5%
3% Latvia 1.0%
Lithuania
3% 0.5%
5% 0.0%
Jun Dec Jun Dec Jun
2006 2007 2008
12
13. SEB in Germany
SEB in Germany: Operating profit Retail Germany: Operating profit
SEKm SEKm
136 134
74
843 60
807
-22
189
-226
-244
H1 07 H2 H1 08 H1 05 H2 H1 06 H2 H1 07 H2 H1 08
Distribution of Operating profit
Jan – Jun 2008
Other
91 % business
9%
Retail
13
14. Looking ahead
● Strong capital and liquidity
● Top line growth
● Continued investments
● Cost efficiency
14