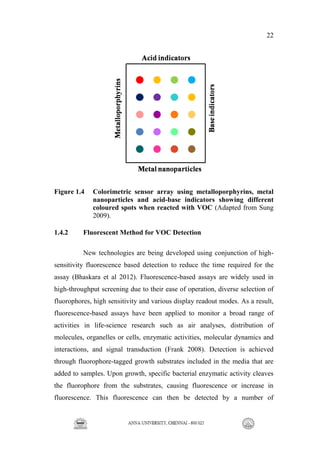
NEW APPROACH TO BACTERIAL
DIAGNOSTICS: 2-METHYLBUTANAL AS A
VOLATILE ORGANIC BIOMARKER FOR
PROTEUS FOR DEVELOPING PROTEAL, A RAPID
AND NON-INVASIVE DETECTION METHOD AND
RATIONAL DESIGN OF ITS DIAGNOSTIC
CULTURE MEDIUM
A THESIS
Submitted by
AARTHI R
in partial fulfillment of the requirements for the degree of
DOCTOR OF PHILOSOPHY
FACULTY OF TECHNOLOGY
ANNA UNIVERSITY
CHENNAI 600 025
JULY 2015
ii
ANNA UNIVERSITY
CHENNAI 600 025
CERTIFICATE
The research work embodied in the present Thesis entitled “NEW
APPROACH TO BACTERIAL DIAGNOSTICS: 2-METHYLBUTANAL
AS A VOLATILE ORGANIC BIOMARKER FOR PROTEUS FOR
DEVELOPING PROTEAL, A RAPID AND NON-INVASIVE DETECTION
METHOD AND RATIONAL DESIGN OF ITS DIAGNOSTIC CULTURE
MEDIUM” has been carried out in the Centre for Biotechnology, Anna
University, Chennai - 600 025. The work reported herein is original and does
not form part of any other thesis or dissertation on the basis of which a degree
or award was conferred on an earlier occasion or to any other scholar.
I understand the University’s policy on plagiarism and declare that
the thesis and publications are my own work, except where specifically
acknowledged and has not been copied from other sources or been previously
submitted for award or assessment.
AARTHI R Dr. K. SANKARAN
RESEARCH SCHOLAR SUPERVISOR
Professor
Centre for Biotechnology
Anna University
Chennai – 600 025
iii
ABSTRACT
Control of infectious diseases through early identification of
pathogens, or better still, surveillance to eradicate is becoming more and more
meaningful with the emergence of Multi-drug-resistance (MDR) and spread
of dangerous pathogenic forms from hospitals to communities. The most
common and prevalent Urinary Tract Infections (UTI) are also one of the
most neglected infectious diseases. The classical and current techniques for
diagnosis are not effective for a variety of reasons including the nature of the
diagnostic targets and methods. Hence, its treatment is quite challenging
making it imperative to develop quick diagnosis and render antibiotic
treatment effective. Taking one of the notorious nosocomial causative
bacterium, Proteus, we have addressed the challenge making a paradigm shift
in the approach of detecting the bacteria.
In this regard, Volatile Organic Compounds (VOCs) which are
secreted as defense against antagonists or as signalling molecules by the
organisms under specific conditions through specific biochemical pathways
were exploited. In the case of Proteus, 2-methylbutanal identified by GC-MS
was found to be the characteristic volatile compound released in Luria Bertani
(LB) broth. Using this compound we were able to develop a simple test in 96-
well microplate format that can be directly applied to the 7 h culture of the
bacterium to give a yes-or-no type of response for fluorimetric detection. The
assay, named ProteAl, (Prote, “Proteus” & Al, “Aldehyde”) involves instant
reaction of 5-dimethylaminonaphthalene-1-sulfonylhydrazine (DNSH) with
iv
2-methylbutanal under acidic condition to give green fluorescence (other
organisms show orange fluorescence).
This diagnostic assay has been tested using 39 standard and 56
known clinical strains representing frequently encountered uropathogens
including {27 Proteus (both mirabilis and vulgaris), 27 E.coli, 8 Klebsiella,
10 Staphylococcus, 7 Pseudomonas}, 2 Enterobacter, 2 Citrobacter, 7
Salmonella, 4 Shigella and 200 environmental soil strains. The sensitivity and
specificity of this high-throughput assay performed in 96-well format were
100% under laboratory conditions and therefore forms the basis for larger
clinical validation. This cost-effective diagnostic tool will be useful in
hospitals, peripheral clinics, epidemiological studies and environmental
surveillance.
Metabolic pathway and regulation studies (including qPCR) based
on the limited reports available in a few other systems revealed the presence
of functional pathway in Proteus and its regulation through Isoleucine (Ile)
and Thiamine pyrophosphate (TPP). This led to the designing of LB-Ile
medium with 15 mM isoleucine in LB to enhance the production of the
biomarker 2.5 times more than normal. The growth in the rationally designed
medium and ProteAl now would provide a convenient diagnostic tool for
identifying this bacterium from clinical samples within 7 h. The expression of
alpha-ketoacid decarboxylase (kdcA) of Proteus grown in LB-Ile medium
revealed a seven-fold increase in expression compared to normal LB. This
indicated to the operation of transcriptional control in Proteus and this is the
first such report revealing the existence of isoleucine catabolism in Proteus
(mirabilis and vulgaris).
v
Though we have focused on Proteus associated with UTI, the
method is genus specific and therefore can be used for other disease
conditions. The development of such cost effective, non-invasive and non-
destructive method has been shown to be readily amenable for simple
imaging based instrumentation (like gel doc) for routine clinical use. In
conclusion, we have taken a new approach towards next generation diagnostic
method for infectious bacteria that can be readily adapted to instrumentation
and automation.
vi
ACKNOWLEDGEMENTS
I would like to express my sincere gratitude to my guide
Prof. K. Sankaran for providing me an excellent opportunity to work in this
challenging field of research. I graciously thank him for all the stimulating
scientific discussions and the constant encouragement to aim high scientific
standards.
I sincerely thank Prof. P. Gautham, Director, Centre for
Biotechnology for his support during my Ph.D. I am also grateful to my
doctoral committee members, Dr. Venkatesh Balasubramanian, IIT-Madras
and Dr. M. Ramalingam (Retd.) Anna University, for their helpful
suggestions. I profoundly thank Prof. G.M. Samuel Knight, Director CPDE
for his support and encouragement. I am grateful to Mr. Suresh Lingham,
M/s Trivitron Pvt Ltd. for clinical samples, Dr. Mathiyarasu and
Sankararao, CECRI, Karaikudi, Dr. T. Sivakumar, Prof. B. Sivasankar
Anna University, Prof. Mohanakrishnan, University of Madras,
Dr. A. Alagumaruthanayagam and B. Palanisamy for analysis and analytical
data. I would like to specifically thank my seniors, fellow colleagues and all
scholars of CBT for their constant encouragement and support. I owe my
sincere gratitude to all technical and non-technical staffs of CBT for their
support. I thank UGC-BSR, CPEES and CSIR-SRF for their financial
assistance during my research.
Heartfelt thanks to my husband Mr. M. Thiruvengadam and my
in-laws for their encouragement. Lastly, I must say that I would not be where
I am without the unending support of my parents Late. Mr. S. Raju,
Mrs. Mangai Raju and all others in my family. I am indebted to them.
Their moral support all through these years of my research is the driving force
behind this achievement.
AARTHI R
vii
TABLE OF CONTENTS
CHAPTER NO. TITLE PAGE NO.
ABSTRACT iii
LIST OF TABLES xvi
LIST OF FIGURES xviii
LIST OF SYMBOLS AND ABBREVIATIONS xxvi
1 INTRODUCTION 1
1.1 INCREASING BURDEN AND THREAT
OF INFECTIOUS DISEASES 1
1.1.1 Nosocomial Infections, Complicating
Factor in the Control 8
1.1.2 Multi-drug-resistance is a Major Threat
and Challenge 10
1.2 INADEQUACY OF CLASSICAL AND
CURRENT DIAGNOSTIC METHODS AND
LACK OF SCREENING AND SURVEILLANCE
METHODS FOR PREVENTIVE HEALTHCARE 13
1.2.1 Limitations of Emerging Modern Methods 14
1.3 NEED FOR NEW APPROACHES TO DEVELOP
NEXT GENERATION TOOL WITH MODERN
KNOWLEDGE 17
1.3.1 Intra and Extracellular Targets for
Non-invasive and Non-destructive
Detection Methods 17
1.3.2 Volatile Organic Compounds (VOCs) as
Extracellular Targets 19
viii
CHAPTER NO. TITLE PAGE NO.
1.4 CURRENT METHODS FOR DETECTION OF
VOLATILE ORGANIC COMPOUNDS (VOCs) 21
1.4.1 Colorimetric Sensor Array 21
1.4.2 Fluorescent Method for VOC Detection 22
1.4.3 Gas Chromatography and Mass
Spectroscopy (GC-MS) 23
1.4.4 Biosensors 25
1.4.5 E-nose 26
1.5 REGULATION OF VOLATILE ORGANIC
COMPOUND METABOLISM 27
1.6 RATIONAL DESIGN OF MEDIA FOR
ENHANCED VOLATILE ORGANIC
COMPOUND PRODUCTION 30
1.7 PROTEUS AS A MODEL STUDY ORGANISM 31
1.7.1 Proteus –General Introduction 32
1.7.2 Pathogenesis and Diseases Caused
by Proteus 33
1.7.3 Proteus as a Nosocomial Organism 36
1.8 OVERVIEW OF THE THESIS 37
1.9 OBJECTIVES 39
2 MATERIALS AND METHODS 41
2. 1 MATERIALS USED IN THIS STUDY 41
2.1.1 Chemicals Used 41
2.1.2 Buffers used in this Study 44
2.1.3 Cheminformatic Analysis of Bacterial
Volatile Organic Compound 45
2.1.4 Bacterial Strains used in the Study 45
ix
CHAPTER NO. TITLE PAGE NO.
2.1.4.1 Standard strains 45
2.1.4.2 Clinical isolates 46
2.2 PREPARATION OF GROWTH MEDIUM
AND TEST METHOD 48
2.2.1 Antibiogram Medium 48
2.2.2 Catalase Test 48
2.2.3 Cetrimide Agar Test 48
2.2.4 Eosin Methylene Blue Agar (EMB) Test 49
2.2.5 Luria Bertani Broth 49
2.2.6 Luria Bertani Agar 49
2.2.7 Methyl Red and Voges Proskauer
(MR-VP) Test 49
2.2.8 Motility Test Agar 50
2.2.9 Nutrient Broth 50
2.2.10 Phenylalanine Deaminase Test 50
2.2.11 Salmonella Shigella Agar 51
2.2.12 Simmons’ Citrate Agar 51
2.2.13 Triple Sugar Iron Agar 51
2.2.14 Tryptone Soya Broth 51
2.2.15 Tryptone Broth 51
2.2.15.1 Indole test method 52
2.2.16 Urea Broth 52
2.3 GENOMIC DNA ISOLATION 52
2.3.1 Agarose Gel Electrophoresis 53
2.3.2 Polymerase Chain Reaction (PCR) 54
2.4 EXTRACTION OF VOLATILE ORGANIC
COMPOUNDS (VOCS) FROM CULTURE 54
x
CHAPTER NO. TITLE PAGE NO.
2.5 INSTRUMENTAL METHODS FOR VOC
IDENTIFICATION 56
2.5.1 Gas Chromatographic (GC) Analysis 57
2.5.2 Gas Chromatography-Mass
Spectroscopy (GC-MS) Analysis 57
2.5.2.1 GC 57
2.5.2.2 MS 57
2.5.3 Fourier Transform-Infrared
(FT-IR) Analysis 58
2.5.4 Comparative Analysis of Pure Compound
and the Characteristic VOC from
Proteus using Gas Chromatography 58
2.6 DEVELOPMENT OF SURVEILLANCE
METHOD FOR IDENTIFICATION OF
CHARACTERISTIC VOC 58
2.6.1 Colorimetric Assay for Carbonyl
Volatile Organic Compounds 59
2.6.2 Fluorescent Dye Reagent Specific for
Carbonyl Compounds 59
2.7 STANDARDIZATION OF DNSH ASSAY
FOR CARBONYL COMPOUNDS 60
2.8 FLUORESCENCE BASED DNSH ASSAY
(PROTEAL) FOR DETECTION OF PROTEUS
SPECIES 61
2.9 TESTING THE VOLATILITY OF
2-METHYLBUTANAL FROM CULTURE 62
2.10 LABORATORY VALIDATION OF THE
PROTEAL ASSAY 62
xi
CHAPTER NO. TITLE PAGE NO.
2.11 SENSITIVITY AND SPECIFICITY
CALCULATION 63
2.12 IDENTIFICATION OF THE METABOLIC
PATHWAY USING BIOLOGICAL
DATABASES 64
2.13 RATIONAL DESIGN OF GROWTH MEDIUM
FOR ENHANCED 2-METHYLBUTANAL
PRODUCTION 64
2.13.1 Study on the Effect of Branched Chain
Amino Acids on 2-methylbutanal
Production 65
2.13.2 Study on the Effect of TPP for
2-methylbutanal Production 65
2.14 REGULATION OF THE METABOLIC PATHWAY
INVOLVED IN 2-METHYLBUTANAL
PRODUCTION 66
2.14.1 Extraction of Total RNA from
Proteus Culture 66
2.14.2 Conversion of RNA to cDNA 67
2.14.3 Quantification of Gene Expression
using Real-time PCR (qPCR) 67
3 RESULTS 69
3.1 A NON-DESTRUCTIVE APPROACH FOR
PATHOGEN DETECTION USING VOLATILE
ORGANIC COMPOUNDS 69
3.1.1 VOC Biomarkers Found in Various
Uropathogens 70
xii
CHAPTER NO. TITLE PAGE NO.
3.1.2 Microbiological, Biochemical and
Molecular Techniques Identifies the
Uropathogens 77
3.2 SOLVENT EXTRACTION WAS THE
SUITABLE METHOD FOR VOC
EXTRACTION FROM CULTURE 79
3.3 GAS CHROMATOGRAM IDENTIFIED
THE CHARACTERISTIC COMPOUNDS
OF PROTEUS AND SALMONELLA
CULTURE EXTRACT 80
3.3.1 Identification of 2-methylbutanal as
Specific VOC for Proteus using
GC-MS and FT-IR 82
3.3.2 Comparative Analysis of the Gas
Chromatogram of 2-methylbutanal and
DCM-extract of Proteus Confirmed
2-methylbutanal as the Characteristic
VOC of Proteus 85
3.4 DETECTION OF VOLATILE CARBONYLS
USING COLORIMETRIC AND
FLUORIMETRIC REAGENTS 86
3.4.1 Colorimetric Reagent Detected
Micromole Levels of VOCs 86
3.4.2 Standardization of the Fluorescent
Reagent Showed Better Sensitivity 87
3.4.2.1 Identification of carbonyl
compounds using fluorescent
reagent 2,4-DNSH 88
xiii
CHAPTER NO. TITLE PAGE NO.
3.4.2.2 Development of 96-well based
fluorimetric assay for detection
of carbonyl compounds using
the optimized reagent 89
3.4.2.3 Fluorescence shift was
observed between Proteus and
non-Proteus organisms 90
3.4.2.4 ProteAl is found specific to
Proteus among the commonly
occurring Uropathogens 92
3.4.2.5 The amount of 2-methylbutanal
from Proteus culture was
quantified 93
3.4.2.6 The volatile component
responsible for green fluorescence
in ProteAl was confirmed to
be 2-methylbutanal 95
3.4.2.7 The characteristic
2-methylbutanal was
highly volatile 96
3.5 VALIDATION OF THE ASSAY USING
VARIOUS CLINICAL UROPATHOGENS 97
3.6 RELEASE OF 2-METHYLBUTANAL BY
PROTEUS THROUGH ISOLEUCINE
METABOLIC PATHWAY 100
3.6.1 In Silico Analyses Revealed the Presence
of the Enzymes of Isoleucine Catabolism
in Proteus 101
xiv
CHAPTER NO. TITLE PAGE NO.
3.6.2 Enhanced Fluorescence Due to Isoleucine
Supplementation in the Growth Medium 104
3.6.3 Enhancement of 2-methubutanal
Production using Thiamine
Pyrophosphate Supplements 106
3.6.4 LB-Isoleucine (LB-Ile) Medium Enhanced
2-methylbutanal Production Compared
to other Supplemented Medium 108
3.7 TOTAL RNA WAS EXTRACTED BY
PHENOL- CHLOROFORM METHOD 109
3.7.1 Total RNA was Efficiently Reverse
Transcribed to cDNA 110
3.7.2 Amplified Product Showed the Presence
of α-ketoacid decarboxylase (kdcA)
Gene Transcript 111
3.7.3 Gene Expression of Proteus Species in LB
and LB Supplemented Growth Medium 113
3.7.3.1 Isoleucine (Ile) and Thiamine
pyrophosphate (TPP) addition
to LB medium alters the
expression of α-ketoacid
decarboxylase (kdcA) Gene in
P. mirabilis 113
3.7.3.2 Isoleucine (Ile) and Thiamine
pyrophosphate (TPP) addition
to LB medium alters the
expression of α-ketoacid
decarboxylase (kdcA) Gene
in P. vulgaris 115
xv
CHAPTER NO. TITLE PAGE NO.
4 DISCUSSION 118
4.1 EXTRACELLULAR VOC HAS BEEN
TARGETED FOR NON-DESTRUCTIVE
DIAGNOSIS 119
4.1.1 Single Step Reaction to Provide a
Sensitive Method 121
4.2 REGULATION OF THE METABOLIC
PATHWAY IN PROTEUS 125
4.2.1 ProteAl is Useful in Identifying
Multi-drug-resistance of Proteus 127
4.2.2 ProteAl is a Convenient Signal Generating
Component of Simple and Affordable
Imaging based Diagnostic and
Surveillance Instrumentation 127
5 CONCLUSION 130
REFERENCES 133
LIST OF PUBLICATIONS 146
xvi
LIST OF TABLES
TABLE NO. TITLE PAGE NO.
1.1 Common infectious agents, symptoms
and tests currently available for their detection 3
1.2 Advantages and disadvantages of molecular
methods used for bacterial identification 16
1.3 Diseases and their odours 18
1.4 Advantages and disadvantages of some of the methods
currently used for VOC analysis in clinical aspect 24
2.1 List of reagents, dyes and kits 41
2.2 List of buffers used and their composition 44
2.3 List of biochemical and microbiological tests to identify
E. coli, Klebsiella, Proteus, Pseudomonas, Salmonella,
Shigella and Staphylococcus 47
2.4 List of organisms and their 16S rRNA Primer sequence 53
2.5 List of environmental sample collection locations 63
2.6 Table for sensitivity and specificity calculation 63
2.7 List of genes and their primer sequences 68
3.1 Reported Volatile Organic Compounds released by
various bacteria in different growth medium 71
3.2 Results of the tests performed for a few uropathogens 77
3.3 Comparative VOC profiles of Proteus with medium
and negative control 81
3.4 Assay sensitivity for various carbonyl compounds 89
3.5 Validation of ProteAl using standard and clinical strains 98
3.6 Environmental sample details and the strains identified 99
xvii
TABLE NO. TITLE PAGE NO.
3.7 Multiple sequence alignment of aminotransferase in
Lactococcus lactis and Proteus mirabilis sequence 102
3.8 Multiple sequence alignment of alpha-ketoacid
decarboxylase in Lactococcus lactis and Proteus
mirabilis sequence 103
3.9 Concentration of isoleucine and the fluorescence
response of ProteAl 104
3.10 Concentration of Thiamine pyrophosphate and the
fluorescence response of ProteAl 107
3.11 The fluorescence value of different supplemented
growth medium obtained in three trials 109
3.12 Calculation of fold difference in P. mirabilis
using 2-ΔΔCT
method 114
3.13 Calculation of fold difference in P. vulgaris
using 2-ΔΔCT
method 115
xviii
LIST OF FIGURES
FIGURE NO. TITLE PAGE NO.
1.1 The percentage of death in developing countries caused
by communicable and non-communicable diseases
are represented in the pie chart. Communicable
diseases account to 31% of deaths worldwide 2
1.2 The global market for treatment of infectious diseases
shows an increase in economic burden due to viral and
bacterial infections from 2008 to 2014 7
1.3 Different sources that cause hospital acquired infections 10
1.4 Colorimetric sensor array using metalloporphyrins,
metal nanoparticles and acid-base indicators showing
different coloured spots when reacted with VOC 22
1.5 Representative VOC metabolic pathway involving
amino acids 29
1.6 A schematic diagram showing proteins produced by
P. mirabilis that are known or hypothesized to be
virulence factors important in urinary tract infections 34
1.7 A schematic diagram of the urinary tract showing
urethra, bladder, ureters & kidneys and the indicating
(red spots) are the diseases that are associated with
Proteus. The virulence factors listed under each
infection contribute to their pathogenicity 35
2.1 Charcoal adsorbant contained in a tissue paper bag
was kept hanging above the culture or pure compound
containing medium to facilitate adsorption for
further analysis 55
xix
FIGURE NO. TITLE PAGE NO.
2.2 Silica discs were used as VOC adsorbant as shown in
pictures a-c. The adsorbed VOC were eluted using
suitable solvent from the silica disc a) Silica disc
cut to the size of inner dimension of the Vial cap
b) Silica disc placed inside of the vial cap
c) Silica disc covering the mouth of the conical flask 55
2.3 Simple VOC extraction setup using a syringe, needle
and a capillary tube as shown in pictures a-c. The
solvent phase which collects the VOC contained in
the syringe and vial were analysed using GC-MS
a) shows the VOC collection using a syringe from
1.5ml vial b) shows the VOC collection with the
syringe set-up from 15ml centrifuge tube
c) shows the VOC collection using a capillary tube 56
3.1 The gas chromatogram of Dichloromethane extracts
of LB (media control), Proteus (positive sample) and
Salmonella (negative control) cultures. The unique
peak for Proteus culture at 8.227 min is denoted
by an arrow 82
3.2 GC analysis of DCM extract from Proteus culture
and the mass spectrum of the sample at retention
time 1.78 min (a) shows the gas chromatograms
of volatile organic compounds in the DCM extracts
of Proteus. The characteristic peak at 1.78 min in
Proteus was further analyzed for identification of mass
(b) is the mass spectrum of the unique compound
for Proteus at Rt. 1.78 min in GC. The fragment peak at
57 m/z is the base peak showing 100% abundance and
corresponding to 2-methylbutanal. No other carbonyl
compound was detected from the other peaks 83
xx
FIGURE NO. TITLE PAGE NO.
3.3 FT-IR spectra of P. mirabilis and P. vulgaris solvent
extract in comparison with 2-methylbutanal and
medium blank. The Proteus samples showed the
presence of carbonyl group along with the =C-H
stretch corresponding to an aldehyde which is
similar to the standard 2-methylbutanal. Together,
the analysis was suggestive of the presence of
2-methylbutanal as the volatile organic compound
in low abundance in the cultures of Proteus grown in LB 85
3.4 Comparative chromatogram of the culture extract
of Proteus and standard 2-methylbutanal. The gas
chromatographic peak at 2.3 min from Proteus culture
extract matched with the peak for 2-methylbutanal 86
3.5 Spot detection of 2-methylbutanal vapours with 2,4
DNPH produced a bright yellow coloured product
while with alcohol and blank no bright yellow coloured
product was formed. Standard 2-methylbutanal ranging
from 20-50 µmoles were spotted using 2,4 DNPH 87
3.6 Comparative fluorescence response of DNSH reacting
with carbonyl compounds (positive) and non-carbonyl
compounds (negatives) or DNSH reacting under acidic
condition. The signal-to-noise ratio was high when
DNSH reacts under acidic conditions. This formed
the basis of the DNSH reagent preparation 88
3.7 The picture shows the fluorescence obtained from the
reaction of DNSH with pure compounds. The DNSH
reagent reacted with the carbonyl compounds to form
respectively hydrazones showing green fluorescence
while blank and acids form no product retaining
the reagent’s orange fluorescence 89
xxi
FIGURE NO. TITLE PAGE NO.
3.8 Differentiation of carbonyl (green fluorescence)
and non-carbonyl compounds (orange fluorescence).
Carbonyl Compounds used: Hexanal, Nonanal,
2-methylbutanal, Benzaldehyde, Decanal, 2-nonanone,
2-tridecanone, 2-heptanone, 2-undecanone, 2-pentanone,
Acetophenone, Non-carbonyl compounds- alcohols:
Propanol, Ethanol, Methanol, Butanol and acids:
Propionic acid, Phosphoric acid and Butyric acid
all added in duplicates 90
3.9 Determination of Ex. /Em. λmax for pure compounds
and bacterial cultures. The emission spectra on the left
(excitation 336 nm) (a) are of pure carbonyl (hexanal
and 2-heptanone), acid (propionic acid) and alcohol
(butanol) compounds after reaction with DNSH under
the assay conditions. The emission spectra on the right
(b) are of the cultures of Proteus, UPEC and Salmonella
after reaction with DNSH under the assay conditions 91
3.10 Performance of DNSH reagent on a set of standard
strains distinguishing Proteus (A2 to A11& B2 to B11)
with green fluorescence from the LB medium blank
(A1&B1) and negatives UPEC (A12&B12, D1 to
D3 & E1 to E3), Klebsiella (D4, E4, D5 & E5), E. coli
(D6 to D9 & E6 to E9) and Salmonella (D10 to D12
& E10 to E12) showing orange fluorescence 92
3.11 Proteus cultures grown in LB medium showed
higher fluorescence response compared to the blank
and other common growth media NB, AB, and TSB 93
xxii
FIGURE NO. TITLE PAGE NO.
3.12 The fluorescence response of Proteus and other organisms
after ProteAl. Proteus species showed maximum
fluorescence compared to the medium blank and other
bacteria, which have comparable response levels 94
3.13 The set of data in this composite figure compares
the properties of pure 2-methylbutanal with those
of DCM-extract from the Proteus culture
(a) shows the fluorescence emission spectra of DNSH
reacted with 2-methylbutanl matched with that of the
spectrum obtained from the reaction of DNSH with
the culture (b) is the standard graph for 2-methylbutanal
using ProteAl assay showing sensitivity up to 1 nmol
and good linearity up to 20 nmol (c) shows the graph
of the fluorescence response for bacterial cultures
using ProteAl performed every hour up to 24 h 95
3.14 2-metyhylbutanal is seen as a secretary VOC product
as only the culture supernatant but not the cells of
Proteus yielded green fluorescence (wells 7&8)
after ProteAl 96
3.15 Volatility of 2-methylbutanal released by Proteus in
comparison with pure compound. (a) shows that the
fluorescence intensity of DNSH-derivatized carbonyl
compound(s) in the Proteus cultures kept at room
temperature (27 ºC), fridge (4 ºC) and on ice (0 ºC)
reduces drastically as a function of temperature as well
as duration of storage indicating volatile nature.
(b) shows the fluorescence intensity of standard
2-methylbutanal experimented similar to Proteus
culture at different temperatures 96
xxiii
FIGURE NO. TITLE PAGE NO.
3.16 Validation of ProteAl using 39 standard strains and
56 clinical isolates as given in table 3.5. Out of the
95 strains screened, 27 strains gave positive results
indicated by bright green fluorescence. Others
including uropathogenic strains showed the
background orange fluorescence 97
3.17 Validation of environmental strains. Wells G 4, 5 and
H 4, 5 are duplicates of standard positive control,
P. mirabilis and P. vulgaris respectively. Only Proteus
strains were identified by the green fluorescence while
the others gave orange fluorescence 100
3.18 The putative isoleucine catabolic pathway involved
in the production of 2-methylbutanal in Proteus.
The metabolic pathway uses the enzymes
aminotransferase and α-ketoacid decarboxylase for
conversion of acid to an aldehyde 101
3.19 Fluorescence response for only Proteus increased
after addition of isoleucine in the LB medium while the
negatives and blank did not show any distinct effect.
The profile shows that the addition of isoleucine
beyond 15mM (peak concentration) actually led to the
reduction in the enzyme activity 105
3.20 The bar-diagram indicates specific increase in
fluorescence of Proteus to ProteAl in LB -Ile medium
compared to LB or its supplementation with related
branched chain amino acids. It evidently shows that only
isoleucine enhances 2-methylbutanal production 106
xxiv
FIGURE NO. TITLE PAGE NO.
3.21 Fluorescence increased as a function of Thiamine
pyrophosphate supplementation in the LB medium for
Proteus. The peak indicates the concentration (2 mM)
of TPP for maximal production of 2-methylbutanal.
Beyond 2 mM of TPP there is a drastic reduction in
2-methylbutanal production 107
3.22 The picture shows the yield of 2-methylbutanal under
growth in LB, LB-Ile, LB-TPP, LB-Ile-TPP.
While LB-Ile showed the maximum 2-methylbutanal
production in all the three trials 108
3.23 Ethidium bromide stained 1.5 % agarose gel shows
the total RNA extracted from Proteus. Lane 1 contains
a 1Kb DNA ladder. Lanes 2-4 and 5-7 contains RNA
of Proteus mirabilis and Proteus vulgaris respectively 109
3.24 cDNA was synthesized from the total RNA of P. mirabilis
and P. vulgaris grown in LB or LB supplemented with
Ile or TPP. The cDNA preparations, which appear as
smears in agarose gel electrophoresis, was used as
template for qPCR amplification 110
3.25 The PCR amplified product shows distinct bands
corresponding to the size of alpha-ketoacid
decarboxylase gene transcript at approximately 225 bp
in P. mirabilis (Fig. (a) lane 1 and Fig. (b) lanes 2&3)
and P. vulgaris (Fig. (a) lane 2 and Fig. (b) lanes 4&5) 111
3.26 Sequencing results of alpha-ketoacid decarboxylase
gene transcript. The red coloured basepairs denotes the
sequence of kdcA gene transcript after sequencing
in P. mirabilis and P. vulgaris 112
xxv
FIGURE NO. TITLE PAGE NO.
3.27 The fold difference in PCR template from Proteus
cells growing in LB, LB-Ile and LB-Ile-TPP was
calculated using the 2-ΔΔCT
method. The expression of
α-ketoacid decarboxylase of P. mirabilis grown in
LB-Ile was found to be maximum compared to LB
and LB-Ile-TPP medium corroborating with
enzymatic activity data 114
3.28 The expression of α-ketoacid decarboxylase of
P. vulgaris grown in LB-Ile was found to be
maximum compared to LB and LB-Ile-TPP medium 116
3.29 Concept diagram showing positive feedback regulation
of kdcA gene through isoleucine 117
4.1 Schematic Overview of the thesis 129
xxvi
LIST OF SYMBOLS AND ABBREVIATIONS
Symbols
α - Alpha
cm - Centimeter
o
C - Degree Celsius
eV - Electron Volt
g - Gram
h - Hour
λmax - Lambda max
L - Litre
m/z - Mass-to-charge ratio
m - Meter
µg - Microgram
µl - Microlitre
µm - Micrometer
µM - Micromolar
µmol - Micromole
mg - Milligram
ml - Milliliter
mm - millimeter
mM - Millimolar
min - Minute
M - Molar
ng - Nanogram
nm - Nanometer
nM - Nanomolar
xxvii
nmol - Nanomole
N - Normality
% - Percentage
pmole - Picomole
sec - Seconds
U - Unit
Abbreviations
DNSH - 1-Dimethylaminonaphthalene-
5-sulfonylhydrazide
MDNPH - 1-methyl-1-(2,4-dinitrophenyl)hydrazine
TCPH - 2,4,6-trichlorophenylhydrazine
DNPH - 2,4-dinitrophenylhydrazine
DAIH - 2-diphenylacetyl-1,3-indandione-1-hydrazone
pNPH - 4-nitrophenylhydrazine
AIDS - Acquired Immuno Deficiency Syndrome
ALT - Alanine transaminase
kdcA - Alpha-keto decarboxylase
ABD - Aminosulfonylgroup
Ap–Sm–Su–Tc–Tp - Ampicillin - streptomycin –
sulfamethoxazoletetracycline- trimethoprim
AB - Antibiogram medium
Ab - Antibody
BVOCs - Bacterial Volatile Organic Compounds
Bp - Base pair
BLAST - Basic Local Alignment Search Tool
BCATs - Branched chain aminotransferases
BAW - Bulk Acoustic Wave
xxviii
CDC - Centre of Disease Control
CAGR - Compounded annual growth rate
CP - Conductive Polymer composite chemiresistors
dNTP - Deoxy Nucleotide Triphosphate
DNA - Deoxy Ribonucleic Acid
DCM - Dichloromethane
DEPC - Diethyl pyrocarbonate
DBD - Dimethylaminosulfonyl group
DHE - Dynamic headspace extraction
EI - Electron ionization
EHEC - Enterohemorrhagic Escherichia coli
ETEC - Enterotoxigenic Escherichia coli
EIA - Enzyme immunoassay
ELISA - Enzyme linked immune sorbent assay
EMB - Eosin methylene blue
E. coli - Escherchia coli
EDTA - Ethylene Diamine Tetra Acetic acid, di
sodium salt
Ex/Em - Excitation and emission wavelengths
ESBL - Extended-spectrum betalactamase
FID - Flame ionization detection
FT-IR - Fourier Transform-Infrared
GC-MS - Gas Chromatography and Mass Spectroscopy
GASFET - Gas sensitive field effect transistor sensors
HIV - Human Immunodeficiency Virus
IgM - Immunoglobulin M
IMViC - Indole, methyl red, Voges-Proskauer and
citrate
ICUs - Intensive care units
xxix
ICH &HC Institute of Child Health and Hospital for
Children
ICP - Intrinsically conductive polymer
chemiresistors
IMS - Ion mobility spectrometry
Ile - Isoleucine
kb - Kilobase
KPa - Kilopascal
KEGG - Kyoto Encyclopedia of Genes and Genomes
Leu - Leucine
LED - Light emitting diode
LB - Luria Bertani
MOSFET - Metal oxide semiconductor field effect
transistors
MOS - Metal oxide semiconductors
MDR - Multi-drug-resistance
NCBI - National Center for Biotechnology
Information
NBD - Nitrobenzooxadiazole
NMR - Nuclear Magnetic Resonance
NASBA - Nucleic Acid Sequence Based Amplification
NB - Nutrient broth
ORF - Open Reading Frame
OD - Optical Density
PPM - Parts per million
PFPH - Pentafluorophenylhydrazine
PBS - Phosphate Buffer Saline
PID - Photoionization detection
PCR - Polymerase Chain Reaction
xxx
DPO - Polymer-Deposited Optical sensors
PTR-MS - Proton-transfer-reaction mass spectrometry
qPCR - Quantitative PCR
QCM - Quartz crystal microbalance
RFU - Relative Fluorescent Unit
Rt - Retention time
RT-PCR - Reverse Transcriptase Polymerase Chain
Reaction
RNaseA - RibonucleaseA
RNA - Ribonucleic acid
rpm - Rotations per minute
SS agar - Salmonella-Shigella agar
SEB - Self-encoded bead
SDS - Sodium dodecyl sulfate
SHE - Static Headspace Extraction
SAW - Surface Acoustic Wave
TPP - Thiamine pyrophosphate
TSM - Thickness-shear mode
TSI - Triple sugar iron test
TBE - Tris Borate EDTA
Tris - Tris-[Tris-(hydroxy methyl) amino methane]
TSB - Tryptone Soya broth
UTI - Urinary Tract Infections
UPEC - Uropathogenic Escherichia coli
Val - Valine
VNC - Viable-but-nonculturable
VOCs - Volatile Organic Compounds
WBCs - White blood cells
WHO - World Health Organization
1
CHAPTER 1
INTRODUCTION
1.1 INCREASING BURDEN AND THREAT OF INFECTIOUS
DISEASES
Technical advancements not with-standing, infectious diseases
spread by microorganisms including bacteria, fungi, viruses or parasites
directly or indirectly result in epidemics and pandemics. Zoonotic diseases are
stoically persistent due to animal-human cohabitation and emergence of
virulent variants. Non-communicable diseases, malnourishment, therapeutic
interventions like chemotherapy compromise immunity and make us prone to
opportunistic microbial infections. Several such factors, both due to our
dominance on earth and purely man-made factors, keep us constantly on our
toes to combat infectious diseases and compel us to look for new approaches
against evolving threats. There is a constant battle between technical
advancement including the understanding of pathogenesis at molecular level
and the capability of microbial pathogens in overcoming host defense,
colonize and spread. Despite the remarkable advances in research and
treatments during the 20th
century, infectious diseases remain among the
leading causes of death worldwide (WHO report 2012) for three main
reasons: (a) emerging of new infectious diseases; (b) re-emerging of the old
infectious diseases; and (c) Persistence of the intractable infectious diseases
(Obi et al 2010). Influenza, HIV/AIDS, cholera, tuberculosis, diphtheria,
malaria etc have exploded globally and re-emerging diseases such as plague,
yellow fever, dengue are on the surge (Lashley 2003). The WHO reported in
2
2010 that 31% of deaths in developing countries are caused by communicable
disease, while the remaining deaths are caused by other non-communicable
diseases as shown in Figure 1.1.
Figure 1.1 The percentage of death in developing countries caused by
communicable and non-communicable diseases are
represented in the pie chart. Communicable diseases
account to 31% of deaths worldwide. (Reproduced from
(https://mikesnexus.files.wordpress.com/2015/02/causeofdea
thdevelopingcountries.jpg?w=676)
Past three decades of intense research in the molecular
pathogenesis, especially using modern genetics and molecular biology, have
unraveled stepwise progression involving entry and adherence of pathogens
to specific host cells, colonization in tissues, and the damage, which is then
diagnosed as the disease. Pathogens enter the host through the orifices in our
body such as eyes, mouth, genital openings or wounds that breaches the skin
barrier. Though some pathogens grow at the entry site, many pathogens travel
to their specific host cells and colonize, either after intracellular or
extracellular invasion. Pathogens apart from growing in the host, cause severe
tissue damage and diseases through the release of destructive enzymes or
3
toxins. Despite such detailed understanding at the molecular level, our
inability to combat these diseases effectively is still a challenge, as the
application of emerging technologies is outsmarted by the evolution and
emergence of new infectious agents to changes in the human demographics,
behavior, land use and changes in the transmission dynamics. Table 1.1
provides the currently prevalent infectious agent, signs and symptoms and
diagnosis available for their detection.
Table 1.1 Common infectious agents, symptoms and tests currently
available for their detection
Causative agents
by type
Signs and symptoms Laboratory testing
Viral
Hepatitis A
Diarrhea, dark urine, jaundice and
flu-like symptoms i.e. fever,
headache, nausea and abdominal
pain.
Increase in ALT,
bilirubin. Positive IgM
and antihepatitis A
antibodies.
Noroviruses
Nausea, vomiting,
abdominal cramping,
diarrhea, fever and myalgia.
Routine RT-PCR.
Clinical diagnosis. Stool
is negative for WBCs.
Rotavirus
Vomiting, watery diarrhea, low-
grade fever. Temporary lactose
intolerance may occur. Infants and
children, elderly and
immunocompromised are especially
vulnerable.
Identification of virus in
stool via immunoassay.
Other viral agents
(astroviruses,
adenoviruses,
parvoviruses)
Nausea, vomiting, diarrhea, malaise,
abdominal pain, headache and fever.
Identification of the virus
in early acute stool
samples. Serology.
Commercial ELISA kits
are now available for
adenoviruses and
astroviruses
4
Table 1.1 (Continued)
Causative agents
by type
Signs and symptoms Laboratory testing
Bacteria
Bacillus anthracis
Nausea, vomiting, malaise, bloody
diarrhea, acute abdominal pain.
Blood test.
Bacillus cereus
Sudden onset of severe nausea and
vomiting. Diarrhea may be present.
Normally a clinical
diagnosis. Clinical
laboratories do not
routinely identify this
organism. If indicated,
send stool and food
specimens to reference
laboratory for culture and
toxin identification.
Campylobacter
jejuni
Diarrhea, cramps, fever, and
vomiting; diarrhea may be bloody.
Routine stool culture;
Campylobacter requires
special media and
incubation at 42°C to
grow
Enterohemorrhagic
E. coli (EHEC)
including E. coli
O157:H7 and other
Shiga toxin-
producing E. coli
(STEC)
Severe diarrhea that is often bloody,
abdominal pain and vomiting.
Usually, little or no fever is present.
More common in children
Stool culture; E. coli
O157:H7 requires special
media to grow. If E. coli
O157:H7 is suspected,
specific testing must be
requested. Shiga toxin
testing may be done
using commercial kits;
positive isolates should
be forwarded to public
health laboratories for
confirmation and
serotyping.
Enterotoxigenic E.
coli (ETEC)
Watery diarrhea, abdominal cramps,
some vomiting.
Stool culture. ETEC
requires special
laboratory techniques for
identification. If
suspected, must request
specific testing.
5
Table 1.1 (Continued)
Causative agents
by type
Signs and symptoms Laboratory testing
Bacteria
Listeria
monocytogenes
Fever, muscle aches, and nausea or
diarrhea. Pregnant women may have
mild flu-like illness, and infection
can lead to premature delivery or
stillbirth. Elderly or
immunocompromised patients may
have bacteremia or meningitis.
Blood or cerebrospinal
fluid cultures.
Asymptomatic fecal
carriage occurs;
therefore, stool culture
usually not helpful.
Antibody to listerolysin
O may be helpful to
identify outbreak
retrospectively
Salmonella spp
Diarrhea, fever, abdominal cramps,
vomiting. S. typhi and S. Paratyphi
produce typhoid with insidious onset
characterized by fever, headache,
constipation, malaise, chills, and
myalgia; diarrhea is uncommon, and
vomiting is not usually severe.
Routine stool cultures
Shigella spp.
Abdominal cramps, fever, and
diarrhea. Stools may contain blood
and mucus.
Routine stool cultures.
Staphylococcus
aureus
Sudden onset of severe nausea and
vomiting. Abdominal cramps.
Diarrhea and fever may be present.
Normally a clinical
diagnosis. Stool,
vomitus, and food can be
tested for toxin and
cultured if indicated.
Vibrio cholera
Profuse watery diarrhea and
vomiting, which can lead to severe
dehydration and death within hours.
Stool culture; Vibrio
cholerae requires special
media to grow. If V.
cholerae is suspected,
must request specific
testing.
6
Table 1.1 (Continued)
Causative agents
by type
Signs and symptoms Laboratory testing
Parasites
Cryptosporidium
Diarrhea (usually watery), stomach
cramps, upset stomach, slight fever.
Request specific
examination of the stool
for Cryptosporidium.
May need to examine
water or food.
Cyclospora
cayetanensis
Diarrhea (usually watery), loss of
appetite, substantial loss of weight,
stomach cramps, nausea, vomiting,
fatigue.
Request specific
examination of the stool
for Cyclospora. May
need to examine water or
food.
Entamoeba
histolytica
Diarrhea (often bloody), frequent
bowel movements, lower abdominal
pain.
Examination of stool for
cysts and parasites—may
need at least 3 samples.
Serology for long-term
infections.
Trichinella spiralis
Acute: nausea, diarrhea, vomiting,
fatigue, fever, abdominal discomfort
followed by muscle soreness,
weakness, and occasional cardiac
and neurologic complications
Positive serology or
demonstration of larvae
via muscle biopsy.
Increase in eosinophils.
(Adapted from http://www.fda.gov/Food/FoodborneIllnessContaminants/
FoodborneIllnessesNeedToKnow/default.htm)
The huge expenditure involved in the treatment of infectious
diseases proves to be a drain on global economic resources. Figure 1.2 shows
the expenditure on infectious diseases in 2008, valued to be $90.4 billion and
this is expected to increase at a compounded annual growth rate (CAGR) of
8.8% and reach $138 billion in 2014. Out of the total expenditure, 53% is
spent on antibiotic treatment for bacterial and fungal diseases. As bulk of it is
for bacterial diseases, mainly due to a limited number of bacteria like
7
Mycobacterium tuberculosis, Salmonella typhi, Shigella spp, E. coli,
Streptococcus, Pseudomonas, Proteus, Klebsiella and Camphylobacter our
interest is in bringing down the bacterial diseases treatment cost which
increased from $40 billion in 2009 to $50 billion in 2014. Viral disease
treatments see the fastest CAGR of 12.1%, increasing from nearly $45 billion
in 2009 to $79 billion in 2014, but a significant portion of this expenditure is
for treating the secondary bacterial infections (Infectious Disease Treatments
report 2010).
Figure 1.2 The global market for treatment of infectious diseases shows
an increase in economic burden due to viral and bacterial
infections from 2008 to 2014 (Adapted from Infectious Disease
Treatments: Global Markets BCC research market forecasting
2010)
Approximately 26% of annual deaths worldwide are caused by
emerging infectious diseases. The people in developing countries particularly
infants and children face a heavier burden of mortality and morbidity
associated with infectious diseases (diarrhoeal diseases and malaria alone is
estimated to cause about three million deaths each year) (Fauci 2001, Taylor
et al 2001). Developing countries like India suffer excessively from the triple
burden of infectious diseases: emergence of new pathogens, communicable
diseases and non-communicable diseases that are linked with lifestyle and
infrastructural changes (Quigley 2006).
8
Nearly half of India’s disease burden is due to communicable
diseases mainly because of improper sanitation, contaminated food, lack of
basic health services and inadequate personal hygiene (Ministry of Health,
Government of India 2005). Other demographical, environmental, and socio-
economic factors also put India at risk of severe epidemics of new infections.
An important take-home message for developing countries like India is to
work on prevention and control of bacterial infectious diseases than spending
huge amounts of money on treatment.
As can be seen, the common denominator in our inability to combat
these diseases is lack of field-deployable simple, inexpensive and high-
throughput methodologies that have to be addressed in future developments.
1.1.1 Nosocomial Infections, Complicating Factor in the Control
Despite a widespread awareness in both public health and hospital
care, nosocomial infections continue to develop. Factors like increased
medical procedures, decreased immunity among patients and invasive
techniques create potential routes of infection, transmission of drug-resistant
bacteria and ineffective control practices promote infection among hospital
populations (Meenakshi 2012). Sources of hospital acquired infections are
listed in Figure 1.3.
A survey on the prevalence of nosocomial infections were
conducted by World Health Organisation (WHO) in 55 hospitals in 14
countries representing 4 WHO Regions (Europe, Eastern Mediterranean,
South-East Asia and Western Pacific). It reported an average of 8.7% of
hospital patients with nosocomial infections. An estimation showed that over
1.4 million people suffer from hospital acquired complications worldwide
(Tikhomirov 1987, Ginawi et al 2014).
9
The highest frequencies of nosocomial infections were reported
from hospitals in the East Mediterranean (11.8%) and South-East Asia
Regions (10.0%), with a prevalence of 7.7% and 9.0% respectively in the
European and Western Pacific (Mayon et al 1988). The urinary tract
infections (UTI), infections of surgical wounds and lower respiratory tract
infections are the most frequent nosocomial infections. The WHO and other
studies have also reported that the highest prevalence of nosocomial
infections occurs in Intensive care units (ICUs) and in orthopaedic and acute
surgical wards. Infection rates are higher among patients undergoing
chemotherapy and increased susceptibility due to old age (Ginawi et al 2014).
Hospital-acquired infections lead to functional disability and
emotional stress to patients (Ian 2014, Ponce-de-Leon 1991). Different
bacteria, viruses, fungi and parasites may cause such infections and these
microorganisms are acquired by cross-infection from one person to another in
the hospital or by endogenous infection caused by the patient’s own flora.
Some organisms may be acquired from environment through substances
recently contaminated from another human source. Before the introduction of
antibiotics, and basic hygienic practices in hospital settings, most hospital
infections were due to microorganisms not present in the normal flora of the
patients and pathogens of external origin. (WHO: A practical guide 2002).
Progress in the antibiotic treatment of bacterial infections has considerably
reduced mortality from many infectious diseases.
Hospital acquired infections today are caused mostly by
microorganisms common in the general population (e.g. Enterobacteriaceae,
Enterococci, Proteus and Staphylococcus aureus). These organisms are
transmitted through discharged patients and visitors to the community (Ian
2014, Ponce-de-Leon 1991). In this regard, nosocomial infections need to be
taken seriously and diagnosed for proper treatment as they pose great danger
10
if ignored. Recently, Centers for Disease Control estimated that the burden
reflected by hospital-acquired bacterial infections on patients and the
healthcare system exceeded 30 billion dollars each year. These incidences
account for the significance in mortality and morbidity rates in ICUs and
more than 30% of the death rate after being hospitalized (Giske et al 2008).
Inspite of treatment, such nosocomial infections increase the medical cost up
to $156,000 for patients with hospital acquired infection staying longer than
uninfected patients.
Figure 1.3 Different sources that cause hospital acquired infections
(Adapted from Prevention of hospital-acquired Infections,
WHO report 2012)
1.1.2 Multidrug resistance is a Major Threat and Challenge
The major challenge in disease management is the resistance
developed by the pathogens for antibiotics. Multi-drug-resistance increases
the morbidity and mortality (Jyoti et al 2014). Emergence of such superbugs
is purely a huge man-made problem stemming out of the following factors:
11
1. Indiscriminate use of antibiotics
Unnecessary use of antibiotics, self-medication and non-
completion of the course as health improves lead to bacterial resistance and
ineffectiveness of antibiotics. Frequent use of antibiotics can harm vital
organs like liver and kidney and cause other serious side effects too.
2. Horizontal gene transfer and acquisition of MDR by pathogens
For the past few decades the spectrum and frequency of antibiotic-
resistant infections have increased. It is attributed to mutational changes and
acquisition of resistance-encoding genetic material transferred from other
bacteria. This is also related to the overuse of antibiotics in human health care
and in animal feeds, a combination of microbial characteristics, selective
pressure of antimicrobial use, social and technical changes that enhance the
transmission of resistant organisms. Hospitals play a major role in selection of
multi-drug-resistance organisms by their widespread use of antimicrobials in
the ICU and for immuno-compromised patients (Senka & Vladimir 2003).
Methicillin-resistant Staphylococci, Vancomycin resistant
Enterococci and extended-spectrum betalactamase (ESBL) producing gram
negative Bacilli are identified as major problem in nosocomial infections due
to horizontal gene transfer (Erika 2011).
3. Lack of new antibiotics
A WHO report states that the antibiotics pipeline is drying up while
resistance to existing drugs is increasing day-by-day. Two major reasons for
such a situation are non-development of new formula drugs and modifications
of existing ones leading to poor commercial returns as they are used only
during infections (Braine 2011).
12
Nosocomial infections acquired in hospital settings occur
worldwide and affect both resource-poor and developed countries. They are a
significant burden for both patient and public health and one among the major
causes of death leading to increased morbidity among hospitalized patients
(Saranraj and Stella 2001). Every year, organisms resistant to even most
potent antibiotics are identified, attracting great public concern worldwide.
Since the discovery of penicillin, antibiotics were considered the “magic
bullets” in curing infectious diseases. They have been misused and abused in
clinical treatment due to inappropriate prescription to patients through
misdiagnosis. Premature cessations of therapy not only fail to eradicate the
pathogens, but also trigger resistance in the surviving bacteria. Moreover,
antibiotics are sold without prescription over the counter especially in
developing countries. Another major factor that causes drug resistance is the
large-scale use of antibiotics in animal farming which are later consumed by
human and accumulated in food chain (Report by the IMS Institute for
Healthcare Informatics 2013).
Major clinical challenges in both humans and animals are the MDR
phenotypes. Consequently, microbes have developed cross resistance to a
series of functionally and structurally unrelated drugs. Most of the life
threatening pathogens for humans are zoonotic. In India the outbreak of H1N1
virus (swine flu) in 2009 killed more than 500 people and other zoonotic
diseases like plague, leptospirosis are often a threat to human lives. Zoonotic
diseases such as anthrax, Hepatitis E, Rabies are also very dangerous and
difficult to handle when it develops multi-drug-resistance (WHO 2014). Not
only underdeveloped or developing countries like India suffer from such out
breaks but so do developed countries. The ampicillin (Ap), streptomycin
(Sm), sulfamethoxazole (Su), tetracycline (Tc), and trimethoprim (Tp) (Ap–
Sm–Su–Tc–Tp) pattern is increasingly reported among MDR E. coli and S.
enterica strains isolated from food producing animals. The O104:H4 strain of
13
E. coli outbreak is well known for displaying resistance to an extended
spectrum of β–lactams. It was also resistant to (Ap–Sm–Su–Tc–Tp) making it
difficult to locate the genes responsible for encoding the resistance phenotype
(Steven et al 2013).
Antibiotic resistance was identified in a miniscule portion only in
Pseudomonas aeruginosa that have intrinsic and constitutive high drug
tolerance (Leclercq & Courvalin 1991, Hancock 1998). Strains have attained
elevated drug tolerance due to the usage of antibiotics which serve as an
environmental selective pressure. The horizontal transfer of genetic materials
enables the wide spread of resistance (Alonso et al 2001). The resistant genes
can be transferred either by cell-to-cell conjugation, phage-mediated
transduction or by naked DNA transformation. The prevalence of MDR
increases the mortality and morbidity of bacterial infection, making the
treatment more difficult (Ochman et al 2000). In 2010, Centre of Disease
Control (CDC) has reported that bacterial infection resulted in approximately
30,000 deaths each year in the United States (Aminov 2010). MDR strains
have been found towards all available antibiotics, presenting one of the
biggest threats to public health.
1.2 INADEQUACY OF CLASSICAL AND CURRENT
DIAGNOSTIC METHODS AND LACK OF SCREENING
AND SURVEILLANCE METHODS FOR PREVENTIVE
HEALTHCARE
The classical method of detecting and identifying bacteria is based
on culturing, enumeration and isolation of presumptive colonies for further
identification analysis. In some cases, the sample needs to be homogenized,
concentrated or pre-enriched prior to analysis. Bacterial cells can become
injured or viable-but-nonculturable (VNC) due to the sub-lethal stressors,
such as osmotic shock, acid, heat and cold which makes the analysis difficult
14
(Kell et al 1998). Biochemical tests depend on the unique biochemistry of
microbes. Classical biochemical tests like Indole, methyl red, Voges-
Proskauer and citrate (IMViC); Triple sugar iron test (TSI) are used routinely
in clinical practice. However, chromogenic and fluorogenic media are now
being developed by virtue of specific enzymes on the microbe converting the
given substrate to coloured or fluorescent products. These methods are both
tedious and time-consuming requiring a series of tests with the incubation of
the microorganisms for 2-3 days.
Another approach in wide use are the enzyme/substrate methods
like enzyme immunoassay (EIA) and enzyme-linked immunosorbent assay
(ELISA) based upon either chromogenic or fluorogenic substrate methods
(Siddhesh et al 2012). Antibody (Ab)-based techniques, which takes the
advantage of specific binding affinities of antibodies to specific antigens, can
either be developed in the laboratory or purchased commercially. The
antibodies can be specific for a single strain of bacteria, or can potentially be
produced for a single species (E. coli). Once antibodies are produced, their
specificity is tested for by mounting onto a support system like nylon
supports, polystyrene waveguides, cantilevers and glass slides (Valerie 2014).
Still all these techniques have their own disadvantages viz. development of
specific antibody, laboriousness, high cost instrumentation, and lacking
skilled personnel (Rachel & Stephen 2005).
The limitations of these methods have led to the research focusing
on development of rapid and accurate techniques to identify pathogens.
1.2.1 Limitations of Emerging Modern Methods
Microarray technique combines the potential of simultaneous
identification and speciation of bacteria. The rapid identification of bacteria in
clinical samples is important for patient management and antimicrobial
15
therapy (Georg et al 2004). In this method the bacterial samples are
discriminated on a single slide. For quick detection and identification of
bacteria using species-specific oligonucleotide probes designed for specific
regions of various targeted genes DNA-based microarray approach is
becoming popular. The high-throughput nature of microarray experiments
impose numerous limitations, which apply to simple issues such as sample
acquisition and data mining, to more controversial issues that relate to the
methods of biostatistical analysis required to analyze the enormous quantities
of data obtained (Abdullah et al 2006). The limiting step for
commercialisation and further development of microarrays is the complexity
and the time required to design and test discriminatory genetic regions that
separate one species from another. This lack of discriminatory information
also limits other molecular identification methods, including sequencing
(Dennise et al 2002).
Methods involving identification of surface proteins or whole-cell
or its genetic material are gaining interest now. These include immunoassay
techniques and molecule-specific probes, such as lipid or protein attachment-
based approaches. Because of the design of the immunoassay, sample
contaminants that might interfere with the antigen-antibody reaction can
produce false positive results. On the other hand, nucleic acid detection
methods target specific nucleic acid sequences of bacteria. These include
Polymerase Chain Reaction (PCR), Quantitative PCR (qPCR), Reverse
Transcriptase Polymerase Chain Reaction (RT-PCR), and Nucleic Acid
Sequence Based Amplification (NASBA). These methods identify specific
sequences from a complex mixture of DNA and therefore are useful for
determining the presence and quantity of pathogen-specific or other unique
sequences within a sample (Mark & Joyce 2005). qPCR facilitates a rapid
detection of low amounts of bacterial DNA accelerating therapeutic decisions
16
and enabling an earlier antibiotic treatment. Molecular recognition approaches
have the potential for being more rapid, more sensitive and adaptable to a
wider class of pathogens (Rachel & Stephen 2005). However, all these
techniques have a setback due to the following disadvantages listed in the
Table 1.2.
Table 1.2 Advantages and disadvantages of molecular methods used for
bacterial identification
Methods Advantages Disadvantages
PCR (Single)
Provides sensitive detection of
single gene or bacteria
PCR conditions must be
optimized.
Multiplex PCR
Reduces cost and allows rapid
detection of multiple bacteria
Primer design is critical
and primers may interfere
with each other leaving
some genes and bacteria
undetected.
Real-time PCR
Shortens detection time,
detects and quantifies bacteria,
high sensitivity, specificity
and reproducibility
Requires expensive
equipment, reagents and
operations by skilled
technicians.
Reverse-
transcriptional
PCR
Can detect only viable cells of
pathogens
Skill required to handle
unstable RNA for
pathogen detection
Nested PCR
Has improved sensitivity and
specificity than conventional
PCR
Greater expense than
regular PCR as twice as
much enzyme and reagents
are used
DNA sequencing
Has high discriminatory
power and reproducibility
Complex method, time
consuming and relatively
expensive
(Adapted from Frederick et al 2013)
17
1.3 NEED FOR NEW APPROACHES TO DEVELOP NEXT
GENERATION TOOL WITH MODERN KNOWLEDGE
Despite the advances in technology and medicine, infectious
diseases remain a major cause of death and socioeconomic disruption for
millions of people. Many bacteria are responsible for causing infectious
diseases in animals and humans. Among these, bacteria like E. coli (UPEC),
Shigella and Salmonella are common. Bacteria like Proteus spp. and
Pseudomonas are associated with hospital-acquired infections and these are
also multi-drug-resistant. Obviously these are quite dangerous and there is an
increasing demand to keep them away from communities. Existing protocols
for field detection and identification of such bacteria are unavailable or
ineffective for surveillance. Hence it is imperative to develop next generation
tool with modern knowledge.
1.3.1 Intra and Extracellular Targets for Non-Invasive and
Non-Destructive Detection Methods
Biomarkers are critically important tools for detection, prognosis,
treatment and monitoring (Pothur et al 2002). Biomarkers are biological
molecules that are indicators of physiological state and also of change during
a disease process (Pradeep et al 2011). The value of a biomarker lies in its
ability to provide an early indication of the disease and to monitor disease
progression (Judith et al 2007).
Recent studies have accumulated scientific evidences suggesting
that certain surface-associated and extracellular components produced by
bacteria can be used as biomarkers assisting in their identification. These
bacterial components would be able to directly interact with the host cells
including bacteriocins, exopolysaccharides, surface-associated and
extracellular proteins. Extracellular proteins include proteins that are actively
18
transported to the bacterial surroundings through the cytoplasmic membrane,
as well as those that are simply shed from the bacterial surface. Compared to
other bacterial components, the interactive ability of extracellular proteins has
been less extensively studied (Borja et al 2010).
Bacterial Volatile Organic Compounds (BVOCs) have been
considered as sensitive and specific biomarkers for bacterial detection in
human samples and culture media. The possibility of using VOC markers as
one of the largest groups of bacterial metabolites would open a new frontier
for developing more efficient techniques in the diagnosis of bacterial
infections (Mohsen et al 2014). Table1.3 provides the list of common diseases
and/or infections with their characteristic odours.
Table 1.3 Diseases and their odours
S.No Disease Odour Source
1. Anaerobic infection Rotten apples Skin / sweat
2. Bacterial vaginosis Amine-like Vaginal discharge
3. Bacterial infection Foul Sputum
4. Bladder infection Ammoniacal Urine
5. Cystic fibrosis Foul Infant stool
6. Diabetes mellitus Acetone-like Breath
7. Diphtheria Sweet Sweat
8. Phenylketonuria Musty / horsey Infant skin
9. Pseudomonas infection Grape Skin / sweat
10. Rotavirus gastroenteritis Foul Stool
11. Tuberculosis Stale beer Skin
12. Typhoid Baked brown bread Skin
(Adapted from Pavlou & Turner 2000)
19
1.3.2 Volatile Organic Compounds (VOCs) as Extracellular Targets
Volatile Organic Compounds (VOCs) play an important role in
structuring and characterizing life. These kinds of compounds are produced
by animals, bacteria, humans and plants and also provide diverse functions in
both natural and artificial systems. The volatility of VOCs in the environment
gives them unique characteristics making studies of such compounds
challenging (Chidananda et al 2015). The production of volatiles has been
recognized since millennia and has been exploited as aroma or flavour
components in the production of cheese, wine and other fermenting food.
Repellent odours from rotting material are produced by bacteria, indicating a
chemical communication between different species (Stefan & Jeroen 2007).
VOCs have relative molecular masses ranging between 30 and 300
g/mole and heavier molecules are not considered VOCs because they
generally have a vapour pressure that is too low at room temperature (Alphus
& Manuela 2009). Molecules with one or two polar functional groups are the
most volatile ones than those with more functional groups. Non-polar
molecules are generally more volatile than polar ones as the volatility is
determined by their molecular weight and their intermolecular interaction.
(Sichu 2009). Hence, a compound with a low molecular weight, a carbon
backbone, a high vapour pressure, (greater than 0.27 KPa) and a boiling point
between 50-260 ºC existing as gas under standard temperature and pressure
are classified as VOCs (Turner et al 2006).
Bacterial Volatile Organic Compounds (BVOCs) are produced
from the primary and secondary metabolism of the organisms. The BVOCs
are produced as a by-product of primary metabolism involving the breakdown
of food in the environment to extract nutrients needed for the maintenance of
cell structures. However, the BVOCs are produced by the microbes due to the
20
environmental stress during growth through secondary metabolism
(Kai et al 2009, Hughes & Sperandio 2008).
Information on bacterial BVOCs produced through its primary and
secondary metabolisms are limited though there are many reports on VOCs
released. Bacteria release a number of characteristic VOCs like aldehydes
(benzaldehyde, acetaldehyde, formaldehyde, 2-methylbutanal,
3- methylbutanal, Decanal), ketones (2- tridecanone, 2-heptanone,
2-nonanone, Acetophenone, 2-undecanone, acetone), alcohols
(2-pentadecanol, propanol, 1-decanol, ethanol, 1-butanol, 1-pentanol), acids
(Crotonic acid, phenyl acetic acid) and compounds like hydrogen sulphide,
methyl mercaptan, dimethyl sulphide, ethyl butanoate, isoprene, trimethyl
amine, n-propyl acetate, dimethyl disulphide, ammonia, trimethyl amine as
chemical messengers or secondary metabolites, (Lieuwe et al 2013) under
defined growth conditions. These are attractive targets for developing into
non-invasive diagnostic markers. In ancient times, physicians relied heavily
on their senses to diagnose the infections before sophisticated analytical
techniques were available. Colour, smell and taste were used to detect
biological markers. VOCs are one such metabolite released from
microorganisms as protection against antagonists or as signalling molecules
that can be exploited for their specific detection (Nicholson & Lindon 2008).
Different pathogens possess similar VOCs and therefore, the
volatile profiles under defined growth conditions should be compared in order
to identify the unique compound serving as an effective tool for identification.
Hence, an alternate method for identifying pathogenic bacteria can be based
on such characteristic metabolites generated by these organisms using specific
biochemical pathways.
21
1.4 CURRENT METHODS FOR DETECTION OF VOLATILE
ORGANIC COMPOUNDS (VOCs)
Volatile organic compounds are currently detected using a variety
of methods including colorimetric sensor array, using fluorescent reagents,
Gas Chromatography and Mass Spectroscopy (GC-MS), biosensors and E-
nose. The description of each method is given below.
1.4.1 Colorimetric Sensor Array
The colorimetric sensor array represents a new approach to array-
based chemical sensing (Michael et al 2006). Such approach has emerged as a
potential tool for the detection of chemically diverse analytes. Similar to the
mammalian olfactory system, these arrays produce composite responses
unique to an odourant based on cross-responsive sensor elements. In such
sensor design architecture, one receptor responds to many analytes and many
receptors respond to any given analyte (Christopher et al 2010). A distinct
pattern of responses produced by the array provides the possibility of a
characteristic fingerprint for each analyte. The different indicators that are
available for detection on the array are shown in the Figure 1.4.
Based on a broad range of chemical-sensing interactions, rather
than on weak nonspecific van der Waals forces, the disposable array exhibits
both excellent sensitivity and selectivity to a broad range of organic
compounds. The array is well-suited for the detection of biogenically
important analytes such as acids, amines and thiols. The arrays are basically
nonresponsive to changes in humidity, which avoids the problem of
interference due to changes in humidity during environmental sample
analyses (Chen Zhang & Suslick 2005).
22
Figure 1.4 Colorimetric sensor array using metalloporphyrins, metal
nanoparticles and acid-base indicators showing different
coloured spots when reacted with VOC (Adapted from Sung
2009).
1.4.2 Fluorescent Method for VOC Detection
New technologies are being developed using conjunction of high-
sensitivity fluorescence based detection to reduce the time required for the
assay (Bhaskara et al 2012). Fluorescence-based assays are widely used in
high-throughput screening due to their ease of operation, diverse selection of
fluorophores, high sensitivity and various display readout modes. As a result,
fluorescence-based assays have been applied to monitor a broad range of
activities in life-science research such as air analyses, distribution of
molecules, organelles or cells, enzymatic activities, molecular dynamics and
interactions, and signal transduction (Frank 2008). Detection is achieved
through fluorophore-tagged growth substrates included in the media that are
added to samples. Upon growth, specific bacterial enzymatic activity cleaves
the fluorophore from the substrates, causing fluorescence or increase in
fluorescence. This fluorescence can then be detected by a number of
23
instruments. It is a simple assay that is economical and time saving (Rachel &
Stephen 2005). Both colorimetric or fluorimetric method provides cost
effective, non-invasive and high throughput diagnostic assays.
1.4.3 Gas Chromatography and Mass Spectroscopy (GC-MS)
Traditional analytical methods for VOC detection usually combines
Gas Chromatography (GC) coupled most often with Mass Spectrometry
(GC-MS) or a certain detection approach such as flame ionization detection
(GC/FID), photoionization (GC/PID) (Petr 1984) and Electron Ionisation
mode (EI). Sometimes other approaches such as membrane-inlet mass
spectrometry or isolation followed by NMR spectroscopy are used (Thorn
et al 2011). Though several general mass spectral libraries such as the Wiley
and the NIST are available, more specialized, critically evaluated libraries are
sometimes more useful for volatile compounds. These libraries are of
immense use, as the closest hit within the library might uncritically be taken
as positive identification. The inclusion of additional data, especially gas
chromatographic retention indices, is critical for structure elucidation.
GC/MS has excellent detection sensitivity and specificity, and are
thus the best suited for VOC trace detection and identification but real-time
direct detection could pose a challenge (Sichu 2014). Even though GC-MS
analyses have enabled comprehensive studies, these tools have not emerged
as routine instruments for clinical diagnosis due to high operating costs,
laborious and time-consuming sample-preparation methods and requirements
for significant training and expertise for effective operation and data
interpretation. The limited applicability of traditional methods and analytical
instruments in clinical diagnoses has prompted the need to develop simpler,
cheaper, non-invasive and more user-friendly diagnostic assays for routine
clinical applications. Major techniques recently involved in VOCs based
24
detection of infectious diseases their advantages and disadvantages are given
in the Table 1.4.
Table 1.4 Advantages and disadvantages of some of the methods
currently used for VOC analysis in clinical aspect
Method Advantage Disadvantage
Gas chromatography
with mass
spectroscopy
1. Identification of
unknown VOCs and
profiling possible
2. Sensitivity in the ppb
range
3. Reproducible
1. Cannot detect non‐
volatile, polar and
thermally labile
compounds
2. Requires lengthy sample
preparation (hydrolysis/
derivatization)
Ion mobility
spectrometry
(IMS)
1. No pre-concentration
needed
2. Sensitivity in the ppm
range
3. Mobile system
4. Low cost
5. Suitable for clinical use
1. Low resolving power,
2. Lack of positive
identification
3. Instability of response
(due to humidity and
other matrix
interferences)
4. The sensitivity of the
IMS is reduced due to
the low pressure
operation of the
ionization region and
drift tube.
5. Real-time measurements
not Possible
Selected ion flow tube
mass spectrometry
1. Measures VOCs in real
time
2. Potential for online
testing
3. VOC measurement in
headspace (serum/urine)
4. Sensitivity in the ppb
range
VOC chemical identification
and profiling not possible
Uses carrier gas, less
sensitive than PTR-MS
25
Table 1.4 (Continued)
Method Advantage Disadvantage
Proton transfer
spectrometry
1. No pre-concentration
needed
2. Real-time measurements
and online monitoring
3. Sensitivity in the ppb
range
Large and costly instrument
mass interferences, library of
compounds still to be created.
Various chemical
sensor matrix
platforms/e-noses
1. Easy to use
2. Portable
3. Sensitivity in the ppb
range
May need chemometric
processing, suffers from
cross-sensitivities
(Adapted from Shneh et al 2013)
1.4.4 Biosensors
A variety of chemical sensors, including biosensors and E-noses
have demonstrated the feasibility of VOC detection. Chemical sensors detect
odour molecules based on the reaction between the odour molecules and the
target sensing materials on the sensor surface. This reaction triggers a certain
change in mass, volume or other physical properties which is then converted
to an electronic signal by a transducer. There are different types of
transducers for chemical sensors like optical, electrochemical, heat-sensitive
and mass-sensitive. The most common chemical sensors includes surface
acoustic wave sensor, quartz crystal microbalance sensor, metal oxide
semiconductor sensor, and polymer composite-based sensor biosensors. They
are currently drawing interest as it comes with reliable results in much shorter
detection time (Vijayata et al 2014).
26
1.4.5 E-nose
E-noses have drawn much attention since it is the most promising
approach so far for high sensitivity and mimicking the biological nose
respectively for sensing. The electronic-nose detects volatile compounds with
an array of semi-conducting polymer sensors that enables the user to map
aroma pattern in a graphical or digital format. It comprises of an array of
chemical sensors with different selectivity, a signal-preprocessing unit and a
pattern recognition system. The interaction between volatile organic
compounds with an array of sensors generates a characteristic fingerprint
which can be recognized by comparing it with previously recorded patterns in
the recognition system (Simeng et al 2013).
Electronic noses can be used for detecting bacterial pathogens,
either in vitro or in vivo, or as a potential tool for the identification of patients
with diseases. They employ conductivity sensors like Metal oxide
semiconductors (MOS), Intrinsically conductive polymer chemiresistors
(ICP) and Conductive Polymer composite chemiresistors (CP); Electrostatic
Potential sensors like Metal oxide semiconductor field effect transistors
(MOSFET) and Gas Sensitive Field Effect Transistor sensors (GASFET);
Acoustic Resonance Sensors like Thickness-shear mode / Quartz Crystal
Microbalance / Bulk Acoustic Wave (TSM / QCM / BAW) and Surface
Acoustic Wave (SAW) and Optical Vapour sensors like Polymer-deposited
Optical sensors (DPO) and self-encoded bead (SEB) (Simeng et al 2013).
Though biosensors/ E-nose can process in a single run, the chance
of capturing and identifying a small amount of pathogens present in samples
is difficult (Andre et al 2002). Different sampling methods have been used for
the volatile compound detection in order to distinguish between normal and
infected specimens and their detectable range (Ida et al 2006). The rapid
screening of biological samples could allow faster and appropriate therapeutic
27
treatment and would lead to decrease in mortality rate over classical
cultivation and isolation methods. However, there is still much work to do
before biosensors become a real alternative for pathogen detection (Olivier
et al 2007).
A recent review states that studies on VOC based identification of
infectious diseases are limited when compared to other identification
methods. The major sources for detection of VOCs related to infections are
the respiratory tract, gastrointestinal tract, urinary tract and nasal cavity. The
upcoming analytical technologies for detection and measurement of volatile
organic compounds (VOCs) had shown advantages in clinical applications.
Hence, the interest for their use in evaluating the diagnostic potential of
VOCs for different diseases has increased. VOCs as specific biomarkers in
clinical samples open up a new direction for developing rapid and potentially
inexpensive disease screening tools. Most of the studies on volatile
biomarkers have been carried out on exhaled-breath samples, although other
clinical matrices, such as urine and faeces, have also been investigated
(Kamila & Ian 2015).
1.5 REGULATION OF VOLATILE ORGANIC COMPOUND
METABOLISM
Bacteria and fungi are capable of producing a wide variety of
biochemical compounds via primary and secondary metabolism. During
primary metabolism, the organism breaks down food in the environment to
extract nutrients needed for the maintenance of cell structures and, in the
process, creates VOC's as by-products (Karen & Santo-Pietro 2006). In
secondary metabolism, there is a competition for resources in a nutrient-poor
environment thereby driving the production of VOC. Although the distinction
between primary and secondary metabolism is not absolute, the secondary
metabolism is known to start after active growth has ceased. Secondary
28
metabolites have diverse chemical structures and are distinct products of
particular groups of organisms and sometimes even strains (Vining 1990).
The function of secondary metabolites in the organism is not clear, but the
process seems to have different purposes owing to their remarkable variety
and many different chemical structures (Bentley & Bennett 1988).
Volatile aldehydes have been found to be produced by a variety of
microorganisms. Acetaldehyde is formed through oxidative carboxylation of
acetolactate, a by-product of the synthesis of leucine in yeasts (Berry 1988).
Unsaturated fatty acids may be transformed to volatile aldehydes such as
hexanal, heptanal and nonanal, and the precursors of 2-decenal, 2 undecenal
and 2-heptenal are linoleic and linolenic acid (Korpi 2001). In certain studies
investigating the emission of VOCs during microbial growth showed that the
concentration of aldehydes decreased as though the microorganisms had
consumed the aldehydes. The growth of microorganisms generates volatile
metabolites, but the lack of knowledge about metabolic routes makes it
generally unclear whether all compounds found in relation to microbial
growth really are a metabolic product or whether microbial growth or
moisture promote(s) emission of compounds from a substrate (Ezeonu et al
1994).
Amino acid, such as alanine, valine, leucine, isoleucine,
phenylalanine and aspartic acid, are also involved in aroma biosynthesis as
direct precursors, and their metabolism is responsible for the production of a
broad number of compounds, including acids, carbonyls, alcohols and esters.
The information available to date on the biosynthesis of amino acid-derived
volatiles is based on precursor feeding experiments with radio-labelled,
stable-isotope-labeled, or unlabeled precursors (Muna et al 2013).
Amino acids can undergo an initial deamination or transamination
leading to the formation of the corresponding molecules alpha-keto acid.
29
Subsequent decarboxylation followed by reductions, oxidations or
esterifications give rise to aldehydes, acids, alcohols and esters (Reineccius
2006). A general pathway is shown schematically in Figure 1.5. Branched
chain volatile alcohols, aldehydes and esters arise from the branched chain
amino acids leucine, isoleucine and valine. The general scheme of
biosynthesis is thought to proceed in a similar way as that in bacteria or yeast,
where these pathways have been more extensively studied (Beck et al 2002,
Tavaria et al 2002).
Figure 1.5 Representative VOC metabolic pathway involving amino
acids
From the wide range of reported VOCs, a number of aldehydes and
ketones were found to be predomina3.5
ntly produced by bacteria. Besides hydrazines, a multitude of different groups
of derivatizing agents has been established for the analysis of carbonyl
compounds. All of these comprise of a condensation reaction of the reagent
with the analyte under formation of a colored and/or fluorescent derivative.
30
Therefore, detection may be performed by photometry or fluorescence
spectroscopy (Martin et al 2000).
Though reports suggest a variety of dyes like
2,4-dinitrophenylhydrazine (DNPH), 1-Dimethylaminonaphthalene-
5-sulfonylhydrazide (Dansyl hydrazine, DNSH), nitroaromatic hydrazines,
2-diphenylacetyl-1, 3-indandione-1-hydrazone (DAIH), 4-nitrophenylhydrazine
(pNPH), 1-methyl-1-(2,4-dinitrophenyl)hydrazine (MDNPH),
Nitrobenzooxadiazole (NBD derivatives), a Dimethylaminosulfonyl group
(DBD) or an aminosulfonyl (ABD) group, 2,4,6-trichlorophenylhydrazine
(TCPH), Pentafluorophenylhydrazine (PFPH) and halogenated phenyl
hydrazine reagents specific for carbonyl compound, DNSH has been found to
be best suited owing to its lower level detection in atmospheric samples
(Laurent et al 2004).
The importance of derivatizing agents for the analysis of aldehydes
and ketones becomes apparent from the literature search for respective
analytical developments and applications. The chemical abstract database
which covers literature from 1967 until today, lists more than 1500 articles
which focus on derivatization techniques for the analysis of carbonyl
compounds (Jan & Ki-Hyun 2015) Therefore, release of a number of carbonyl
compounds as specific VOCs by bacteria and availability of a variety of
reagents for their detection prompted us to focus on carbonyl compounds as
specific biomarker in this study.
1.6 RATIONAL DESIGN OF MEDIA FOR ENHANCED
VOLATILE ORGANIC COMPOUND PRODUCTION
The biosynthesis of VOCs depends on the availability of carbon,
nitrogen and sulfur as well as energy provided by primary metabolism.
Therefore, the availability of these building blocks has a major impact on the
31
concentration of any secondary metabolite, including VOCs, demonstrating
the high degree of connectivity between primary and secondary metabolism.
Biosynthesis of the wide array of different VOCs branches off from only a
few primary metabolic pathways. Based on their biosynthetic origin, all
VOCs are divided into several classes, including fatty acid derivatives and
amino acid derivatives in addition to a few species-/genus-specific
compounds not represented in those major classes (Stefan & Jeroen 2007).
The medium composition has a great influence on both qualitative
and quantitative production of volatile metabolites. In general, nutrient-rich
media promote larger quantities of VOC than nutrient-poor media. The
emission of VOC changes with the growth phase of the bacterial culture
(Malik 1979). Additionally many factors affect volatile composition,
including the genetic makeup, degree of maturity, environmental conditions
such as pH of the medium, levels of CO2 or O2, moisture and temperature
(Maria et al 2013). There are several pathways involved in volatile
biosynthesis starting from lipids and amino acids. Once the basic skeletons
are produced via these pathways, the diversity of volatiles are achieved via
additional modification reactions such as acylation, methylation,
oxidation/reduction and cyclic ring closure (John et al 2007). Thus, the
medium composition / growth conditions can be manipulated in order to
achieve an enhanced VOC release.
1.7 PROTEUS AS A MODEL STUDY ORGANISM
In this work we have chosen Proteus, a notorious nosocomial
pathogen as a model organism and have identified its VOC biomarker. The
general introduction about the organism and its pathogenicity are described in
detail.
32
1.7.1 Proteus –General Introduction
Kingdom : Bacteria
Phylum : Proteobacteria
Class : Gamma proteobacteria
Order : Enterobacteriales
Family : Enterobacteriaceae
Genus : Proteus
Species : P. mirabilis and P. vulgaris
Proteus species are Gram-negative, facultatively anaerobic, rod
shaped bacterium. It shows swarming motility, and urease activity. Proteus
organisms are implicated as serious reason of infections in humans, along
with Escherichia coli, Klebsiella, Enterobacter and Serratia species. Some of
the species of Proteus causing urological diseases are P. mirabilis, P. rettgeri,
P. vulgaris, P. norganii, P. penneri, P. hauseri and P. myxofaciens. However,
P.mirabilis and P.vulgaris are more prevalent than other species. Proteus
species are found in multiple environmental habitats including human
intestinal tract as part of normal human intestinal flora and long term care
facilities. In hospital settings, it is not unusual for gram-negative bacillus to
colonize both the skin and oral mucosa of both patients and hospital
personnel. P. mirabilis causes 90% of all 'Proteus' infections in humans and
also can be considered a community-acquired infection (http://emedicine.
medscape.com/article/226434-overview).
Proteus vulgaris and Proteus penneri are isolated from individuals
in long-term care facilities hospitals and from patients with underlying
diseases or compromised immune systems. Patients with recurrent infections,
with structural abnormalities of the urinary tract, those who have had urethral
instrumentation, and those whose infections were acquired in the hospital
have an increased frequency of infection caused by Proteus (Guentzel 1996).
33
Proteus species undergoes dramatic morphological changes, from a
single rod-shaped swimmer cell to an elongated multicellular swarmer cell, in
response to growth on solid surfaces (Holt et al 1994).Most strains produce a
powerful urease enzyme, which rapidly hydrolyzes urea to ammonia and
carbon dioxide (Ryan et al 2004, Rauprich et al 1996, Matsuyama et al 2000).
Urea → 2NH3+ CO2
Proteus species are the causative agent of a variety of opportunistic
nosocomial infections including those of the respiratory tract, eye, ear, nose,
skin, burns, throat, and wounds; it also may cause gastroenteritis. Proteus
mirabilis causes serious kidney infections which can involve invasion of host
urothelial cells. Reports suggest prevalence of 17% for P. mirabilis and 5%
for P. vulgaris in the faeces of healthy persons. Urinary pathogens are thought
to originate mainly from the gut and it is interesting that P. mirabilis is
disproportionately more frequently isolated from patients with urinary-tract
infections than P. vulgaris (Krikler 1953).
1.7.2 Pathogenesis and Diseases Caused by Proteus
Infection depends on the interaction between the infecting organism
and the host defense mechanisms. Various components of the membrane
interplay with the host to determine virulence. Proteus species in addition, to
the outer membrane contains a lipid bilayer, lipoproteins, polysaccharides and
lipopolysaccharides. The first step in the infectious process is adherence of
the microbe to the host tissue. Fimbriae facilitate adherence and thus enhance
the capacity of the organism to produce disease. P. mirabilis like E. coli, and
other gram-negative bacteria contain pili, which are tiny projections on the
surface of the bacterium. Specific chemicals located on the tips of pili enable
organisms to attach to selected host tissue sites (eg. urinary tract
endothelium). The virulence factors produced by P. mirabilis are shown in
34
Figure 1.6. The adhesion of Proteus species to uroepithelial cells initiates
several events in the mucosal endothelial cells, including secretion of
interleukin 6 and interleukin 8. Proteus organisms also induce epithelial cell
desquamation (Christopher et al 2000).
Figure 1.6 A schematic diagram showing proteins produced by
P. mirabilis that are known or hypothesized to be virulence
factors important in urinary tract infections (Adapted from
Christopher et al 2000)
Urease production, together with the presence of bacterial motility
and fimbriae, may favor the production of upper urinary tract infections.
When the pathogen enters the bloodstream, endotoxin, a component of gram-
negative bacteria cell walls, apparently triggers a cascade of host
inflammatory responses and leads to major detrimental effects. Thus the
factors for pathogenesis include adherence to host mucosal surfaces, damage
and invasion of host tissues, evasion of host immune systems, and iron
acquisition. The ability of Proteus organisms to produce urease and to
alkalinize the urine by hydrolyzing urea to ammonia makes it effective in
producing an environment in which it can survive. The activity of a urease
enzyme, causes polyvalent cations, such as Mg2+
and Ca2+
, to precipitate out of
the urine and form struvite and carbonate hydroxyapatite crystals
(Griffith et al 1976). The mineral structures also provide bacteria a habitat to
hide from antibiotic treatment and the host immune cells (Li et al 2002).
35
An infection occurs when microorganisms, usually bacteria, from
the digestive tract, cling to the opening of the urethra and begin to multiply.
An infection limited to the urethra is called urethritis. From there, bacteria
often move on to the bladder, causing a bladder infection called cystitis. If the
infection is not treated promptly, bacteria may then go up the ureters to infect
the kidneys (Mobley 1987). This infection is called pyelonephritis
shown in Figure 1.7. Presumably, males are less prone to ascending UTIs than
females because of their longer urethrae. Since the urinary tract is open to the
external environment, it is easy for pathogens to gain entry and establish
infection. Due to the production of urease by this organism, infection with
P.mirabilis not only develops into cystitis and acute pyelonephritis but also
causes stone formation in the bladder and kidneys. Urolithiasis is a hallmark
of infection with this organism (Griffith 1976).
Figure 1.7 A schematic diagram of the urinary tract showing urethra,
bladder, ureters & kidneys and the indicating (red spots)
are the diseases that are associated with Proteus. The
virulence factors listed under each infection contribute to
their pathogenicity (Adapted from Caroline et al 2000).
36
1.7.3 Proteus as a Nosocomial Organism
Proteus mirabilis is the second most common cause of urinary tract
infection and is also an important cause of nosocomial infections. Bacteriuria
occurs in 10% -15% of hospitalized patients with indwelling catheters. The
risk of infection is 3% -5% per day of catheterization. In contrast, individuals
with multiple prior infections of UTI, multiple antibiotic treatments, urinary
tract obstruction, or infection developing after instrumentation frequently
become infected with Proteus bacteria. Proteus mirabilis is susceptible to
nearly all antimicrobials except tetracycline. It is sensitive to ampicillin,
broad-spectrum penicillins such as ticarcillin, piperacillin, first-, second-, and
third generation cephalosporins, imipenem and aztreonam; Proteus vulgaris
and Proteus penneri are sensitive to trimethoprim and sulfamethoxazole,
quinolone, imipenem and fourth generation cephalosporins. P. mirabilis, is
believed to be the most common cause of infection-related kidney stones, one
of the most serious complications of unresolved or recurrent bacteriuria
(Ali et al 1998).
Multi-drug-resistance strains of P. mirabilis generally produce
extended-spectrum lactamasesor the AmpC type cephalosporinase and rarely
carbapenemases and their prevalence in some settings is relatively high.
Proteus species were found to have high antimicrobial resistance against
tetracycline, chloramphenicol. It is susceptible to some antibiotics like
chloramphenicol, vancomycin, and amoxicillin (Gus & Michael 2014).
However, regular drug administration to these strains increases the multi-drug
resistance property.
Coliforms and Proteus species rarely cause extra-intestinal disease
unless host defenses are compromised. Disruption of the normal intestinal
flora by antibiotic therapy may allow resistant nosocomial strains to colonize
or overgrow. Nosocomial strains progressively colonize the intestine and
37
pharynx with increasing length of hospital stay, resulting in an increased risk
of infection. These infections are often difficult to treat because of high levels
of antibiotic resistance among bacteria in the hospital environment. The
bacteria responsible for many common outpatient infections have also
developed resistant strains, which are creating new obstacles to effective
treatment (Butler et al 2001).
Prevention of infections, particularly those that are hospital
acquired, is difficult and perhaps impossible. Sewage treatment, water
purification, proper hygiene, and other control methods for enteric pathogens
will reduce the incidence of such enteropathogens. However, these control
measures are rarely available in less developed regions of the world. Doctors,
staff and other workers in hospitals can do much to reduce nosocomial
infections through identification and control of predisposing factors,
education and training of hospital personnel, and limited microbial
surveillance (Emily & Trish 2011).
Since field deployable rapid detection methods are not available for
Proteus, developing effective non-invasive detection method using Volatile
Organic Compounds (VOC) released by them has been conceived for next
generation diagnostics and surveillance. We have developed a technique that
has tremendous potential in non-invasive diagnosis and remote identification.
1.8 OVERVIEW OF THE THESIS
The analysis of Volatile Organic Compounds (VOCs) in biological
specimens has attracted a considerable amount of clinical interest over the
past two decades. It is well known that a number of infectious or metabolic
diseases could liberate specific odour characteristics of the disease stage,
which can be noticeable in the sweat, breath, urine or the stools (Bekir 2004).
38
Any disorder in the normal function of the body results in the liberation of
complex volatile mixtures through the same media.
Urinary Tract Infection (UTI), a disease which is dangerous and
unrecognized forerunner of kidney disorders is addressed in this thesis. The
potential of diagnostic power of VOC is not much prominent because the
odour that is emanating from pathogenic bacteria may be tough to be detected
and discriminated. The forthcoming chapters analyses the conventional
techniques available for identification of bacteria by volatiles. It provides a
potentially non-invasive means of diagnosis and monitoring of pathological
processes through simple fluorescent assay named ProteAl.
The first chapter of the thesis deals with the basic information on
infectious diseases their mortality rate and the availability of conventional and
modern methods for their identification. The chapter then elaborates on the
use of extracellular target (VOC) for bacterial identification, the current
analytical methods available, their limitations and alternate methods that can
be employed. The next aspect of the chapter focuses on the metabolic
pathways that are well established in bacteria for the production of various
VOCs. The last aspect of the chapter describes why Proteus, has been taken
as case study in this thesis.
The methodology and the resources used in the study in order to
execute the objectives are dealt in the second chapter. The study in general
employed the common biochemical, microbiological and molecular biology
reagents, solvents and techniques. The details of all the analytical instruments
involved are also described. A few methods that were slightly modified for
specific application are also elaborated in this chapter.
The results obtained from the experiments carried out in the study
are described in the third chapter. The first section of this chapter provides the
39
results pertaining to the literature survey done to catalogue characteristic
bacterial VOCs, extraction of VOCs from Proteus. The second section
explains the results obtained from GC-MS, FT-IR analyses. The third section
describes the development of colorimetric and fluorimetric assays for
bacterial volatile aldehyde detection. The final section deals with the
identification of metabolic pathway for 2-methylbutanal production in
Proteus. The enhancement of 2-methylbutanal production by manipulating
the growth medium with an amino acid isoleucine is revealed in this section.
The variation in gene expression due to isoleucine supplementation is also
focused in this chapter.
The fourth chapter discusses the important findings of this study
relating it to the existing methods. The first section explains the need for new
thoughts for developing diagnostic assays, the significance of the method
developed and their need. The next section elaborates on the 2-methylbutanal
pathway and the significance of the supplemented media. The last section
explains how the current findings are novel and its applications. The future
scope of the study is explained with a conceptual diagram in the final section
of this chapter.
1.9 OBJECTIVES
The emergence and necessity for constant surveillance of UTI
pathogens prompted us to develop an appropriate non-invasive
instrumentation methodology. Since nondestructive and remote identifications
are preferred for early diagnostics and surveillance, identification of such
volatile compounds offered a promising approach. Considering the current
clinical/diagnostic requirement the following objectives have been framed:
 Investigation of characteristic Volatile Organic Compound of
various organisms under defined growth conditions.
40
 Characterization and elucidation of structure of the
characteristic VOC of Proteus species using instrumental
analysis.
 Development of simple non-invasive, non-destructive and
most sensitive assay for the detection of the specific VOC of
Proteus.
 Validation of the developed assay using known clinical
isolates and environmental samples.
 Metabolic study using molecular biology tools to understand
specific VOC biosynthesis and its regulation for hyper
production.
 Rational design of growth media for enhanced VOC
production in order to improve the sensitivity.
41
CHAPTER 2
MATERIALS AND METHODS
2.1 MATERIALS USED IN THIS STUDY
The Table 2.1 and 2.2 gives the details of various chemicals,
buffers and primer sequences used in our study.
2.1.1 Chemicals Used
The chemicals such as organic, inorganic, acids, indicators,
reagents etc. used in the study are tabulated below.
Table 2.1 List of reagents, dyes and kits
S. No. Chemicals Suppliers
1. Acids
Acetic acid SRL, India
Boric acid Merck
Butyric acid Merck
Hydrochloric acid SRL India
Phosphoric acid Merck
Propionic acid Merck
2. Alcohols
Butanol Merck
Ethanol Hayman, UK
Methanol SRL India
42
Table 2.1 (Continued)
S. No. Chemicals Suppliers
3. Aldehydes
Benzaldehyde Alfa Aesar
Decanal Alfa Aesar
Hexanal Alfa Aesar
Nonanal Alfa Aesar
2-methylbutanal Spectrochem
4. Amino acids
Isoleucine Himedia
Leucine Himedia
DL-Phenylalanine Himedia
Valine Himedia
5. Enzymes
DNase New England Biolabs
Proteinase K Sigma-Aldrich
Taq DNA Polymerase New England Biolabs
6. Growth medium
Agar Himedia
Casein acid hydrolysate Himedia
Casein enzyme hydrolysate (Tryptone) Himedia
Cetrimide Agar Himedia
Eosin Methylene Blue Agar Himedia
Methyl Red and Voges Proskauer agar Himedia
Nutrient broth Himedia
Salmonella Shigella Agar Himedia
Simmons’ Citrate Agar Himedia
Triple sugar iron agar Himedia
Tryptone soya broth Himedia
Urease broth Himedia
Yeast extract Himedia
43
Table 2.1 (Continued)
S. No. Chemicals Suppliers
7. Ketones
Acetophenone Alfa Aesar
2-heptonone Alfa Aesar
2-nonanone Alfa Aesar
2-pentanone Alfa Aesar
2-tridecanone Alfa Aesar
2-undecanone Alfa Aesar
8. Molecular kits
PCR Purification Kit QIAGEN
cDNA reverse transcription kit Applied Biosystems
9. Molecular Reagents
Agarose Lonza, USA
Diethylpyrocarbonate (DEPC) Sigma
deoxynucleoside triphosphates (dNTP’s) New England Biolabs
Ethylenediaminetetra acetic acid (EDTA) SRL India
Ethidium bromide SRL India
Phenol Sigma Aldrich
Sodium dodecyl sulphate (SDS) SRL India
Tris base Merck
10. Molecular markers
DNA Ladder (100bp) New England Biolabs
DNA Ladder (1Kb) New England Biolabs
11. Reagents
Barritt reagent A Himedia
Barritt reagent B Himedia
2,4 dinitrophenyl hydrazine (DNPH) Sigma Aldrich
5-dimethylaminonaphthalene-
1-sulphonyl hydrazine (DNSH)
Sigma Aldrich
Kovac’s reagent Himedia
Methyl red Merck
44
Table 2.1 (Continued)
S. No. Chemicals Suppliers
12. Salts
Disodium phosphate Merck
Ferric chloride Merck
Sodium acetate SRL India
Sodium chloride Merck
Sodium hydroxide Merck
13. Solvents
Acetonitrile Fischer Scientific
Chloroform Fischer Scientific
Dichloromethane SRL India
Diethyl ether SRL India
Dimethyl sulphoxide SRL India
Ethyl acetate SRL India
Hydrogen peroxide Merck
n-hexane SRL India
14. Vitamin
Thiamine pyrophosphate (TPP) Himedia
2.1.2 Buffers used in this study
The buffers used in the study and their composition are tabulated in
Table 2.2.
Table 2. 2 List of buffers used and their composition
Buffers Composition pH
Tris Borate EDTA
(TBE)
Tris base; Boric acid, 0.5M EDTA 8.0
TNES buffer 0.01 M Tris, 0.4 mM Nacl, 0.1 M EDTA, 0.5% SDS 8.0
45
2.1.3 Cheminformatic Analysis of Bacterial Volatile Organic
Compound
Initially, an extensive literature survey was done to catalogue
VOCs released by known pathogenic bacteria including Actinobacillus,
Bacillus, Citrobacter, Clostridium difficile, E. coli, Enterobacter,
Enterococcus faecalis, Klebsiella, Mycobacterium tuberculosis, Neisseria
meningitides, Proteus, Psuedomonas, Salmonella, Serratia marcescens,
Shigella, Staphylococcus and Xanthomonas campestris.
Each organism produces a variety of compounds under different
growth conditions. A set of acids, alcohols, aldehydes, esters, hydrocarbons,
ketones, nitrogen and sulphur containing compounds have been identified to
be produced by the bacteria during their growth. Each of these compounds
serves as a signature for the organism in different growth medium. The lists of
compounds produced by each organism grown under different growth
medium are tabulated in the result section (Table 3.1).
2.1.4 Bacterial Strains used in the Study
The details of the standard reference strains and well characterized
clinical isolates are given below.
2.1.4.1 Standard strains
Standard strains of Shigella flexineri (MTCC-1457 (ATCC-
29508), MTCC-9543), Salmonella paratyphi (MTCC 3220), Salmonella
enterica subspecies (MTCC 3231), Proteus mirabilis (MTCC-425
(ATCC7002)), Proteus vulgaris (MTCC-426 (ATCC6380)), E. coli (MTCC-
46
723, 443 (ATCC-25922), 901(ATCC-13534), Klebsiella (MTCC-3384,
ATCC- 13883) and Staphylococcus aureus (MTCC-3160) were obtained from
Microbial Type Culture Collection (MTCC), Chandigarh. E. coli (ATCC-
25922), Staphylococcus aeureus (ATCC-25923) and Pseudomonas
aerunginosa (MTCC-27853) were obtained from Sri Ramachandra
University, Chennai, Tamilnadu, India.
2.1.4.2 Clinical isolates
Clinical diarrheagenic Escherichia coli strains were isolated from
stool samples of children, who were hospitalized with acute or persistent
diarrhea at the Institute of Child Health and Hospital for Children (ICH and
HC), Chennai, Tamilnadu, India. Salmonella typhimurium strain was obtained
from Sri Ramachandra University, Chennai and Uropathogens such as
Uropathogenic E. coli (UPEC), Klebsiella, Proteus mirabilis, Proteus
vulgaris, Pseudomonas aeruginosa, Citrobacter and Staphylococcus aureus
were obtained from M/s Trivitron Healthcare Ltd, Chennai, Tamilnadu, India.
The strains were confirmed by standard microbiological, biochemical tests
and Sensititre GNID identification plate for gram negative organisms from
TREK diagnostics systems, UK. The strains were further confirmed by 16S
rRNA sequencing. The lists of tests performed for identification of
E. coli, Klebsiella, Proteus, Pseudomonas, Salmonella, Shigella and
Staphylococcus are given in Table 2.3.
47
Table 2.3 List of biochemical and microbiological tests to identify E. coli, Klebsiella, Proteus, Pseudomonas, Salmonella,
Shigella and Staphylococcus
S. No E. coli Klebsiella Proteus Pseudomonas Salmonella Shigella Staphylococcus
1. Catalase Catalase Catalase Catalase Catalase Catalase Catalase
2. --- --- --- Cetrimide Agar --- --- ---
3.
Eosin Methylene
Blue
---
Eosin Methylene
Blue
--- --- --- ---
4. Indole Indole Indole Indole Indole Indole Indole
5. --- --- Urease --- --- --- Mannitol salt agar
6.
Methyl red–
Voges-Proskauer
Methyl red–
Voges-Proskauer
Methyl red–
Voges-Proskauer
Methyl red–
Voges-Proskauer
Methyl red–
Voges-Proskauer
Methyl red–
Voges-Proskauer
Methyl red–
Voges-Proskauer
7. Motility Motility Motility Motility Motility Motility Motility
8.
Salmonella
Shigella Agar
---
Salmonella
Shigella Agar
---
Salmonella
Shigella Agar
Salmonella
Shigella Agar
---
9. --- ---
Phenylalanine
Deaminase Test
Simmons’ Citrate
Agar
Simmons’ Citrate
Agar
--- ---
10. Triple Sugar Iron Triple Sugar Iron Triple Sugar Iron Triple Sugar Iron Triple Sugar Iron Triple Sugar Iron Triple Sugar Iron
48
2.2 PREPARATION OF GROWTH MEDIUM AND TEST
METHOD
The preparation methods and composition for various growth
medium used in this study are described below. For biochemical and
microbiological tests the growth medium was prepared as per the
manufacturer’s (Himedia) instructions.
2.2.1 Antibiogram Medium
Antibiogram medium (AB) was prepared according to the reported
procedure (Alagumaruthanayagam et al 2009) by dissolving 1 g of tryptone, 1
g of casein acid hydrolysate, 0.5 g of yeast extract and 1 g of Sodium chloride
(NaCl) in 1 L of distilled water after the pH was adjusted to 7.2 with 1 M
Sodium hydroxide, the broth was autoclaved at 15 lbs pressure for 20 min.
2.2.2 Catalase Test
Catalase test was performed by growing the culture in LB medium.
To one loop of culture taken in a clean slide 1 drop of hydrogen peroxide was
added. A positive reaction was indicated by bubbling.
2.2.3 Cetrimide Agar Test
Cetrimide agar was prepared by suspending 45.3 g in 1 L distilled
water and the pH was adjusted to 7.2 with 1 M Sodium hydroxide. The agar
was sterilized by autoclaving at 15 lbs pressure for 20 minutes. Using streak
method the culture was inoculated directly on Cetrimide Agar. The presence
of characteristic blue, blue-green, or yellow-green pigment indicated the
presence of Pseudomonas.
49
2.2.4 Eosin Methylene Blue Agar (EMB) Test
EMB agar was prepared by dissolving 35.96 g in 1 L of distilled
water after the pH was adjusted to 7.2 with 1 M Sodium hydroxide, the agar
was autoclaved at 15 lbs pressure for 20 min. The bacterial culture was
streaked on EMB agar plate using the quadrant streak plate method. Since
E. coli ferments lactose it produced strong acid end-products, indicated by the
development of green metallic sheen.
2.2.5 Luria Bertani (LB) Broth
Luria Bertani broth was prepared by dissolving 10 g of tryptone,
5 g of yeast extract and 10 g of NaCl in 1 L of distilled water after the pH was
adjusted to 7.2 with 1 M Sodium hydroxide, the broth was autoclaved at
121°C and 15 lbs pressure for 20 min.
2.2.6 Luria Bertani Agar
Luria Bertani (LB) agar was prepared by dissolving 10 g of
tryptone, 5 g of yeast extract, 10 g of NaCl and 2% agar powder in 1 L of
distilled water after the pH was adjusted to 7.2 with 1 M Sodium hydroxide,
the agar was autoclaved at 121°C and 15 lbs pressure for 20 min.
2.2.7 Methyl Red and Voges Proskauer (MR-VP) Test
MR-VP broth was prepared by dissolving 17 g in 1 L of distilled
water. The pH was adjusted to 6.9 with 1 M Sodium hydroxide, the agar was
autoclaved at 15 lbs pressure for 20 min. On growing the culture in the test
medium, the MR test was performed by adding one drop of Methyl red
indicator. VP test was done by adding 1 drop of Barritt Reagent A and 1drop
of Barritt Reagent B. Development of bright red color after Methyl Red
addition indicated positive result; while yellow-orange color indicated
50
negative results. Development of red colour after the addition of Barritt
Reagent (A&B) indicated a positive result for VP test.
2.2.8 Motility Test Agar
Motility test agar was prepared by dissolving 10 g of tryptone, 5 g
of NaCl and 0.6 g of agar in 1 L of distilled water, after the pH was adjusted
to 7.2 with 1 M Sodium hydroxide, the agar was autoclaved at 15 lbs pressure
for 20 min. Tubes were inoculated by stabbing through center of the medium
with inoculating needle to approximately one-half the depth of the medium.
Motile bacteria showed diffused growth throughout the entire medium. Non-
motile organisms grew only along the line of inoculation.
2.2.9 Nutrient Broth (NB)
Nutrient broth was prepared by dissolving 5 g of peptic digest of
animal tissue, 1.5 g of beef extract, 1.5 g of yeast extract and 5 g of NaCl in 1
L of distilled water, after the pH was adjusted to 7.3 with 1 M Sodium
hydroxide, the broth was autoclaved at 15 lbs pressure for 20 min.
2.2.10 Phenylalanine Deaminase Test
Phenylalanine agar was prepared by dissolving 3 g of yeast extract,
5 g of sodium chloride, 2 g DL-Phenylalanine, 1 g disodium phosphate and
15 g of agar in 1 L of distilled water. The pH was set at 7.3 using 1 M sodium
hydroxide. The agar was autoclaved at 15 lbs pressure for 20 min. After
incubation of the culture in Phenylalanine agar, five drops of 10% ferric
chloride and 3 drops of 0.1N HCl were added and were gently shaken. The
immediate appearance of an intense green color (1 - 5 minutes) indicates the
presence of phenylpyruvic acid, an indicative test for Proteus.
51
2.2.11 Salmonella Shigella (SS) Agar
Salmonella Shigella agar was prepared by dissolving 63.02 g in 1 L
of distilled water and the pH was adjusted to 7.0 with 1M Sodium hydroxide.
The agar was boiled without overheating and then cooled before use.
2.2.12 Simmons’ Citrate Agar
Simmons’ Citrate broth was prepared by dissolving 24 g of
Simmons’ Citrate agar in 1 L of distilled water, after the pH was adjusted to
7.0 with 1 M Sodium hydroxide the agar was autoclaved at 15 lbs pressure for
20 min.
2.2.13 Triple Sugar Iron (TSI) Agar
Triple sugar iron agar was prepared by suspending 64.62 g in 1 L
distilled water, after the pH was adjusted to 7.4 with 1 M Sodium hydroxide
the broth was autoclaved at 15 lbs pressure for 20 min.
2.2.14 Tryptone Soya Broth (TSB)
Tryptone Soya Broth was prepared by dissolving 30 g of the
powder in 1 L of distilled water, pH was adjusted to 7.3 with 1 M Sodium
hydroxide and the broth was autoclaved at 15 lbs pressure for 20 min.
2.2.15 Tryptone Broth
Tryptone broth was prepared by dissolving 15 g of tryptone in 1 L
of distilled water after the pH was adjusted to 7.5 with 1 M Sodium hydroxide
and the broth was autoclaved at 15 lbs pressure for 20 min.
52
2.2.15.1 Indole test method
On growing the culture in the tryptone broth, 2 drops of Kovac’s
reagent was added.
2.2.16 Urea Broth
Urea broth was prepared by dissolving 38.7 g in 1 L of distilled
water after the pH was adjusted to 6.8 with 1 M Sodium hydroxide. The broth
was filter sterilized using 0.2 micron filter (Sartorius stadim- Minisart).
2.3 GENOMIC DNA ISOLATION
Genomic DNA was extracted from 1.5 ml (taken in 2 ml centrifuge
tubes) of overnight grown cultures of various uropathogens including E. coli,
Klebsiella, Psudomonas, Proteus, Staphylococcus, Shigella and Salmonella.
The cells were centrifuged at 25 ºC for 10 min at 10,000 rpm. The supernatant
was discarded and to the pellet, 500 µl of TNES buffer and 35 µl of
Proteinase K was added and mixed by slowly inverting the tubes several
times. The tubes were incubated for 10 min in ice followed by incubation at
55 ºC (drybath) for 10 min. Then 150 µl of 6 M NaCl was added and the tubes
were vigorously shaken for 20 sec. Following centrifugation at 10,000 rpm
for 20 min the supernatant was carefully transferred to fresh tube without any
debris. To the supernatant double the volume of cold absolute ethanol was
added. Tubes were shaken till a white precipitate was observed.
Centrifugation was done for 20 min at 10,000 rpm. The pellet was then
washed thrice with 100 µl of 70% ethanol. After each wash centrifugation
was done at 10,000 rpm for 10 min. The ethanol was poured off and the pellet
was air dried. The air dried pellet was dissolved in 20 µl of 0.5X Tris Borate
EDTA (TBE) buffer. Table 2.4 gives the list of primers for various bacterial
strains that was used to identify the organism.
53
Table 2.4 List of organisms and their 16S rRNA Primer sequence
Organism 16S rRNA Primers
Forward Reverse
E. coli
5’ AGAGTTTGATCCTG
GCTCAG 3’
5’ CTTGTGCGGGC
CCCCGTCAATTC 3’
Klebsiella
5’ AGAGTTTGAT
CMTGGCTCAG 3’
5’ TACGGATACCT
TGTTACGACTT 3’
Proteus
5′ CGA AGA AGT AAC AGC
CAA AG 3′
5′ ATC CCAACA TCT CTC CCA
CT 3′
Pseudomonas
5'-CTACGGGAG
GCAGCAGTGG 3'
5’ TCGGTAACG
TCAAAACAGCAAAGT 3'
Salmonella
5' GGTGGT TTC CGT
AAA AGT A 3’
5' GAA TCG CCT GGT TCT
TGC 3'
Shigella
5’ AAACTCAAAGG
AATTGAC 3’
5’ GACGGGCGTGTGTACAA 3’
2.3.1 Agarose Gel Electrophoresis
To check for the extracted RNA and conversion to cDNA, agarose
gel electrophoresis was employed. 1.5 % of agarose was dissolved in 0.5 X
TBE by heating in a microwave oven for 2 minutes. To the molten agarose
mix, 0.5 µg/ml of ethidium bromide was added at hand bearable temperature
and the contents in the flask were swirled to mix thoroughly. The mix was
poured into gel tray fitted with combs. The gel was allowed to solidify for
15 minutes. The gel was submerged in 0.5 X TBE buffer present in the
electrophoretic gel tank. The samples mixed with 6 X gel loading dye were
loaded into wells; appropriate DNA markers (1 kb or 100 bp ladders) were
also loaded into the wells. Electrophoresis was performed at constant voltage
of 150 volts till the tracking dye reached the anodic end of the gel. The gel
was viewed using gel documentation system (Biorad, USA). The
54
concentration of the extracted genomic DNA was quantified using Nano Drop
2000/2000c from JH BIO innovations Pvt. Ltd/ Thermo Scientific, India.
2.3.2 Polymerase Chain Reaction (PCR)
PCR analysis was carried out using 20 µl reaction mixture
containing 12.5 µl of sterile water, 2 µl 10 X buffer, forward and reverse
primer each 1 µl containing 5 picomole, 2 µl of 2.5 mM deoxynucleoside
triphosphates (dNTPs), template DNA (~40 ng), and 0.2 µl of 5 U Taq DNA
polymerase. Thermocycling conditions were as follows: 95 °C for 5 min; 30
cycles of 95 °C for 1 min; 55 °C for 1 min; 72 °C for 1 min and 72 °C for 5
min. The PCR product was purified using the PCR purification kit.
2.4 EXTRACTION OF VOLATILE ORGANIC COMPOUNDS
(VOCs) FROM CULTURE
Different methods for the extraction of VOC from the culture were
attempted in this study. Initially a small bag (Figure 2.1) made of tissue paper
was packed with 400 mg of charcoal powder and was placed inside the flask
containing the pure compound or the culture. Then, either diethyl ether or
n-hexane or dichloromethane or acetonitrile or dimethyl sulphoxide or
methanol or ethanol was used to elute the adsorbed compounds from the
charcoal.
Similarly, silica discs cut to the size of inner dimensions of the cap
(Figure 2.2 a) were used to cover the mouth of the vial (1.5 ml) (Figure 2.2 b)
and conical flask (250 ml) (Figure 2.2 c) containing either pure compound or
culture. After incubation the silica was scrapped off the plates with the
solvents mentioned above. The extracts were analysed using Gas
chromatogram (GC).
55
Figure 2.1 Charcoal adsorbant contained in a tissue paper bag was
kept hanging above the culture or pure compound
containing medium to facilitate adsorption for further
analysis
(a) (b) (c)
Figure 2.2 Silica discs were used as VOC adsorbant as shown in
pictures a-c. The adsorbed VOC were eluted using suitable
solvent from the the silica disc (a) Silica disc cut to the size
of inner dimension of the vial cap (b) Silica disc placed
inside of the vial cap (c) Silica disc covering the mouth of the
conical flask
Secondly, the culture was inoculated in 1.5 ml vials, 15 ml
centrifuge tubes and 250 ml conical flasks containing 1.0, 7.0 and 100 ml of
LB medium respectively. After 7 h a 2.5 ml syringe containing 200 µl of
extraction solvents (acetonitrile or ethanol) was punctured with the needle
{(Figure 2.3a) and (Figure 2.3b)} into the headspace of the vial and the
headspace was extracted. Another method where one end of the capillary tube
was inserted into the conical flask closed with a rubber cork and another end
Tissue paper
bag containing
charcoal
56
carrying a vial containing 1ml of the solvent (Figure 2.3c) was also tried to
extract the VOC. The extracted samples were then analysed using GC.
(a) (b) (c)
Figure 2.3 Simple VOC extraction setup using a syringe, needle and a
capillary tube as shown in pictures a-c. The solvent phase
which collects the VOC contained in the syringe and vial
were analysed using GC-MS (a) shows the VOC collection
using a syringe from 1.5 ml vial (b) shows the VOC
collection with the syringe set-up from 15 ml centrifuge
tube (c) shows the VOC collection using a capillary tube
The third method attempted was solvent extraction of the culture.
To 1 mL of sterile LB medium contained in 2 mL centrifuge tube, 20 µL (105
cells) of each organism was inoculated separately and incubated in a rotary
shaker set at 37 ºC and 170 rpm. Following 7 h of incubation, equal volume of
chloroform or dichloromethane (DCM) or ethyl acetate, was added and
vortexed for 1 min to extract the VOCs. The solvent phase was collected and
analyzed in GC-MS and FT-IR.
2.5 INSTRUMENTAL METHODS FOR VOC IDENTIFICATION
To identify the characteristic compound of Proteus the extracted
solvent phase was analysed using GC-MS and FT-IR. The specifications of
the instrument and other conditions are provided below.
57
2.5.1 Gas Chromatographic (GC) Analysis
The extracts from pure compound and culture were analysed using
gas chromatography. The Gas chromatogram and other conditions used are
mentioned below.
GC (Shimadzu GC-9A, Chromatpak. Spec: Column: Epiezon L;
Flame Ionization Detector (FID); Injection port: 150 ºC; Column temperature:
150 ºC; Detector temperature: 200 ºC; carrier gas: Nitrogen).
2.5.2 Gas Chromatography-Mass Spectroscopy (GC-MS) Analysis
GC-MS was performed using Shimadzu QP 2010.
2.5.2.1 GC
The samples were injected at an injector temperature of 140 °C and
separated on Rtx-624 ms (Restek) column (length: 30 m; diameter: 0.32 mm
and film thickness: 1.8 µm). Helium (99.9%) was used as the carrier gas at the
flow rate of 3.02 mL/min; the oven temperature was 35 °C. Column
temperatures were programmed from 35 to 240 ºC.
2.5.2.2 MS
The samples were scanned at the range 35-400 m/z between 1.5
min to 24 min with electron ionization detector set at ionization EI of -70 eV.
The ion source temperature was 200 ºC with the interface temperature of
240 ºC. The event time and solvent cut time was 0.5 sec and 5 min
respectively.
58
2.5.3 Fourier Transform-Infrared (FT-IR) Analysis
FT-IR method of analysis is sensitive, rapid and an inexpensive
form of analysis of compounds of biological importance requiring a small
amount of sample. To get an estimate of the molecular components in the
extract the FT-IR analysis was performed. It identifies specific chemical
functional groups within compounds. The FT-IR vibrational spectra of the
solvent extracts were read using a IR Prestige model FT-IR spectrometer
(Make: Shimadzu, Japan). IR spectrum was recorded by placing the infrared
cell containing the solvent (DCM) extracted sample in the IR path. The
spectrum was scanned from 400 to 4000 cm-1
with a resolution of 4 cm-1
. The
presence of the functional groups was identified by the different positions of
absorption peaks in the FT-IR spectrum due to the vibration of specific
functional group corresponding to the different modes of vibration.
2.5.4 Comparative Analysis of Pure Compound and the
Characteristic VOC from Proteus using Gas Chromatography
Further to confirm that the characteristic VOC from Proteus was
2-methylbutanal the pure compound and the extract was analysed using GC
(details have been mentioned earlier). The culture extract and standard
2-methylbutanal was taken in DCM. After analysis the chromatogram of both
the samples were matched.
2.6 DEVELOPMENT OF SURVEILLANCE METHOD FOR
IDENTIFICATION OF CHARACTERISTIC VOC
Though, the GC-MS analysis of the extracts revealed the presence
of the characteristic compound of Proteus, the colorimetric and fluorimetric
assays were carried out using common volatile organic aldehydes and
ketones. Since a number of carbonyl compounds are produced by different
59
organisms in various growth medium and also the indicators and dyes used in
this study are generic to all carbonyl compounds, the assay was standardized
with other carbonyls. Thus, such assays can be applied to other organisms
grown in defined growth conditions.
2.6.1 Colorimetric Assay for Carbonyl Volatile Organic Compounds
Colorimetric assay for identification of carbonyl VOC was
developed using 2,4 DNPH reagent. The preparation of the reagent and the
assay method are as follows:
Preparation of reagent: 2,4 DNPH reagent was prepared by dissolving 0.2 g
of 2,4 DNPH powder in 100 ml 2 N Hydrochloric acid. The solution was
heated for 1 h and left overnight for the undissolved particles to settle. Then
the solution was filtered using a crude filter paper. To the filtrate 100 ml of
absolute ethanol was added and used for spotting.
Assay method: Methodologies were developed for identifying carbonyl
compound by simulating experimental conditions using commercially
available pure compounds. Silica coated discs were used to adsorb in the
inner side of the lids of air-tight vials and appropriate carbonyl specific
colouring reagent, 2,4, Dinitrophenyl hydrazine (Yuguang et al 2007) were
used to reveal the adsorbed molecules. However, due to its limited sensitivity
an alternative fluorescent dye DNSH was chosen.
2.6.2 Fluorescent Dye Reagent Specific for Carbonyl Compounds
Fluorimetric assay for identification of carbonyl VOC was
developed using Dansyl hydrazine (DNSH) reagent. The preparation of the
reagent and the assay method are as follows:
60
Reagent preparation: Fluorogenic reagents for the derivatization of carbonyl
compounds are in routine practice for sensitive and selective detection. Owing
to its sensitivity the fluorimetric dye, 5-dimethylaminonaphthalene-
1-sulphonyl hydrazine (DNSH) (Jason et al 2005, Schmied et al 1989) was
chosen for the study. The dye solution was prepared by dissolving 0.02 g of
the dye powder in 1 mL of HPLC grade acetonitrile to give a final
concentration of 75.3 mM.
Assay method: Initially, VOC adsorbed silica disc was spotted using DNSH
reagent, however, due to the lack of dye stability the assay was standardized
in liquid medium. Similarly, the sensitivity of the dye was not adequate for
detecting lower concentrations of VOC from bacteria. Hence, when the dye
solution (75.3 mM) was added to the sample followed by glacial acetic acid
(for acid catalysis), the fluorescence yield increased 2 times and the
conversion of orange to green fluorescence could be visualized in UV
transilluminator. For testing the reagent 200 µL sample in 96-well plate was
mixed with 5 µL of dye reagent followed by 2.5 µL of glacial acetic acid.
2.7 STANDARDIZATION OF DNSH ASSAY FOR CARBONYL
COMPOUNDS
To standardize the DNSH assay, 16 pure compounds, carbonyl as
well as non-carbonyl, (2-methybutanal, benzaldehyde, hexanal, decanal,
2-heptanone, 2-nonanone, 2-tridecanone, 2-pentanone, acetophenone,
propanol, ethanol, methanol and butanol, propionic acid, phosphoric acid and
butyric acid) were reacted with the dye and the resultant fluorescence was
scanned for excitation at 300-400 nm. Subsequently the samples were excited
at the fixed maximum excitation wavelength for carbonyl compounds, and
scanned at 500-600 nm for respective emission maximum. Thus excitation
was fixed at 336 nm and emission was fixed at 531 nm. For detecting
carbonyl compounds from culture, DNSH assay was performed with bacterial
61
strains after 7 h of growth and the fluorescence was read in a fluorimeter set
at the above excitation and emission wavelengths (Ex/Em). The fluorescence
was measured using a fluorimeter, (Model: Enspire, Perkin Elmer, USA) and
the same was imaged using a UV transilluminator for visualization.
2.8 FLUORESCENCE BASED DNSH ASSAY (PROTEAL) FOR
DETECTION OF PROTEUS SPECIES
The DNSH assay for detecting the aldehyde released by Proteus
species was performed in a 96-well plate. Each well was filled with 180 µL of
LB medium and 20 µL of 105
cells of the test strains were inoculated. The
plate was incubated at 37 °C and 100 rpm for 7 h in an orbital shaker. The
optical densities (600 nm) of bacterial cultures were measured after 7 h using
Multiscan reader (Thermo, Finland) and then the DNSH assay was performed
by adding 5.0 µL of the dye solution and 2.5 µL of glacial acetic acid. The
fluorescence was measured after 5 min using the fluorimeter and the plates
were also imaged. The assay is referred to as ProteAl (Prote, “Proteus” &
Al, “Aldehyde”).
To check for the specificity of the growth medium in VOC
production Proteus was grown in various media like LB, NB, AB and TSB
and ProteAl was performed. To profile VOC release with respect to time, the
assay was performed every one hour of bacterial growth. ProteAl assay was
performed with various concentrations of 2-methylbutanal; and a standard
graph was generated using the fluorescence data obtained for each
concentration. A quantitative estimation of the VOC in the culture at different
time point (from 4th
hour) was obtained using the standard graph.
62
2.9 TESTING THE VOLATILITY OF 2-METHYLBUTANAL
FROM CULTURE
In order to confirm that the fluorescence produced is only due to
the VOC and to check the interference of the cells with the assay, 2 sets of
positive (Proteus) and negatives were grown in similar conditions where, one
set was centrifuged, supernatant was removed and assayed. And in the other
set, cells were washed twice with 0.9 % saline to remove the medium
components and then assayed. To check whether the target of the assay is a
volatile carbonyl compound released by Proteus, each well was filled with
180 µL of LB medium and 20 µL of 105
cells were inoculated. The assay
plate was incubated open at different temperatures: at room temperature
(≈ 27 °C), in refrigerator (≈ 4 °C) and on ice and the assay was performed
after 1 and 2 h.
2.10 LABORATORY VALIDATION OF THE PROTEAL ASSAY
Initially the optimized assay conditions were tested on a few
standard strains of Proteus and a few other common bacteria subsequently 39
standard and 56 known clinical strains representing frequently encountered
uropathogens including {27 Proteus (both mirabilis and vulgaris), 27 E.coli,
8 Klebsiella, 10 Staphylococcus, 7 Pseudomonas}, 2 Enterobacter,
2 Citrobacter, 7 Salmonella, 4 Shigella and 1 Listeria were tested in duplicate
for validation. For validating the method using environmental samples
approximately 200 soil strains were collected from three different areas
located close to the laboratory as listed in the Table 2.5.
63
Table 2.5 List of environmental sample collection locations
Location Type of waste dumped
Madipakkam, Chennai Hospital waste
Pallikaranai, Chennai Domestic waste
Taramani, Chennai Laboratory waste
Around 10 g of soil samples were collected from each location by
digging the ground approximately 6 inches below the surface. From this 1 g
of the soil was dissolved in 10 ml of sterile distilled water and was serially
diluted to ~105
cells and plated onto LB agar plates. Morphologically different
colonies were isolated and common microbiological and biochemical tests
were performed followed by screening with ProteAl assay.
2.11 SENSITIVITY AND SPECIFICITY CALCULATION
Sensitivity and specificity of the assay was calculated using the
formula, Sensitivity = [a/ (a+c)] ×100 and Specificity = [d/ (b+d)] ×100
Table 2.6 Table for sensitivity and specificity calculation
True positive (a) False positive (b)
False negative (c) True negative (d)
When the growth (OD) of the strains where similar, the 99 %
confidence for the positive (Proteus) and negatives were calculated using the
formula.
64
X± 2.58 (δ/√n)
Where X is sample mean; δ, population standard deviation and n,
sample size (Jose 2009).
2.12 IDENTIFICATION OF THE METABOLIC PATHWAY
USING BIOLOGICAL DATABASES
A detailed literature search was done to understand the pathways
that are involved in the production of 2-methylbutanal. A number of pathways
have been identified using bioinformatics databases like KEGG, MetaCyc and
BioCyc in different organisms that produce 2-methylbutanal, mainly as end
product of isoleucine catabolism. Though, there are no reports on such a
pathway in Proteus species, the enzymes involved in the pathway in other
bacteria including Lactococcus lactis (Pilar et al 2004) were identified and the
sequence of the enzymes involved in isoleucine degradation pathway
(branched chain aminotransferase and alpha-ketoacid decarboxylase) were
blasted against Proteus genome using NCBI BLAST with all non-redundtant
databases. Based on the nucleic acid sequence alignment, the primers at the 5’
end of sense and non-sense sequences were designed to amplify the Open
reading frame (ORF) corresponding to alpha-ketoacid decarboxylase (kdcA).
2.13 RATIONAL DESIGN OF GROWTH MEDIUM FOR
ENHANCED 2-METHYLBUTANAL PRODUCTION
In order to enhance the production of 2-methylbutanal a rational
medium was designed by supplementing the growth medium with isoleucine
and thiamine pyrophosphate. The optimized medium composition is
mentioned below.
65
2.13.1 Study on the Effect of Branched Chain Amino Acids on
2-methylbutanal Production
Initially various concentrations (8, 15, 23, 31, 38 and 76 mM) of
Isoleucine (Ile) was supplemented in LB medium and checked for 2-
methylbutanal levels by the fluorescence method (method described earlier).
The LB-Ile broth was prepared by dissolving 10 g of tryptone, 5 g of yeast
extract, 10 g of NaCl and 2 g of isoleucine in 1 L of distilled water; after the
pH was adjusted to 7.2 with 1 M Sodium hydroxide and autoclaved at 15 lbs
pressure for 20 min. Similarly various concentrations of Leucine (Leu) and
Valine (Val) was also supplemented in the LB medium and checked if it had
an effect on 2-methylbutanal enhancement.
2.13.2 Study on the Effect of TPP for 2-methylbutanal Production
After the standardization of optimum concentration of isoleucine
for enhanced VOC production, LB-Ile broth was supplemented with various
concentrations (0.5, 1.0, 1.5, 2.0, 2.5 mM) of Thiamine pyrophosphate (TPP)
since it acts as a cofactor for alpha-ketoacid decarboxylase enzyme (Max
et al 1998). The optimal concentration of TPP was found out using ProteAl
assay. The effect of LB with Ile and TPP and the combined effect of Ile and
TPP in LB were studied by growing Proteus strains in the doubly
supplemented medium and assaying them for 2-methylbutanal release. The
medium in which there was maximum enhancement of fluorescence was used
further for studying the gene regulation.
66
2.14 REGULATION OF THE METABOLIC PATHWAY
INVOLVED IN 2-METHYLBUTANAL PRODUCTION
To study the regulation of the metabolic pathway and to understand
the influence of isoleucine and TPP at gene level the total RNA was extracted
and reverse transcribed to cDNA. The cDNA was further used as a template
for gene expression quantification using real-time PCR. The protocol for
extraction, conversion and quantification are briefed below.
2.14.1 Extraction of Total RNA from Proteus Culture
Total RNA was extracted from Proteus culture grown for 7 h in
different growth medium including LB, LB-Ile and LB-Ile-TPP. 2 ml of
culture were taken in 2 ml centrifuge tube and centrifuged at 10,000 rpm for
10 min at 10 ºC (Eppendorf cooling centrifuge 5804 R). The pellet was
re-suspended in 100 µl of Tris EDTA solution and 100 µl of 2% Sodium
dodecyl sulphate (SDS) was added and mixed well to disrupt the cells and
release the contents. 1ml of phenol was added and incubated at room
temperature for 5 min. Chloroform (200 µl) was added to the mixture and the
solution was mixed gently for a few seconds. The tubes were centrifuged at
10,000 rpm for 10 min at 10ºC. The aqueous phase (~300 µl) was carefully
aspirated and transferred to fresh tubes. To the aqueous extract 30 µl of 3M
Sodium acetate and 1.5 ml of 100% ethanol were added and incubated in
-20 ºC freezer for 30 min to precipitate nucleic acid. The tubes were
centrifuged at 10,000 rpm for 10 min at 10 ºC to collect the pellet, which was
then washed twice by suspending it in 70% ethanol and then centrifuging at
10,000 rpm for 10 min at 10 ºC. Pellet was dissolved in 40 µl of nuclease-free
water and digested with 1U of DNase to remove DNA. The extracted RNA
was confirmed by agarose gel electrophoresis.
67
2.14.2 Conversion of RNA to cDNA
The total RNA was reverse transcribed into cDNA using a high-
capacity cDNA reverse transcription kit with RNase inhibitor and random
hexamers. Each reaction mixture (20 µl) contained 5.2 µl of sterile water, 2 µl
of 10X buffer, 0.8 µl of 2.5 mM deoxynucleoside triphosphates (dNTPs), 2 µl
of random hexamers, 1 µl of RNase inhibitor, 1 µl reverse transcriptase and 8
µl of template (RNA). Thermocycling conditions were as follows: 25°C for
10 min, 37°C for 2 h, 85°C for 5 min and hold at 4 ºC for 5 minutes.
2.14.3 Quantification of Gene Expression using Real-time PCR
(qPCR)
In a 0.1 ml PCR tube (Applied Biosystems), a qPCR reaction in
10 μl of total volume was set up as follows: 5 μl 1X PCR master mix (Kapa),
1 μl (5 picomole) each of forward and reverse PCR primer, 0.5 μl of high
ROX Reference Dye (25 μM), 1 μl (~12 ng) of diluted cDNA Template and
0.5 μl of Diethylpyrocarbonate (DEPC)-treated sterile water.The primers used
for qPCR analysis are tabulated in Table 2.7. The thermal cycling program of
ABI StepOne (Applied Biosystems PCR machine) was: Holding stage: 95 °C
for 20 sec, Cycling stage: 95 °C for 3 sec, Annealing 55 °C for 30 sec for 40
cycles and Melt curve stage 95 °C for 15 sec, 60 °C for 1 min, 95 °C for
15 sec.
68
Table 2.7 List of genes and their primer sequences
Gene
Primers Product
sizeForward Reverse
Alpha- ketoacid
decarboxylase
(gene responsible for
the conversion of an
acid to aldehyde)
GTTGGCGCGCCTT
CTCAGTCA
CATCACACCGACAT
CCTCTGGT
~225 bp
DNA-directed RNA
polymerase subunit
alpha (rpo A)
(Housekeeping gene)
GCGTGTTATAGCC
CAGTTGA
AGGCTGACGAACAT
CACGT
~200 bp
69
CHAPTER 3
RESULTS
VOC based detection, which has the distinct advantage of being
non-invasive and suitable for surveillance over existing techniques, is yet to
emerge as a diagnostic approach in bacterial identification. Highly sensitive
fluorescence based chemical methods are now becoming popular in a variety
of analytical applications. Hence, such a fluorescence method has been
developed in this study to detect the carbonyl compound, 2-methylbutanal
from the cultures of Proteus. The results on identification of 2-methylbutanal
as characteristic carbonyl compound under defined growth conditions,
standardization of the assay, ProteAl, its laboratory validation and media
development for enhanced production of the VOC are given below.
3.1 A NON-DESTRUCTIVE APPROACH FOR PATHOGEN
DETECTION USING VOLATILE ORGANIC COMPOUNDS
Prevention by effective surveillance and high throughput screening
are essential in the control of infectious diseases. Non-invasive diagnosis is
the future trend to obviate the unpleasant, painful and even dangerous
invasive practices (prone to secondary complications) in vogue. Modern
diagnosis of diseases also prefers a non-destructive approach employing
minimal sample handling for obvious advantages. In this regard, detection of
characteristic VOC has the distinct advantage of even remote monitoring of
pathogens in environment for preventive surveillance; monitoring of
pathological processes and assessment of pharmacological responses are also
70
possible. Sensitive fluorescence-based detection methods are emerging as the
present trend in a variety of analytical applications. Therefore, fluorescence
detection of VOC has great promise in pathogen detection and surveillance.
Such a method has been developed in this study to detect the carbonyl
compound, 2-methylbutanal, characteristic VOC of Proteus in the culture.
3.1.1 VOC Biomarkers Found in Various Uropathogens
A variety of VOCs are produced by a bacterial pathogen. The
characteristic one has to be identified by a comparative analysis among other
pathogens that can also cause the disease under the same or similar condition.
Since we were interested in Proteus associated with UTI, cheminformatic
analysis of VOCs produced by all common uropathogens was performed and
the results are tabulated in Table 3.1.
From the information obtained, it is evident that the compounds
emitted by uropathogens belonged to a great variety that includes aldehydes,
ketones, alcohols, acids, sulphur or nitrogen compounds, esters and cyclic
compounds. However, the actual VOC produced is dependent on the
organisms and the type of medium and growth conditions (see the growth
medium column in the Table 3.1). In the case of Proteus we chose to look for
characteristic aldehyde or ketone (owing to the availability of highly
sensitive, easy-to-perform colorimetric and fluorescence methods; their
reactivity and their volatility) while culturing the organism in the popular
Luria Bertani broth.
71
Table 3.1 Reported Volatile Organic Compounds released by various bacteria in different growth medium
S.
No
Organism Acids Alcohols Aldehydes Cyclic
compounds
Esters Hydro-
carbons
Ketones Nitrogen
containing
Sulfur
containing
Growth
medium
References
1.
Bacillus
cereus
Benzenecar-
boxylic acid,
Crotonic acid,
Propionic acid
n-butyl
alcohol,
n-propanol
Nonanal Acetoin Dimethyl
disulphide
Luria
Broth
(Horsman
& Crouse
2008)
2.
Enterobacter 1-decanol, 1-
dodecanol,1-
octanol
Trypti-
case soy
broth
(Elgaali &
Hamilton
et al 2002)
3.
Citrobacter 1-decanol, 1-
dodecanol,1-
octanol
Trypti-
case soy
broth
(Elgaali &
Hamilton
et al 2002)
4.
Clostridium
difficile
Ethanoic acid 1-butanol,
2-methyl-1-
propanol,
3-methyl-1-
butanol,
2-propanol,
phenylethyl
alcohol
Benzaldehyde,
ethanal,
hexanal, 2-
methylbutanal,
3-
methylbutanal,
2-methyl
propanal
Acetone,2-butanone,
2,3-butanedione,
2-heptanone,
3-hydroxy-2-
butanone,
2-pentanone, 2,3-
pentane-dione
Infected
stool
samples
(Garner &
Smith
et al 2007)
5.
Entero-
coccus
faecalis
Formaldehyde,
2-methylbutanal
Ethyl
butanoate,
n-propyl
acetate
Acetone, butanone,
2-pentanone
Ammonia Dimethyl
disulphide,
dimethyl
sulphide,
hydrogen
sulphide,
methyl
mercaptan
Urine (Storer et al
2011)
72
Table 3.1 (Continued)
S.
No
Organism Acids Alcohols Aldehydes
Cyclic
compounds
Esters
Hydro-
carbons
Ketones
Nitrogen
containing
Sulfur
containing
Growth
medium
References
6.
Escheri-
chia coli
3-methyl-1-
butanol,2-
(methylthio)
-ethanol
Methyl
benzoate
1-methyl-
naphtha-
lene,
2-methyl-
naphtha-
lene
2-decanone,
2-nonanone,
2-octanone,
2-undecanone
Benzonitrile Dimethyl
disulfide
Brain
hearth
infusion
medium
(Melanie et
al 2012)
1-propanol Methylcyclo-
hexane
Methyl
propanoate
Dimethyl
disulfide,
dimethyl
trisulfide
LB broth (Brandon
et al 2013)
Ethanol,
1- decanol,
1-
dodecanol,
octonol,
1- propanol
Acetonitrile Dimethyl
sulphide
Tryptic
soy broth
(Arnold &
Senter
1998,
Jiangjiang
et al 2010)
Acetic acid,
butanoic acid,
phenylacetic
acid
1-butanol,
Ethanol,
1-pentanol
Formalde-
hyde
Pyrrole Ethyl acetate,
ethylbuta-
noate
Acetone ,
Acetoin,
2-aminoaceto
-phenone
Trimethylamine Dimethyl
disulfide,
Hydrogen
sulphide, Methyl
mercaptan
Tryptone
yeast
extract
broth
(TYE)
(Thorn et al
2011)
Acetic acid Ethanol
methanol
Formalde-
hyde
Ethyl acetate,
ethylbutano-
ate, n-propyl
acetate
Acetone,
2-aminoacto-
phenone
Trimethylamine Dimethyl
disulphide,
dimethyl
sulphide,
hydrogen
sulphide, methyl
mercaptan
Urine (Storer et al
2011)
73
Table 3.1 (Continued)
S.
No
Organism Acids Alcohols Aldehydes
Cyclic
compounds
Esters
Hydro-
carbons
Ketones
Nitrogen
containing
Sulfur
containing
Growth
medium
References
7.
Klebsiella
pnuemoniae
3-methyl-1-
butanol, 2-
(methylthio)
-ethanol
3-methyl-
butanal
1-undecene 2-nonanone Brain
hearth
infusion
medium
(Melanie
et al 2012)
1-butanol,
ethanol,
1-pentanol
Formalde-
hyde
2-amino
acetophe
none
Ammonia,
trimethylamine
Hydrogen
sulphide,
methyl
mercaptan
Tryptone
yeast
extract
broth
(TYE)
(Thorn et al
2011)
Ethanol Formalde-
hyde
Ammonia,
trimethylamine
Dimethyl
disulphide,
dimethyl
sulphide,
hydrogen
sulphide,
methyl
mercaptan
Urine (Storer et al
2011)
8.
Proteus
mirabilis
2-
(methylthio)
-ethanol ,
phenethyl
alcohol
2-acetylthi-
azole
Isoamyl
benzoate, 3-
methylbutyl 2-
methylpropano
ate, S-methyl
thiobenzoate,
2-phenyl ethyl
acetate
2,3-heptane-
dione, 2-
nonanone, 2-
undeca-none
N-n-
butylphthalimide,
N-(1,1-
dimethylethyl)-
benzamide, 3-
methyl-N-(3-
methylbutylidene)-
1-butanamine,
3-methyl-N-(2-
phenylethylidene)-
1-butanamine
Dimethyl
Disulfide,
dimethyl
trisulfide,
2,3-
heptanedione
Brain heart
infusion
medium
(Melanie
et al 2012)
74
Table 3.1 (Continued)
S.
No
Organism Acids Alcohols Aldehydes
Cyclic
compounds
Esters
Hydro
carbons
Ketones
Nitrogen
containing
Sulfur
containing
Growth
medium
References
Butanoic
acid,
phenyl-
acetic acid
1-butanol,
ethanol,
1-pentanol
Formalde-
hyde,
2-methyl-
butanal
Pyrrole Ethyl
acetate,
ethyl
butanoate
Acetoin, 2-
aminoacetophenone
Trimethylamine Dimethyl
disulfide,
hydrogen
sulphide,
methyl
mercaptan
Tryptone
yeast extract
broth (TYE)
(Thorn et al
2011)
9.
Proteus
vulgaris
Acetalde-
hyde,
formalde-
hyde
n-propyl
acetate
Acetone,
Aminoaceto-
phenone
Ammonia,
trimethyl amine
Dimethyl
sulphide,
dimethyl
disulphide,
hydrogen
sulphide,
methyl
mercaptan
Urine (Storer et al
2011)
10.
Pseudomonas
aeruginosa
3-methyl-1-
butanol
3-methyl
butanal
1-undecene 2-nonanone Dimethyl
disulfide
Brain hearth
infusion
medium
(Melanie et
al 2012)
Acetic acid Ethanol 10-methyl-
1-undecene
Acetone,
2-aminoaceto-
phenone,
2-pentanone
Acetonitrile Tryptic soy
broth
(Jiangjiang
et al 2010,
Wojciech et
al 2012)
1-butanol
ethanol,
1-pentanol
Formalde-
hyde
2-aminoaceto-
phenone
Ammonia,
trimethylamine
Hydrogen
sulphide,
methyl
mercaptan
Tryptone
yeast extract
broth (TYE)
(Thorn et al
2011)
Ethanol Formalde-
hyde
Methyl
mercaptan
Urine (Storer et al
2011)
75
Table 3.1 (Continued)
S.
No
Organism Acids Alcohols Aldehydes
Cyclic
compounds
Esters
Hydrocarb
ons
Ketones
Nitrogen
containing
Sulfur
containing
Growth
medium
References
11.
S. typhimurium Acetic acid Butanol ,
ethanol,
isopentanol,
4-methylphenol
Pyrimidine Acetone,
2-nonanone,
2-pentanone
Acetonitrile Tryptic
soy broth
(Jiangjiang
et al 2010)
12.
Staphylococcus
aureus
3-methyl-1-
butanol, 2-
(methylthio)-
ethanol
3-methyl-
butanal
Brain
hearth
infusion
medium
(Melanie et
al 2012)
Acetic acid,
isovaleric
acid
Butanol,
ethanol,
isopentanol,
4-methylphenol
2- methyl-1-
propanol, 3-
methyl-1-
butanol
Acetaldehyde ,
(Z)-2-methyl-
2-butanal,
3-methyl-
butanal,
2- methyl-
propanal
Pyrimi-dine 1,3-butadien,
n-butane,
2-butene 2-
methylpropene
propane
Methyl
methacry-
late
Acetone,
2-nonanone,
2-pentanone
Acetonitrile Dimethyl
disulfide,
methanethiol
Tryptic
soy broth
( Wojciech
et al 2012,
Lieuwe et al
2013)
Formaldehyde,
2-methyl-
butanal
Ammonia,
trimethyl-
amine
Methyl
mercaptan
Urine (Storer et al
2011)
76
Table 3.1 (Continued)
S.
No
Organism Acids Alcohols Aldehydes
Cyclic
compounds
Esters
Hydrocarb
ons
Ketones
Nitrogen
containing
Sulfur
containing
Growth
medium
References
13.
Xantho-
monas
campestris
Benzylalcohol,
2-phenylethanol,
8-methylnonan-
2-ol,
7-methylnonan-
2-ol,
undecan-
2-ol,
10-methylundecan-
2-ol,
9-methyundecan-
2-ol,
tridecan-2-ol,
12-methyltridecan-
2-ol,
11-methyltridecan-
2-ol,
tetradecan-2-ol
n-octane hexan-2-one,
5-methylhexan-2-one,
heptan-2-one,
n-nonane,
6-methylheptan-2-one,
5-methylheptan-2-one,
octan-2-one,
acetophenone, 7-methyloctan-2-
one, nonan-2-one,
8-methylnonan-2-one, 7-
methylnonan-2-one,
decan-2-one,
9-methyldecan-2-one, undecan-
2-one,
10-methylundecan-2-one, 9-
methylundecan-2-one,
dodecan-2-one, geranylacetone,
11-methyldodecan-2-one,
tridecan-2-one,
12-methyltridecan-2-one, 11-
methyltridecan-2-one,
13-methyltetradecan-2-one,
pentadecen-2-one, pentadecan-
2-one, 14-methylpentadecan-2-
one, 13-methylpentadecan-2-
one
Nutrient
broth
without
glucose
(Weise et al
2012)
77
3.1.2 Microbiological, Biochemical and Molecular Techniques Identfies the Uropathogens
The standard, clinical and environmental strains were reconfirmed by known microbiological, biochemical and
molecular techniques as shown in Table 3.2.
Table 3.2 Results of the tests performed for a few uropathogens
S. No E. coli Klebsiella Proteus Pseudomonas Salmonella Shigella Staphylococcus
1.
Catalase positive
(+)
Catalase positive
(+)
Catalase positive
(+)
Catalase positive
(+)
Catalase positive
(+)
Catalase positive
(+)
Catalase positive
(+)
2. --- --- ---
Cetrimide Agar-
positive (+)
--- --- ---
3.
Eosin Methylene
Blue- Metallic
green sheen
---
Eosin Methylene
Blue – Pink
colonies
--- --- --- ---
4. Indole positive (+) Indole negative (-) Indole negative (-) Indole negative (-) Indole negative (-) Indole negative (-) Indole negative (-)
5. Urease negative (-)Urease positive (+) Urease positive (+) Urease negative (-) Urease negative (-) Urease negative (-) Urease negative (-)
6.
Methyl red
positive (+)
Voges-Proskauer-
negative (-)
Methyl red–
negative (-)
Voges-Proskauer-
positive (+)
Methyl red–
positive (+)
Voges-Proskauer-
negative (-)
Methyl red– negative
(-)
Voges-Proskauer-
negative (-)
Methyl red–
positive (+)
Voges-Proskauer-
negative (-)
Methyl red–
positive (+)
Voges-Proskauer-
negative (-)
Methyl red–
negative (-)
Voges-Proskauer-
positive (+)
7. Motile Non-motile Motile Motile Motile Non-motile Non-motile
78
Table 3.2 (Continued)
S. No E. coli Klebsiella Proteus Pseudomonas Salmonella Shigella Staphylococcus
8.
Salmonella
Shigella Agar-
colourless colonies
---
Salmonella Shigella
Agar- colourless
colonies
---
Salmonella Shigella
Agar- Colourless
colonies with
black centre
Salmonella Shigella
Agar- Pink
Colonies
---
9. ---
Simmons’ Citrate
Agar
Butt-Green
Slant-Blue
Phenylalanine
Deaminase positive
(+)
---
Simmons’ Citrate
Agar
Butt-Green
Slant-Blue
Simmons’ Citrate
Agar
Butt-Green
Slant-green
Mannitol salt agar-
positive (+)
10.
Triple Sugar Iron
Butt-yellow
Slant-yellow
Triple Sugar Iron
Butt-yellow
Slant-yellow
Triple Sugar Iron
Butt-yellowish
green
Slant-yellow
Triple Sugar Iron
Butt-Red
Slant-Red
Triple Sugar Iron
Butt-yellow
Slant-Red
Triple Sugar Iron
Butt-yellow
Slant-red
Triple Sugar Iron
Butt-yellow
Slant-yellow
11. 16SrRNA - √ 16SrRNA - √ 16SrRNA - √ 16SrRNA - √ 16SrRNA - √ 16SrRNA - √ 16SrRNA - ---
12. Strain confirmed Strain confirmed Strain confirmed Strain confirmed Strain confirmed Strain confirmed Strain confirmed
Catalase Positive (+): Bubble Formation, Negative (-): No bubble formation. Indole Positive (+): Red Colour, Negative (-):
No Colour change. TSI Positive (+): Black Butt (H2S production) and Pink Slant, Negative (-): Yellow or no change in
Butt/Slant colour. MR Positive (+): Red colour, Negative (-): No Colour change. VP Positive (+): Copper colour, Negative (-):
Red colour/No colour change.
79
3.2 SOLVENT EXTRACTION WAS THE SUITABLE METHOD
FOR VOC EXTRACTION FROM CULTURE
Carbonyl compounds like 3-methylbutanal, 2-methylbutanal,
formaldehyde and acetaldehyde are the known volatile compounds produced
by Proteus (see Table 3.1). Since it was not known which of these carbonyl
compound(s) is produced under the conditions used in this study, the head
space of the culture was targeted for isolation and identification of the
compound(s).
To capture the VOCs from the headspace, based on the literature
reports, activated charcoal powder was first chosen as a suitable adsorbent.
However, even when exposed upto 250 mL of culture, the adsorbed
compound(s) could not be eluted in spite of using different solvents like
diethyl ether, n-hexane, dichloromethane, acetonitrile, dimethyl sulphoxide,
methanol and ethanol. Simulation using pure aldehyde compounds showed
that such adsorption and desorption was effective only in millimolar
concentrations; at lower concentrations the efficiency of adsorption was
reduced to a greater extent. The same was the case when an alternative
adsorbent, silica was used. Hence, different approaches for trapping of the
compound(s) either from the head space or the spent medium was
experimented.
When the culture headspace from closed vials or centrifuge tubes or
rubber corked conical flasks was sparged through the solvents using a syringe
or allowed to flow through and then analyzed by GC, no characteristic
chromatogram, especially pertaining to the known aldehyde compounds of
Proteus, could be obtained. However, when the same set-up was tested using
pure compounds detection at millimolar concentrations was possible.
80
The failure to capture the released VOCs from bacteria was
attributed to the low abundance in ppm or ppb levels as well as to the poor
efficiency of the systems used. Hence direct extraction of VOCs from the
culture (present in equilibrium with the vapour phase) into solvents
compatible with gas chromatography and mass spectroscopy (MS) analysis
was attempted. Out of the solvents tested, DCM was found to be best suitable
for extracting the VOCs from bacterial culture. The GC, GC-MS analyses of
the solvent phase showed the presence of various compounds including
aldehydes of Proteus.
3.3 GAS CHROMATOGRAM IDENTIFIED THE
CHARACTERISTIC COMPOUNDS OF PROTEUS AND
SALMONELLA CULTURE EXTRACT
The gas chromatograms for medium blank, positive and negative
samples revealed the presence of characteristic compounds of Proteus. From
the gas chromatograms (Figure 3.1), a small but distinct peak at 8.227 min
could be observed for Proteus, which was not seen in the medium as well as
the negative sample, i.e Salmonella enterica subspecies. The identity of the
compounds separated in GC, as obtained from the GC-library is shown in
Table 3.3.
The characteristic peak found at Rt 8.227 min in Proteus sample
was identified as 2-methylbutanal. It was resolved at an average concentration
of 330 ppb, indicating that it was either not an abundant VOC or it is highly
volatile.
81
Table 3.3 Comparative VOC profiles of Proteus with medium and
negative control
Blank (LB medium) Proteus Salmonella
Rt
(min)
Compound
Rt
(min)
Compound
Rt
(min)
Compound
7.779
Ethene, 1,2-
dichloro-
7.791
Ethene, 1,2-
dichloro-
7.795
Ethene, 1,2-
dichloro-
Nil - 8.227 Butanal, 2-Methyl- Nil -
10.645
Carbon
tetrachloride
10.653 Carbon tetrachloride 10.652 Carbon tetrachloride
11.457
Pentane, 3-
Ethyl-
Nil - 11.456 Pentane, 3- Ethyl-
Nil - 14.762 Benzene, Methyl 14.765 Benzene, Methyl
Nil - Nil - 17.308 Ethyl benzene
Nil - 18.485
Benzene, (1-
Methylethyl)
18.488
Benzene, (1-
Methylethyl)
20.639
Benzene, 1,4-
dichloro
20.640
Benzene, 1,4-
dichloro
20.645
Benzene, 1,4-
dichloro
Nil - Nil - 23.364 Naphthalene
Medium Blank Proteus
Figure 3.1 (Continued)
82
Salmonella
Figure 3.1 The gas chromatogram of Dichloromethane extracts of LB
(media control), Proteus (positive sample) and Salmonella
(negative control) cultures. The unique peak for Proteus
culture at 8.227 min is denoted by an arrow
3.3.1 Identification of 2-methylbutanal as Specific VOC for Proteus
using GC-MS and FT-IR
The volatile compounds extracted into DCM were directly
subjected to GC-MS analysis. Figure 3.2 (a) shows the gas chromatogram of
the DCM-extract of Proteus having 3 peaks at 1.57, 1.78 and 2.92 min. The
mass spectrum at each Rt showed that the fraction at 1.78 min was from a
compound with a molecular mass ion of 86 (shown in Figure 3.2 (b)).
Matching retention indices and fragmentation pattern with the spectral library
indicated that the compound could be 2-methylbutanal. Its low abundance,
however, pointed out that the detection limit of the fluorescence assay to be
developed should be in ppb level. Previously, it has been reported that 2-
methylbutanal is one of the VOCs released by Proteus when grown in similar
complex medium (Thorn et al 2011).
83
Figure 3.2 GC analysis of DCM extract from Proteus culture and the
mass spectrum of the sample at retention time 1.78 min (a)
shows the gas chromatograms of volatile organic
compounds in the DCM extracts of Proteus. The
characteristic peak at 1.78 min in Proteus was further
analyzed for identification of mass (b) is the mass spectrum
of the unique compound for Proteus at Rt 1.78 min in GC.
The fragment peak at 57 m/z is the base peak showing 100%
abundance and corresponding to 2-methylbutanal. No other
carbonyl compound was detected from the other peaks
The FT-IR spectra of 2-methylbutanal, DCM extracts of LB,
Proteus vulgaris and Proteus mirabilis after eliminating DCM peaks are
84
shown in Figure 3.3. In the spectra of 2-methylbutanal, the peak at 1723 cm−1
is characteristic to strong C=O stretching representing the presence of
carbonyl group. The two peaks at 2684 and 2829 cm−1
are attributed to the
medium intensity =C-H stretching indicating an aldehyde. The absorption
peaks at 1421 and 2976 cm−1
are representing a variable C-H bending and a
strong C-H stretching respectively, which corresponds to alkane. The other
peaks in the spectrum corresponded with those of the blank indicating the
organic compounds released from the medium. The spectra of Proteus
vulgaris and Proteus mirabilis also showed peaks at 1721 and 1725 cm−1
for
C=O stretching.
The absorption peaks corresponding to =C-H stretching (2686 and
2827 cm−1
for Proteus vulgaris; 2686 and 2830 cm−1
for Proteus mirabilis)
indicated an aldehyde. Similarly, the absorption peaks representing a variable
C-H bending (1423 cm−1
for P. vulgaris and 1427 cm−1
for P. mirabilis) and a
strong C-H stretching (2985 cm−1
for P. vulgaris and 2986 cm−1
for P.
mirabilis) corresponding to alkanes were observed. This comparative analysis
of pure 2-methylbutanal with the DCM-extract of Proteus confirmed the
presence of an aldehyde under the described conditions. The Proteus samples
showed the presence of carbonyl group along with the =C-H stretch
corresponding to an aldehyde which is similar to the standard 2-
methylbutanal. Together, the analysis was suggestive of the presence of 2-
methylbutanal as the volatile organic compound in low abundance in the
cultures of Proteus grown in LB.
85
Figure 3.3 FT-IR spectra of P. mirabilis and P. vulgaris solvent extract
in comparison with 2-methylbutanal and medium blank.
The Proteus samples showed the presence of carbonyl group
along with the =C-H stretch corresponding to an aldehyde
which is similar to the standard 2-methylbutanal. Together,
the analysis was suggestive of the presence of
2-methylbutanal as the volatile organic compound in low
abundance in the cultures of Proteus grown in LB
3.3.2 Comparative Analysis of the Gas Chromatogram of
2-methylbutanal and DCM-extract of Proteus Confirmed
2-methylbutanal as the Characteristic VOC of Proteus
To confirm that the volatile compound from Proteus was
2-methybutanal, GC was carried out using pure 2-methylbutanal as well as
DCM-extract. A distinct peak at 2.25 min in the gas chromatogram of the
DCM-extract from Proteus culture matched with the peak at 2.30 min of pure
2-methylbutanal (Figure 3.4), indicating a good match and proving that the
VOC released by Proteus under the optimized condition was 2-methylbutanal.
86
Figure 3.4 Comparative chromatogram of the culture extract of
Proteus and standard 2-methylbutanal. The gas
chromatographic peak at 2.3 min from Proteus culture
extract matched with the peak for 2-methylbutanal
3.4 DETECTION OF VOLATILE CARBONYLS USING
COLORIMETRIC AND FLUORIMETRIC REAGENTS
Volatile carbonyl compound was identified initially using
colorimetric reagent. Owing to the lower abundance of these compounds from
culture an alternative assay using fluorescent reagent was standardized. The
results of both the methods are explained below.
3.4.1 Colorimetric Reagent Detected Micromole Levels of VOCs
Once 2-methylbutanal was confirmed to be the characteristic VOC
of Proteus, first a colorimetric assay using 2,4-dinitrophenyl hydrazine was
attempted. It was able to differentiate volatile carbonyl compounds from the
other non-carbonyl compounds when tested in pure form. Hence when silica
coated discs were used for adsorption of the vapours of pure compounds and
reacted with 2,4-DNPH, colour differentiation was observed as shown in
Figure 3.5. However, the sensitivity measurement indicated that the
methodology could be used to detect only PPM levels of these volatile
87
compounds, which was apparently inadequate based on the abundance of
2-methylbutanal in micromole levels in the culture medium.
Figure 3.5 Spot detection of 2-methylbutanal vapours with 2,4-DNPH
produced a bright yellow coloured product while with
alcohol and blank no bright yellow coloured product was
formed. Standard 2-methylbutanal ranging from 20-50
µmoles were spotted using 2,4-DNPH
3.4.2 Standardization of the Fluorescent Reagent Showed Better
Sensitivity
The colorimetric indicator was then replaced by the fluorescent
reagent, dansyl hydrazine (DNSH) for its superior sensitivity in nanomole
range. The DNSH reagent prepared by dissolving DNSH in acetonitrile along
with acetic acid at a pH 3.4 differentiated the carbonyls and
non-carbonyls more effectively than only the dye without acidification
(Figure 3.6). When headspace was targeted, apart from being poorly
reproducible, lower concentrations were not easy to be adsorbed and detected
using silica discs even with this sensitive reagent. Therefore detection of
VOCs in vapour phase was given up after a lot of trails. Instead solution
phase, which is in equilibrium with the vapour phase, was targeted.
88
Figure 3.6 Comparative fluorescence response of DNSH reacting with
carbonyl compounds (positive) and non-carbonyl
compounds (negatives) or DNSH reacting under acidic
condition. The signal-to-noise ratio was high when DNSH
reacts under acidic conditions. This formed the basis of the
DNSH reagent preparation
3.4.2.1 Identification of carbonyl compounds using fluorescent reagent
2,4-DNSH
Two carbonyl compounds (2-methylbutanal and tridecanone)
showed distinct fluorescence shift from orange (blank) to green when viewed
at 330 nm in a UV transilluminator; other compounds like acids and alcohols
did not cause this fluorescence shift as shown in Figure 3.7.
As can be seen in Table 3.4, the sensitivity of the assay was found
to be ranging from 1 to 100 nmoles for various aldehydes and ketones in their
pure form. In the case of 2-nonanone the sensitivity was much lower at 580
nanomole. The literature survey showed that many VOCs are produced in
these ranges by bacteria including Proteus.
89
Figure 3.7 The picture shows the fluorescence obtained from the
reaction of DNSH with pure compounds. The DNSH reagent
reacted with the carbonyl compounds to form respective
hydrazones showing green fluorescence while blank and
acids form no product retaining the reagent’s orange
fluorescence
Table 3.4 Assay sensitivity for various carbonyl compounds
S. No. Compound Detection limit ±2 nanomoles
1. Benzaldehyde 20
2. Decanal 30
3. Hexanal 8
4. Nonanal 6
5. 2-methylbutanal 1
6. Acetophenone 17
7. 2- heptonone 7
8. 2- nonanone 580
9. 2- pentanone 98
10. 2- tridecanone 8
3.4.2.2 Development of 96-well based fluorimetric assay for detection
of carbonyl compounds using the optimized reagent
Since surveillance demands high-throughput methods, the assay
was adapted to the standard 96-well microtitre plate format compatible to be
90
read using a fluorescence plate reader or imaged with a UV transilluminator.
The assay was performed in this new format with the pure compounds
consisting of aldehydes (benzaldehyde, hexanal, nonanal, and
2-methylbutanal), ketones (2- heptonone, 2- nonanone, 2- tridecanone,
2- undecanone, 2- pentanone and acetophenone), acids (propionic acid,
phosphoric acid and butyric acid) and alcohols (propanol, ethanol, methanol
and butanol) with suitable blank and controls showed the green shift for
carbonyls. Figure 3.8 shows the fluorescence image of the test plate where the
carbonyl compounds showed the green fluorescence whereas, the alcohols
and acids showed only orange fluorescence of the reagent.
Figure 3.8 Differentiation of carbonyl (green fluorescence) and non-
carbonyl compounds (orange fluorescence). Carbonyl
Compounds used: Hexanal, Nonanal, 2-methylbutanal,
Benzaldehyde, Decanal, 2-nonanone, 2-tridecanone,
2-heptanone, 2-undecanone, 2-pentanone, Acetophenone,
Non-carbonyl compounds- alcohols: Propanol, Ethanol,
Methanol, Butanol and acids: Propionic acid, Phosphoric
acid and Butyric acid all added in duplicates
3.4.2.3 Fluorescence shift was observed between Proteus and non-
Proteus organisms
After the development of a simple fluorescence method for Proteus
detection in culture, the method was tested for its utility as diagnostic method
for Proteus and non-Proteus organisms. The Em λmax of DNSH under acidic
91
condition (pH 3.4) was 564 nm and when it was reacted with carbonyl
compounds (pure or in culture), the Em λmax shifted to between 510 to 535 nm
(bright green fluorescence), while for a variety of acids and alcohols it was
between 545 to 570 nm (orange fluorescence). The Figure 3.9 (a) below
shows the representative spectra of the carbonyl and non-carbonyl compounds
and Figure 3.9 (b) shows those of bacterial cultures. The shift to green
fluorescence from orange, specific to carbonyl compounds among commonly
reported VOC types, was also convenient for visual observation. For the
routine assay, ProteAl, excitation was set at 336 nm and the fluorescence shift
was measured at 531 nm.
Figure 3.9 Determination of Ex. /Em. λmax for pure compounds and
bacterial cultures. The emission spectra on the left
(excitation 336 nm) (a) are of pure carbonyl (hexanal and
2-heptanone), acid (propionic acid) and alcohol (butanol)
compounds after reaction with DNSH under the assay
conditions. The emission spectra on the right (b) are of the
cultures of Proteus, UPEC and Salmonella after reaction
with DNSH under the assay conditions
92
3.4.2.4 ProteAl is found specific to Proteus among the commonly
occurring uropathogens
Confirming the performance of the simple fluorescence-based
DNSH method devised for carbonyls with respect to specificity and
sensitivity using pure compounds, it was applied to the uropathogens, E.coli,
Klebsiella, Pseudomonas, Proteus and Enterobacter and other pathogens,
Shigella, Salmonella and Staphylococus. When the strains were grown in LB
medium at 37 °C for 7 h, only Proteus (mirabilis and vulgaris) showed the
distinct green fluorescence upon addition of the reagent indicating the
presence of carbonyl compounds. Encouraged by the promising results, more
number of Proteus strains (both clinical and standard) were tested along with
other negative strains as shown in the Figure 3.10. As can be seen, only
Proteus strains scored positive in this test, thus making the test 100% specific
and sensitive in this limited trial. It is also to be noted that in spite of the
capability of other organisms to produce carbonyl compounds, under the
conditions used, only Proteus was able to produce either one or more such
compounds.
Figure 3.10 Performance of DNSH reagent on a set of standard strains
distinguishing Proteus (A2 to A11 & B2 to B11) with green
fluorescence from the LB medium blank (A1 & B1) and
negatives UPEC (A12&B12, D1 to D3 & E1 to E3),
Klebsiella (D4, E4, D5 & E5), E. coli (D6 to D9 & E6 to E9)
and Salmonella (D10 to D12 & E10 to E12) showing orange
fluorescence
93
When Proteus grown in various media like LB, NB, AB and TSB
were assayed, the differentiation of the positive and the negative was
minimally significant quantitatively in AB and NB medium while no change
was observed in TSB medium. Visual differentiation of positive and negative
was significant only in LB medium. The fluorescence values obtained for
blank and Proteus are shown as bar diagram in Figure 3.11.
Figure 3.11 Proteus cultures grown in LB medium showed higher
fluorescence response compared to the blank and other
common growth media NB, AB and TSB
3.4.2.5 The amount of 2-methylbutanal from Proteus culture was
quantified
The fluorescence response of Proteus and other organisms to
ProteAl showed effective differentiation between the blank, positives and the
negatives as shown in the Figure 3.12.
94
Figure 3.12 The fluorescence response of Proteus and other organisms
after ProteAl. Proteus species showed maximum
fluorescence compared to the medium blank and other
bacteria, which have comparable response levels
The fluorescence spectra of ProteAl for 2-methylbutanal and
Proteus VOC matched well as shown in Figure 3.13(a). The sensitivity of the
method was ~1 nmol and the measurements of 2-methylbutanal was linear up
to ~200 μmol with 0.99 regression Figure 3.13(b). The amount of VOC
released by Proteus was calculated using this standard graph. The assay at
various time points of growth, from 0-24 h, as shown in Figure 3.13(c),
revealed that detectable amounts of the compound was present in the culture
from 4th
h (~1 nmol) in the mid-log phase, and increased linearly up to 10 h
(~15 nmol). Only Proteus showed the release of 2-methylbutanal in
nanomoles that reached a maximum of 13 nmol in broth culture and assay
conditions. Being a volatile compound, the actual amount of 2-methylbutanal
released by the organism could be hundreds of nmoles. From the point of
view of diagnostic test, detection requires 5 h of growth for a sensitive
fluorimeter and 7 h for observation using UV illuminator, even when the
inocula/samples contain as low as 102
cells.
RFU
Blank
Proteus vulgaris
Proteus mirabilis
Salmonella
UPEC
Klebsiella
Pseudomonas
95
Figure 3.13 The set of data in this composite figure compares the
properties of pure 2-methylbutanal with those of DCM-
extract from the Proteus culture (a) shows the fluorescence
emission spectra of DNSH reacted with 2-methylbutanl
matched with that of the spectrum obtained from the
reaction of DNSH with the culture (b) is the standard graph
for 2-methylbutanal using ProteAl assay showing sensitivity
up to 1 nmol and good linearity up to 20 nmol (c) shows the
graph of the fluorescence response for bacterial cultures
using ProteAl performed every hour up to 24 h
3.4.2.6 The volatile component responsible for green fluorescence in
ProteAl was confirmed to be 2-methylbutanal
The fact that the dye was reacting only with the released
2-methylbutanal but not with the cell components was apparent, as culture-
free supernatant was positive and the cells were negative for the assay as
shown in Figure 3.14. The fluorescence intensity reduced due to
centrifugation.
96
Figure 3.14 2-methylbutanal is seen as a secretary VOC product as only
the culture supernatant but not the cells of Proteus yielded
green fluorescence (wells 7&8) after ProteAl
3.4.2.7 The characteristic 2-methylbutanal was highly volatile
The fact that ProteAl was reacting with only volatile
2-methylbutanal in the culture was evident by the green fluorescence seen in
samples maintained at 4 °C and on ice but not in those maintained at room
temperature and assayed after 1 h or 2 h, as shown in the Figure 3.15(a)
below, the cold conditions obviously prevented the evaporation. The result
was similar to that of pure compound 2-methylbutanal dissolved in the culture
medium as shown in Figure 3.15(b).
Figure 3.15 Volatility of 2-methylbutanal released by Proteus in
comparison with pure compound. (a) shows that the
fluorescence intensity of DNSH-derivatized carbonyl
compound(s) in the Proteus cultures kept at room temperature
(27 ºC), fridge (4 ºC) and on ice (0 ºC) reduces drastically as a
function of temperature as well as duration of storage
indicating volatile nature (b) shows the fluorescence intensity
of standard 2-methylbutanal experimented similar to Proteus
culture at different temperatures
97
3.5 VALIDATION OF THE ASSAY USING VARIOUS
CLINICAL UROPATHOGENS
Following the confirmation of 2-methylbutanal as a biomarker for
Proteus spp. the ProteAl was validated with more number of strains. As can
be seen from the Figure 3.16, laboratory-level validation using 39 standard
strains and 56 samples of clinical bacterial isolates consisting of commonly
occurring uropathogens such as E. coli, Proteus spp., Pseudomonas
aeruginosa, Klebsiella spp., Enterobacter, Citrobacter, Staphylococcus spp.
and Salmonella spp. showed absolute specificity and sensitivity (using the
formula given in section Materials and Methods) for the genus Proteus. The
concentrations of 2-methylbutanal for the cut-off with 100% sensitivity and
specificity is approximately 55 µM, where, the RFU is >10,000 for positives
and less than 10,000 for negatives.
Figure 3.16 Validation of ProteAl using 39 standard strains and 56
clinical isolates as given in table 3.5. Out of the 95 strains
screened, 27 strains gave positive results indicated by bright
green fluorescence. Others including uropathogenic strains
showed the background orange fluorescence
The confidence intervals for the positive, Proteus and the negatives
were calculated using 28 samples of each in triplicates. The confidence
interval for the sensitivity and specificity of the assay was calculated using 28
samples (taken in triplicate). Thus, the 99% confidence interval for sensitivity
and specificity of all positive and negatives are between 0.941-1.039.
98
Table 3.5 Validation of ProteAl using standard and clinical strains
Table 1 Validation of ProteAl using standard and Clinical strains
Well
No.
Organism
ProteAl (RFU)
Well
No.
Organism
ProteAl (RFU)
Well
No.
Organism
ProteAl (RFU)
Trial
1
Trial
2
Trial
1
Trial
2
Trial
1
Trail
2
A1 Medium blank 7234 8241 C9 K. pneumoniae (MTCC 2653) 8281 7089 F5 *P. aeruginosa (326543) 8204 7096
A2 E. coli (ATCC 25922) 7826 8315 C10 *P. mirabilis (328271) 18401 11032 F6 *P. aeruginosa (326604) 8121 7336
A3 P. aeruginosa (ATCC 27853) 7730 7662
C11
K. pneumoniae (MTCC 661) 8345 9021
F7
*P. aeruginosa
(121602592)
7873 7327
A4 S. flexneri (ATCC 29508) 8375 7729 C12 P. aeruginosa (MTCC 424) 8685 7085 F8 *P. mirabilis (5164) 13838 16615
A5 S. flexneri (MTCC 9543) 8401 7734 D1 *P. vulgaris (121103217) 11232 15289 F9 *S. typhimurium (327753) 8219 8007
A6 P. mirabilis (ATCC 7002) 13774 15241 D2 P. aeruginosa (MTCC 1934) 8338 7844 F10 *S. typhimurium (328897) 8471 8208
A7 S. paratyphi (MTCC 3220) 7931 7869 D3 S. flexneri (MTCC 1457) 8447 7256 F11 *P. mirabilis (5166) 16296 11272
A8 S. enterica (MTCC 3231) 8259 7549
D4
S. flexneri (MTCC 9543) 8129 6951
F12
*S. typhimurium
(121703058)
8386 7909
A9 P. mirabilis (ATCC 29906) 19267 14619 D5 S. pneumoniae (MTCC 655) 8617 9430 G1 *S. typhimurium (18946) 8173 7854
A10 E. coli (MTCC 723) 7394 7017 D6 S. pyogenes (MTCC 1927) 9819 9099 G2 * Enterobacter (14736) 8590 7178
A11 E. coli (MTCC 443) 7623 8229 D7 S. enterica (MTCC 3224) 9818 9980 G3 *P. mirabilis (5169) 10112 16873
A12 E. coli (ATCC 13534) 8218 8382 D8 *P. mirabilis (15322) 13310 15802 G4 * Enterobacter (339969) 8068 8246
B1 P. vulgaris(ATCC 6380) 13416 12288
D9
L. monocytogenes
(MTCC 839)
8002 9433
G5
*P. mirabilis (281) 12381 18743
B2 S. aureus (MTCC 3160) 7605 7901 D10 S. aureus (ATCC 25923) 8309 8242 G6 * Citrobacter (24361) 8534 7408
B3 K. pneumoniae (ATCC 13883) 8440 8005 D11 E. coli (MTCC 901) 8390 7989 G7 *Citrobacter(328327) 8716 7517
B4 P. vulgaris (MTCC 1771) 12981 12476 D12 *P. mirabilis (806970) 12492 13234 G8 *E. coli (311475) 7946 7112
B5 S. aureus (MTCC 3160) 8577 8474 E1 *E. coli (21728) 7956 9475 G9 *E. coli ( 21595) 8864 8502
B6 S. aureus (MTCC 6908) 8654 7718 E2 *P. mirabilis (122101203) 13055 15298 G10 *P.mirabilis (282) 11938 20535
B7 S. chromogenes (MTCC 6153) 8669 8876 E3 *E. coli (21748) 8043 8335 G11 *E. coli (121201233 ) 8783 7321
B8 S. haemolyticus (MTCC 8924) 7432 8412 E4 *E. coli (25922) 8001 8254 G12 *P.mirabilis ( 803) 13259 13946
B9 P. mirabilis (ATCC 336874) 18682 16120 E5 *P. mirabilis (5155) 10596 16132 H1 *E. coli (318253) 8066 7642
B10 S. epidermidis (MTCC 435) 7624 8792 E6 S. aureus (25923) 8450 9152 H2 *P. mirabilis (487 ) 17231 16465
B11 *P. mirabilis (6878) 18187 15111 E7 *P. mirabilis (3401488) 10587 15056 H3 *E. coli (318304) 8336 7977
B12 E. coli (MTCC 568) 7395 8635 E8 *P. aeruginosa (27853) 8060 9715 H4 *E. coli (318429) 8806 7372
C1 E. coli (MTCC 1687) 9822 8178 E9 *P. mirabilis (5156) 24917 12583 H5 *P. mirabilis (981447) 16962 17126
C2 *P. vulgaris (307316) 12610 24749 E10 *E. coli (340266) 8166 8217 H6 *E. coli (318510) 8257 7626
C3 E. coli (MTCC 433) 8941 8254 E11 *E. coli (111406070) 8081 8570 H7 *E. coli (320149) 8276 8818
C4 *P. mirabilis (121101096) 20973 24003 E12 *E. coli (111706439) 8045 7422 H8 *P. mirabilis ( 494750) 14519 14311
C5 E. coli (MTCC 9537) 9591 8299 F1 *Klebsiella (340053) 8083 7470 H9 *E. coli (320487) 9455 7401
C6 K. pneumoniae (MTCC 3384) 9132 8347 F2 *Klebsiella (4483) 8618 7389 H10 *E. coli (320652) 8568 7327
C7 *P. mirabilis (332049) 11746 22184 F3 *Klebsiella (121103186) 8276 7809 H11 *E. coli (320904) 8257 7788
C8 K.oxytoca (MTCC 2275) 8151 7629 F4 *P. mirabilis (5163) 16255 15389 H12 *E. coli (320923) 8449 7231
*M/s Lister Metropolis Laboratory, RFU – relative fluorescence unit
99
Table 3.6 Environmental sample details and the strains identified
Location
Type of
waste
No. of strains
based on colony
morphology
No. of strains identified using biochemical and microbiological tests
Staphylo-
coccus
Proteus E. coli Pseudomonas Bacillus Others
Madipakkam,
Chennai
Garbage
disposal
70 7 2 5 2 5 49
Pallikaranai
Chennai
Soil at
hospital site
67 4 3 5 2 - 53
Taramani
Chennai
Soil from lab
disposal
63 7 4 4 5 5 38
Total 200 18 9 14 9 10 140
100
Around 200 environmental strains were screened using ProteAl
assay out of which 9 strains were found to be Proteus. The Table 3.6 provides
the details of the samples and the identified strains.
Figure 3.17 Validation of environmental strains. Wells G 4, 5 and H 4, 5
are duplicates of standard positive control, P. mirabilis and
P. vulgaris respectively. Only Proteus strains were identified
by the green fluorescence while the others gave orange
fluorescence
3.6 RELEASE OF 2-METHYLBUTANAL BY PROTEUS
THROUGH ISOLEUCINE METABOLIC PATHWAY
On the basis of structural considerations, it is reported that
2-methylbutanal and 2-methylbutanol are derived from isoleucine. The actual
pathways for their synthesis and the biosynthetic enzymes have not been
identified in bacteria but a pathway has been described in yeast and
Lactococcus lactis. This proposed pathway begins with the action of branched
chain aminotransferases (BCATs) (Andrej et al 2012) that removes the amino
group from the respective amino acids and subsequently, there is a
decarboxylation to produce the aldehydes and a reduction to form the
101
alcohols. Aminotransferase enzymes use α-ketoglutarate as amino group
acceptor and thereby produce glutamate. The α-keto acids of the branched-
chain amino acids have been recognized to have cheesy flavours (Singh et al
2003). They are further metabolised to other flavour compounds such as
aldehydes, alcohols and carboxylic acids, but also into hydroxyl acids, which
are not considered to contribute to flavor. The putative pathway is shown in
Figure 3.18.
Figure 3.18 The putative isoleucine catabolic pathway involved in the
production of 2-methylbutanal in Proteus. The metabolic
pathway uses the enzymes aminotransferase and α-ketoacid
decarboxylase for conversion of acid to an aldehyde
3.6.1 In Silico Analyses Revealed the Presence of the Enzymes of
Isoleucine Catabolism in Proteus
Reports suggested that 2-methybutanal was released by isoleucine
pathway in yeast, insilico analyses were conducted to identify if such a
pathway was involved in Proteus also. The gene coding for the enzyme(s)
responsible for the production of 2-methylbutanal identified in Lactococcus
102
lactis was blasted with P. mirabilis sequence. The sequence of the enzymes
aminotransferase of Lactococcus lactis (Uniprot ID: F2HLX1) when blasted
with Proteus mirabilis (Uniprot ID: B4F1U2) using the CLUSTAL W2 tool
gave 46% similarity. The sequence similarity of alpha-ketoacid decarboxylase
(kdcA) Lactococcus lactis (Uniprot ID: Q6QBS4) with Proteus mirabilis
(Uniprot ID: S5UQF3) was 53%. The protein sequence match between both
the organisms is given in the Table (3.7 and 3.8). However, there was no
report on the presence of these enzymes in P. vulgaris.
Table 3.7 Multiple sequence alignment of aminotransferase in
Lactococcus lactis and Proteus mirabilis sequence
103
Table 3.8 Multiple sequence alignment of alpha-ketoacid decarboxylase
in Lactococcus lactis and Proteus mirabilis sequence
104
3.6.2 Enhanced Fluorescence Due to Isoleucine Supplementation in
the Growth Medium
After ascertaining the presence of genes for 2-methybutanal
pathway, LB medium was supplemented with isoleucine for activating the
production of 2-methylbutanal. There was an increase in the fluorescence for
Proteus spp. up to a concentration of 15mM isoleucine compared to
unsupplemented LB (Table 3.9; Figure 3.19).
Table 3.9 Concentration of isoleucine and the fluorescence response of
ProteAl
Concentration of
isoleucine (mM)
0 8 15 23 31 38 76
Blank
Trial 1 3899 4723 4366 3314 3297 3276 2994
Trial 2 5675 4952 4482 4445 4956 4861 4168
Trial 3 3695 4464 6537 3330 4267 3265 3138
Trial 4 5675 4952 4482 4445 4956 4861 4168
Proteus
Trial 1 24497 24694 32740 27202 32225 21138 12911
Trial 2 11798 12238 16965 17087 17626 11949 8501
Trial 3 27479 26832 34871 28601 25091 27287 20184
Trial 4 11798 13708 26637 16606 16366 18195 16473
Salmonella
Trial 1 5129 4848 6193 4490 4742 4766 4517
Trial 2 6616 5814 6269 5240 5558 5715 4822
Trial 3 4866 4664 6164 4692 4575 4546 4319
Trial 4 6616 6634 7263 6753 6468 6923 6376
105
However, above this concentration there was no distinct increase
but the fluorescence started to fall back to the level in normal LB. Salmonella
species which is also reported to possess similar genes did not show an
increase in fluorescence when grown in the supplemented media. While the
isoleucine concentration was varied and checked for the increase in
fluorescence, leucine and valine were also tested to check for specificity of
the activator. There was neither an increase nor decrease in fluorescence when
leucine and valine was supplemented. The bar diagram in Figure 3.20 shows
the comparative fluorescence response to ProteAl for LB and other
supplemented medium.
Figure 3.19 Fluorescence response for only Proteus increased after
addition of isoleucine in the LB medium while the negatives
and blank did not show any distinct effect. The profile
shows that the addition of isoleucine beyond 15 mM (peak
concentration) actually led to the reduction in the enzyme
activity
106
Figure 3.20 The bar-diagram indicates specific increase in fluorescence
of Proteus to ProteAl in LB -Ile medium compared to LB or
its supplementation with related branched chain amino
acids. It evidently shows that only isoleucine enhances
2-methylbutanal production
3.6.3 Enhancement of 2-methubutanal Production using Thiamine
Pyrophosphate Supplements
Several reports suggest that TPP acts as a catalytic cofactor for
alpha-ketoacid dehydrogenase. It catalyzes the decarboxylation of the
α-ketoacid. Hence its effect on 2-methylbutanal production when
supplemented in the LB medium was experimented with various
concentrations (0.5,1.0,1.5,2.0,2.5 mM). There was increase in fluorescence
even with the addition of 0.5 mM. However maximum increase in
fluorescence was obtained at 2 mM concentration as shown in the Figure 3.21
beyond which there was decrease in the fluorescence. Hence, the standardised
LB-TPP was prepared with 2 mM TPP in regular LB medium. The Table 3.10
gives the RFU obtained for Proteus when various concentrations of TPP was
supplemented.
107
Table 3.10 Concentration of Thiamine pyrophosphate and the
fluorescence response of ProteAl
Concentration
of TPP in mM
0 0.5 1.0 1.5 2.0 2.5
Blank
Trial 1 8188 8145 8103 8080 7773 7750
Trial 2 7943 8280 8298 8321 7883 7993
Trial 3 9700 9599 9174 8625 8453 8011
Trial 4 8860 9625 8384 8623 8638 7835
Proteus
Trial 1 13466 16166 17507 15009 18854 15046
Trial 2 14538 16441 17147 15557 21504 11649
Trial 3 13973 16260 16657 15116 19704 13346
Trial 4 14204 16121 15922 14523 17606 14715
Figure 3.21 Fluorescence increased as a function of Thiamine
pyrophosphate supplementation in the LB medium for
Proteus. The peak indicates theconcentration (2 mM) of TPP
for maximal production of 2-methylbutanal. Beyond 2 mM
of TPP there is a drastic reduction in 2-methylbutanal
production
108
3.6.4 LB-Isoleucine (LB-Ile) Medium Enhanced 2-methylbutanal
Production Compared to other Supplemented Medium
Different supplemented media including LB-Ile, LB-TPP and
LB-Ile-TPP were prepared with LB medium. LB when supplemented with
isoleucine and TPP individually showed enhanced fluorescence when
compared to ProteAl on regular LB medium. LB with Ile and TPP in
combination also gave enhanced fluorescence. However, maximum
fluorescence was obtained in LB supplemented with isoleucine without the
co-factor TPP. There was approximately two and a half fold increase in the
fluorescence value as shown in Figure 3.22. Hence this medium was found to
be the most suitable for enhancement of 2-methylbutanal production. The
RFU obtained in three different trials for LB and LB supplemented media are
given in the Table 3.11.
Figure 3.22 The picture shows the yield of 2-methylbutanal under
growth in LB, LB-Ile, LB-TPP, LB-Ile-TPP. While LB-Ile
showed the maximum 2-methylbutanal production in all the
three trials
109
Table 3.11 The fluorescence value of different supplemented growth
medium obtained in three trials
Medium LB LB-Ile LB-TPP LB-Ile-TPP
RFU Trial 1 12478 32740 18854 26746
RFU Trial 2 13218 30965 21504 20726
RFU Trial 3 14521 34871 19704 27387
3.7 TOTAL RNA WAS EXTRACTED BY PHENOL-
CHLOROFORM METHOD
To probe if the increase in 2-methylbutanal is due to transcriptional
or translational regulations, total RNA was extracted from 7 h grown culture
of P.mirabilis and P.vulgaris in LB, LB-Ile and LB-Ile-TPP medium . The
distinct bands of 23S, 16S and 5S subunits were observed as shown in
Figure 3.23. A few other bands on the gel denoted the smaller fragments of
RNA. The purity of RNA (A260/280) was approximately 2 measured in the
“Nanodrop”.
Figure 3.23 Ethidium bromide stained 1.5 % agarose gel shows the total
RNA extracted from Proteus. Lane 1 contains a 1Kb DNA
ladder. Lanes 2-4 and 5-7 contains RNA of P. mirabilis and
P. vulgaris respectively
110
3.7.1 Total RNA was Efficiently Reverse Transcribed to cDNA
Total RNA obtained from P. mirabilis and P. vulgaris grown in LB
and other LB supplemented medium was reverse transcribed with random
hexamers and the resultant cDNA was confirmed on agarose gel. The cDNA
of P. mirabilis and P. vulgaris appeared like a smear on the gel as seen in the
figure 3.24. The purity (A260/280) was approximately 1.9 in all the samples.
The concentration of cDNA for P. mirabilis grown in LB, LB-Ile and LB-Ile-
TPP were 200 ng/µl, 693 ng/µl and 1256 ng/µl respectively. The
concentration of P. vulgaris was 1664 ng/µl, 3537 ng/µl and 856 ng/µl
respectively. These samples were further diluted to contain approximately 10-
12 ng/µl and used as template for qPCR.
Figure 3.24 cDNA was synthesized from the total RNA of P. mirabilis
and P. vulgaris grown in LB or LB supplemented with Ile or
TPP. The cDNA preparations, which appear as smears in
agarose gel electrophoresis, was used as template for qPCR
amplification
111
3.7.2 Amplified Product Showed the Presence of α-ketoacid
decarboxylase (kdcA) Gene Transcript
Further, the gene transcript was amplified using the specific α-keto
acid decarboxylase primers. The amplified product of this gene transcript was
approximately 225 bp as seen in figure 3.25 a & b. This was sequenced in
both P. mirabilis and P. vulgaris. Figure 3.25 shows the sequence of the gene
transcript of α-keto acid decarboxylase in both P. mirabilis and P. vulgaris.
The BLAST analysis of the gene transcript obtained with the reported Proteus
mirabilis BB2000 showed 100% identity. The presence of this gene transcript
in P. vulgaris is reported for the first time in this study.
Figure 3.25 The PCR amplified product shows distinct bands
corresponding to the size of alpha-ketoacid decarboxylase
gene transcript at approximately 225 bp in P. mirabilis
(Fig. (a) lane 1 and (b) lanes 2&3) and P. vulgaris (Fig. (a)
lane 2 and Fig. (b) lanes 4&5)
112
>ENA|AGS58890|AGS58890.1 Proteus mirabilis BB2000 alpha-keto acid
decarboxylase : Location:1..1638
ATGATTACAGTTTTAGATTATTTATTAGTAAGATTAAAAGAGTTAGAAAT
TAAAACTATTTTTGGTGTTCCCGGCGATTATAATTTACCTTTTATTGGTGT
TGTTGATAATGATAAAGATATTCAATGGGTAGGAGCATGTAATGAATTA
AATGCATCATATGCTTGTGAAGGATACGCACGGATCAAAGGTTTTTCTGC
TCTGTGTACAACCTATGGAGTGGGGGAGTTAAGTGCGATAAATGGTGTT
GCTGGCGCCTTTGCAGAGCAGGTTCCTATTATTCATATTGTTGGCGCGCC
TTCTCAGTCAAAGCAAGAGAAAGGAAAAACATTACATCATTGTTTAGCG
ACGGGTAGGTTTGATGCCTTTGAAAAAATGTATCGTCATATTTCAAAAAC
AACGGCTGTATTAACATATCACAATGCGACGGAAGAAATTGATAGAGTA
TTAGAAACATTGTGGCGTTATCGATATCCGGTTTATTTATTAATACCAGA
GGATGTCGGTGTGATGAAAGTTAATAAACCAAAGTTACCATTACAATTA
ACATTACCTCAAAGTAATCCCGACGATTTAAATAAAGTTATTACTCTTCT
TGAAAATAAAATTAAGCAATCAAAATCACCATGTATTATTATTGGCGAA
CAAGTATCACGTTACCAATTAAGAAAACAAGTTGAGAATTTATTAGAAA
AAACTAATCTGCCATTTTTTACTGTATGGGGAAGTAAAGGGGTTGTTGAT
GAAGGGCGTCAACAGTATGGTGGAATATTATTTGGTGAATTATCTAATCC
ACAAGGTTTAGATTATATTATAAATTCTGATTTAATTATTAGTCTTGGGG
TGAGTTGGGATGAAGTTAATACAGCTGGATTTACCTTCGACGTTCCCACA
CAAAATTGCTATCAATTTTATGATACTTATAGCTTAATTGAGGAAGAGAA
GATTTATGGCGTTTCTTTACTCGATATGCCTAACGCCTTATTAGCCCTTGA
CTATATTTATCCCCACAACATAGCGTTACTACCGCAAAAAATAGTACCGC
CTGATTGGCAAGGACTGATAAAAATAGATTCTATTCCTCTTCTGTTAGAT
AAAGTCCTTGATGATAATTCGGTTATTCTTGCTGAAGCAGGTAATGCTTT
TTTATGTGCTGTTAATCATATATTTTCTGGTAACAGTCAATTAGTGGTCA
GTAATATTTGGGCATCCATTGGTTATACTTTACCCGCCGCATTAGGTGTT
ACTCTTGCATTAGAAAACCAAGGACGTGCCTTTGTTGTTATTGGTGATGG
TGCATTTCAGATGACTGCACAAGAGCTTTCTACTTTATTACGCTTAAAAC
TCAATCCCGTTATTTTTATTGTTAATAATCAAGGTTACGCATTTGAAAAG
ATCTTTTACGGGCCTAAAGATACCTTTAATGATATCCAAAACTGGAATTA
CTCACAGTTACCTGAGCTATTTAATTGTGATGCTTATAGTGTGAAAGTGG
ATAGTCTAGAAGCGTTAGAAACCGTATTACCTTTATTAAAAGTGCATCAA
GATAAACTGTGCCTTGTTGAACTTGATATGGATAAACATGACTATTCGGA
GCCAATCAGTGAATTTATTGCGTTGCTTAATCAGTATAAATGA
Figure 3.26 Sequencing results of alpha-ketoacid decarboxylase gene
transcript. The red coloured basepairs denotes the sequence
of kdcA gene transcript after sequencing in P. mirabilis and
P. vulgaris
113
3.7.3 Gene Expression of Proteus Species in LB and LB
Supplemented Growth Medium
Real-time PCR amplification curves for alpha-ketoacid
decarboxylase gene obtained were reproducible and indicated that primers
were selective and effective in producing the specific PCR products.
3.7.3.1 Isoleucine (Ile) and Thiamine pyrophosphate (TPP) addition to
LB Medium alters the Expression of α-ketoacid decarboxylase
(kdcA) Gene in P. mirabilis
The cells grown in LB-Ile exhibited significant up-regulation
(P<0.0001) of kdcA gene expression compared to LB. However, the
comparative analysis between LB and LB-Ile-TPP exhibited less significant
change in expression. The gene expression values were calculated using the
2-ΔΔCT
method as given in the Table 3.12. A reduction of seven fold increase
in the message in the presence of Ile to approximately five-fold in TPP was
observed. Confidence interval (95%) for LB with LB Ile, LB with LB-Ile-
TPP, LB with LB-TPP are -12.33 to -4.367, -9.027 to -1.063 and 10.24 to
13.35 respectively. The fold difference of gene expression of Proteus between
different growth medium is shown in the Figure 3.27. The melting curves
generated at the end of the PCR reaction showed that all amplicons of kdcA
had a melting temperature of 78-79°C. The amplicons of rpo A (reference
gene) had a melting temperature of 82°C.
114
Table 3.12 Calculation of fold difference in P. mirabilis using 2-ΔΔCT
method
Sample
(Proteus
mirabilis)
kdcA -
Average
CT
rpoA
Average CT
Δ CT
kdcA -rpoA
ΔΔCT
ΔCT LB -
ΔCT other
medium
Fold difference
in supplemented
medium relative
to LB medium
LB
16.92±0.01 20.93±0.002 -4.00±0.01 0±0.01 1
16.85±0.16 20.93±0.46 -4.06±0.48 0±0.48 1.4
17.05±0.35 20.28±0.46 -3.22±0.57 0±0.57 1.5
LB
Isoleucine
17.11±0.20 23.93±0.00 -6.82±0.20 -2.81±0.20 8.1
17.54±0.50 23.931±1.11 -6.39±1.21 -2.32±1.21 11.6
17.05±0.15 22.37±1.10 -5.32±1.11 -2.09±1.11 9.3
LB
Isoleucine
TPP
17.06±0.16 23.09±0.88 -6.03±0.89 -2.03±0.89 7.5
16.15±0.98 21.85±0.13 -5.70±0.98 -1.63±0.98 6.1
17.15±0.09 22.04±0.75 -4.88±0.75 -1.66±0.75 5.3
Figure 3.27 The fold difference in PCR template from Proteus cells
growing in LB, LB-Ile and LB-Ile-TPP was calculated using
the 2-ΔΔCT
method. The expression of α-ketoacid
decarboxylase of P. mirabilis grown in LB-Ile was found to
be maximum compared to LB and LB-Ile-TPP medium
corroborating with enzymatic activity data
115
3.7.3.2 Isoleucine (Ile) and Thiamine pyrophosphate (TPP) addition to
LB medium alters the expression of α-ketoacid decarboxylase
(kdcA) Gene in P. vulgaris
The cells grown in LB-Ile exhibited significant up-regulation of
kdcA gene expression compared to LB. The statistical analysis using
ANOVA gave a P value (P<0.0001). However, the comparative analysis
between LB and LB-Ile-TPP exhibited no significant change in expression.
The gene expression values calculated using the 2-ΔΔCT
method is given in the
Table 3.13. The melting curves generated at the end of the PCR reaction
showed that all amplicons of kdcA had a melting temperature of 78°C. The
amplicons of rpo A (reference gene) had a melting temperature of 81°C.
Table 3.13 Calculation of fold difference in Proteus vulgaris using 2-ΔΔCT
method
Sample
(Proteus
vulgaris)
kdcA-
Average
CT
rpoA
Average
CT
Δ CT
kdcA-
rpoA
ΔΔCT
ΔCT LB -
ΔCT other
medium
Fold difference in
supplemented
medium relative
to LB medium
LB
17.90±0.01 20.88±0.35 -2.98±0.35 0±0.35 1.3
17.60±0.18 20.39±0.05 -2.78±0.17 0±0.17 1.1
17.56±0.00 20.31±0.40 -2.75±0.53 0±0.53 1.4
LB
Isoleucine
17.55±0.45 23.85±0.01 -6.30±0.45 -3.32±0.45 13.7
17.49±0.00 23. 86±0.08 -6.37±0.08 -3.59±0.08 12.7
17.41±0.02 22.97±0.09 -6.56±0.09 -3.81±0.09 14.9
LB
Isoleucine
TPP
17.41±0.21 21.03±0.02 -3.61±0.21 -0.64±0.21 1.8
17.69±0.31 21.07±0.02 -3.38±0.30 -0.59±0.30 1.9
17.39±0.25 21.09±0.05 -3.70±0.26 -0.95±0.26 2.3
116
The fold difference of gene expression of Proteus between different
growth medium is shown in the Figure 3.28. The 95% confidence interval for
LB with LB Ile, LB with LB-Ile-TPP, LB with LB-TPP was -14.07 to -10.96,
-2.270 to 0.8393 and 10.24 to 13.35 respectively. A reduction of ten and a
half fold increase in the expression in the presence of Ile to one and a half fold
in TPP was observed. The metabolic pathway showing positive feedback
regulation is shown in the figure 3.29.
Figure 3.28 The expression of α-ketoacid decarboxylase of P. vulgaris
grown in LB-Ile was found to be maximum compared to LB
and LB-Ile-TPP medium
11
7
Figure 3.29 Concept diagram showing positive feedback regulation of kdcA gene through isoleucine
118
CHAPTER 4
DISCUSSION
Bacterial infections continue to devastate the developing countries
due to lack of diagnostic tests that can be performed with low-infrastructure at
suburban and rural areas. Bacterial volatiles are diverse and produce bouquets
of compounds with comparable complexity as those of fungi or plants. A
review by Stefan and Dickschat estimated that about 50–80% of the bacteria
produce volatiles under laboratory conditions (Stefan & Jeroen 2007).
Although it is known that growth of bacteria generates volatile organic
metabolites there is a lack of knowledge about the metabolic pathway which
is involved in their production. Owing to the complex nature of the volatile
profiles, many factors including the growth media, genetic make-up and
environmental conditions influence the volatile composition. To date we have
a limited understanding of how these factors interact to determine the actual
volatile composition resulting in the odour of bacteria (Muna et al 2013).
In this regard, this thesis demonstrates the feasibility of using
Volatile Organic Compound as a biomarker for Proteus and also our ability to
design rational media for maximal production of such targets based on
relevant metabolic studies. Though, research show that cultured samples of a
number of bacteria has distinguishable VOC signature patterns, we were able
to identify single VOC marker for Proteus in the defined growth conditions.
The development of simple fluorescent based diagnostic assay provides a
novel approach and best solution to combat UTI. The discussion also beckons
119
to elaborate the relevance of isoleucine in the growth medium to enhance
2-methylbutanal and their effect on regulation of gene expression.
4.1 EXTRACELLULAR VOC HAS BEEN TARGETED FOR
NON-DESTRUCTIVE DIAGNOSIS
Despite advances in technology and medicine, UTI remains a major
but neglected infectious disease affecting millions, predominantly (80%)
women. Though only a few bacteria namely E. coli, Enterobactor, Klebsiella,
Proteus, Pseudomonas and Staphylococcus cause the infection, this persistent
and often recurrent disease has not been under control (Sheela & Johanna
2013). In the present scenario, preliminary protocols for field detection and
identification of Proteus are time consuming and intensive involving a
number of microbiological and biochemical tests. Field deployable rapid
detection methods are not available for Proteus and therefore the non-
invasive, non-destructive, and easy-to-perform detection method using its
characteristic VOC, 2-methylbutanal, provides first such method useful for
the next generation diagnostics and surveillance.
A number of VOCs have been identified from bacteria, though not
with the specific purpose of diagnostics, and these are scattered in literature
requiring extensive literature survey, as done in this study. However, recently
a database with a compilation of VOCs from a number of bacteria, other than
Proteus, has been made available as a potential tool for identifying
characteristic VOC markers. Therefore this study provides for the first time a
comprehensive list of VOCs of Proteus, which includes a variety of
aldehydes, ketones, alcohols, acids and sulphur-containing compounds. Since
simple colorimetric and highly sensitive fluorescent reagents have been
developed for the detection of carbonyl compounds compared to other
functional groups, we targeted aldehydes and identified 2-methylbutanal.
Interestingly, though Proteus can produce other aldehyde compounds, as
120
reported in the literature, in LB it produced only 2-methylbutanal making it a
specific aldehyde compound worth using as a diagnostic target. Among the
commonly used reagents like DNPH, DNSH, nitroaromatic hydrazines,
2-diphenylacetyl-1, 3-indandione-1-hydrazone (DAIH) and halogenated
phenyl hydrazine for the specific detection of carbonyl compounds, DNSH,
has been found to be the best suited owing to its lower level of detection even
in atmospheric samples (Laurent et al 2004). Further, we were able to show
the analytical reliability and practicability of DNSH, especially when used in
liquid phase.
Though our extensive literature survey on VOCs released by a
number of common pathogenic bacteria, including the ones encountered in
UTI infections, indicated that 2-methylbutanal is also produced by
Staphylococcus (Lieuwe et al 2013), under the defined growth conditions
described in this study only Proteus produced 2-methylbutanal. It was found
to be produced only in LB but not when grown in other minimal and complex
media, as also ascertained by the absolute specificity obtained in validation
using other UTI and non-UTI bacteria. Detailed analysis of our compilation
also showed that this phenomenon is true for other VOCs and bacteria, for
which there is no evidence based reasoning, but plausibly because of the
differential activation of the pathways involved. In any case this adds another
useful dimension in the specificity of detection, which in nature may be
relevant to sensing and sending of information about the milieu.
One more advantage of selecting such VOCs, which are secondary
metabolites, is the ability to induce them and achieve better sensitivity.
2-methylbutanal of Proteus is known to be released as a secondary metabolite
from isoleucine degradation (David 2005) and it could be induced to secrete
two and half times more than the normal, thus increasing the sensitivity
proportionally. However, one of the difficulties with this compound is its
121
volatility, which made it difficult to work with the head space though a
number of methods, including Static headspace extraction (SHE), Dynamic
headspace extraction (DHE) or purge and trap extraction did not yield
consistent and good yields (Augusto et al 2003). We were able to achieve
detectable concentration of VOC from the culture by liquid-liquid extraction
using dichloromethane. It is noteworthy that this extraction has to be
performed soon after culturing is stopped, as the molecule evaporates within
15 min at room temperature and even simple steps like centrifugation to get
clear supernatant could not be employed without drastically affecting the
yield. Even freezing and thawing resulted in the loss of the compound.
Maintaining cold conditions to arrest evaporation is not practical in diagnostic
techniques, especially when these have to be used in peripheral labs and field
level. Hence the method we developed detects the molecule instantly from the
cultures using direct addition of reagents. As discussed below, this method
has several advantages. In view of the vast array of products, which
microorganisms can produce, no single or multiple VOC based assay has been
developed so far for Proteus identification. Our study demonstrates for the
first time, the presence of a single volatile biomarker, 2-methylbutanal that
potentially differentiates Proteus species specifically from other organisms.
4.1.1 Single Step Reaction to Provide a Sensitive Method
Since 2-methylbutanal is an aldehyde, among several possible
reagents, we chose DNSH not only because of its sensitivity but also because
it readily reacts with the aldehyde under acidic condition to give
instantaneous bright green fluorescence, which is stable for hours as the
product is non-volatile. The only precaution is that the measurement should
be performed within 15 min, as the dye is air-oxidized to turn dull orange
fluorescence to bright green fluorescence. It is noteworthy that the maximum
fluorescence yield was observed only when the dye in acetonitrile is added
122
first followed by acetic acid (final pH 3.6 to 3.9). Simplification of the assay
by mixing DNSH and glacial acetic acid to give a reagent with the same pH
range resulted in half the fluorescence yield due to the competing reaction of
carboxylic group in acetic acid with the hydrazine group in DNSH (William
& Stone 1958).
The direct addition of the two reagent components one by one
quickly into the culture was found to be the best and the simplest method
known for the specific detection of Proteus. As our limited but quite
representative screening of clinical isolates consisting of 18 different
pathogens showed 2-methylbutanal to be characteristic of Proteus and
ProteAl assay was absolutely specific. Our validation experiment with other
common bacteria and environmental sample screening also showed 100%
specificity and 100% sensitivity among the 95 known strains tested. Since
screening of 200 environmental samples led us to identify 9 Proteus strains,
which were also independently verified by biochemical tests, we are confident
that this will be a useful technique for cost-effective mass screening. It has to
be noted that our assay identifies Proteus even from mixed culture of 3
different organisms. Therefore it would be a useful tool to identify Proteus
even when other bacteria are present in a sample, as in mixed infections.
As the culture concentration of the VOC was found to be maximal
at 7 h for a moderate inoculum of 105
bacteria, the same was set as the
minimum time required before the test for visual observation using UV
transilluminator. Using sensitive fluorimeters it was possible to detect
fluorescence changes from 5th
hour even for a lower inoculum of 102
cells.
Simple viewer with Blue LED that we had fabricated was also found effective
to view the plates. This will drastically reduce the cost of instrumentation
based on this test.
123
Our quantitative estimation of 2-methylbutanal from the standard
graph for the pure compound in LB showed that the culture concentration of
the compound was in the range of 5-100 nM indicating that it is a secondary
metabolite synthesized in moderate levels (detected from 4th
hour of growth
onwards). Apart from volatile compounds, a number of non-volatile
aldehydes produced by bacteria have been reported and it is possible that they
could interfere with the assay, especially when the test is performed directly
in the culture. However, a number of organisms other than Proteus that were
tested were negative under the same experimental conditions indicating that
other aldehydes, whether volatile or non-volatile, are either not produced or
produced at levels below detection limit. The role of culture media in such
specific release of a volatile compound can be an important factor for use of
LB has not been reported in such studies.
The classical biochemical methods for the identification and
differentiation of Proteus are Urease and Phenylalanine deaminase tests,
which are easy to perform, but not very specific. Common UTI pathogen,
Klebsiella, is urease positive. Providencia and Morganella, which are
uncommon UTI pathogens, are phenylalanine deaminase positive. Modern
nucleic acid based methods like nested PCR have excellent specificity but
require skill and not amenable for challenging peripheral laboratory
conditions. ProteAl provides potential alternative in specifically identifying
Proteus with absolute specificity and ease even by semiskilled workers.
For diagnostic purpose, ProteAl can be employed for testing the
urine samples or even identifying the organisms grown on the plates from
urine samples. A small amount of the urine sample or a colony isolated from
it could be grown for 6-7 hours before the fluorescent reagent is added. The
fluorescence can be either read in a plate reader or imaged from a
UV-transilluminator. As fluorescence measurements are becoming quite
124
popular such instrumentation is becoming cheaper and more affordable.
However, more work is needed to standardize the assay with urine samples
and validate with samples from normal as well as in a variety of disease
conditions.
In contrast to the current identification methods, which take
18-24 h, ProteAl takes only 6-8 h for identification. In terms of affordability,
as compared to all the methods that are currently available, ProteAl has a
definitive advantage of requiring small amounts of inexpensive growth
medium, less expensive reagents, high-throughput capability making the test
most cost-effective (Rs. 2-3 per sample) and most convenient for mass
screening. A 96-well plate assay will take only a few minutes after 7 h
growth, making the method suitable to analyse hundreds of samples most
economically. While such methods are not available for Proteus currently, the
cost of doing it will cost a few hundreds of rupees per sample and take up to 3
days. The simple operation of the method makes it amenable for automation,
demands less skill and provides safety. Though the initial results are
promising, the actual clinical and environmental utility of the method requires
more thorough evaluation with larger sizes of the samples with diverse
organisms.
To ensure that ProteAl exhibited high specificity towards Proteus
we wanted to exploit the use of specific inducers of 2-methylbutanal so that a
highly selective medium could be formulated. This required the study of the
metabolic pathway of this secondary metabolite, which has not been probed.
We employed bioinformatic approach to identify the pathway in Proteus and
prove its existence and its regulation through catabolite activation. This
enabled us to develop a medium that enhanced the production of
2-methylbutanal rationally.
125
4.2 REGULATION OF THE METABOLIC PATHWAY IN
PROTEUS
Our investigation on the metabolic pathway of 2-methylbutanal
revealed that isoleucine was the precursor for its production. It is known from
literature that isoleucine degradation starts with the transamination of
isoleucine to α-keto-3-methyl valerate. Therefore our focus was on α-keto
acid decarboxylase, which coverts it to 2-methylbutanal. To our knowledge
no gene or enzyme of Proteus has yet been characterized at genetic or protein
level that is involved in isoleucine metabolism to produce volatile
2-methylbutanal. Similarity to the extent of 46 and 53% respectively between
branched chain aminotransferase and alpha keto-acid decarboxylase in
Lactococcus lactis and Proteus mirabilis indicated the presence of appropriate
enzyme and operation of this pathway in the latter. Amplification of kdcA
gene from the cDNA preparations of Proteus employing the primers
synthesized from its published genome sequence showed that the enzyme is
not only coded but also transcribed. In fact, the existence of a fully regulated
pathway was revealed by the demonstration of increase in the secretion of 2-
methylbutanal by isoleucine, as in the cases of Lactobacillus, Saccharomyces
and plant mitochondrial kcdA (Brian et al 2000). TPP, the co-factor of the
enzyme was also able to marginally enhance the production of 2-
methylbutanal by 1.5 fold at 2 mM. Beyond 15 mM isolecucine and 2 mM
TPP the production was found to decline. However, when both were present,
the actual amount of 2-methylbutanal production was less than when Ile alone
was present.
To understand the regulatory mechanism operating in Proteus
better, qPCR was performed on 7 h culture to correlate the transcription levels
of the α-keto acid decarboxylase gene when grown in the presence and
absence of Ile or Ile and TPP. The reduction of seven-fold increase in the
126
message in presence of Ile to five-fold when present along with TPP
corroborated with the decline in the production of 2-methylbutanal. This
indicated to the operation of transcriptional control and this is the first such
report in this pathway.
On the basis of these studies, 15 mM Ile was supplemented in LB
to formulate the fist-of-its-kind rational diagnostic medium for Proteus to
maximize the production of 2-methylbutanal for sensitive detection using
ProteAl. The utility of such rational medium was validated with other clinical
isolates. Since the decarboxylase enzyme plays an important role in
enhancing 2-methylbutanal production for aroma in cheese, sausage and wine
manufacturing, this additional knowledge and approach could be made use of
for enhancing the flavor (Mireille et al 2001).
Another important outcome of our study is the demonstration of
this pathway in P. vulgaris, which is also a UTI pathogen but for which
genomic information is not available till now. Since 2-methylbutanal has been
shown to be produced by P. vulgaris and is positive for ProteAl and it is
regulated by Ile and TPP in the same manner as P. mirablis and the
corresponding genes have been identified by PCR amplification and
sequencing, our finding is the first comprehensive report of 2-methylbutanal
production and regulatory mechanism in P. vulgaris. Though we have not
studied the other rare species of Proteus, ProteAl offers genus-level detection,
which appears to be sufficient for the clinician to plan treatment. What is even
more important for a clinician is the right antibiotic to be given for a
nosocomial pathogen like Proteus, which is often multi-drug-resistant and
difficult to manage. Though we have focused on Proteus associated with UTI,
the method is genus specific and therefore can be used for other disease
conditions and identification in water, food and other environmental samples.
127
4.2.1 ProteAl is Useful in Identifying Multi-drug-resistance of
Proteus
In a novel approach to obtain quicker antibiogram, within 6 h, for
UTI pathogens in urine samples, our lab has been developing a method that
first reports the drug resistance using a patented viability assay. This is
followed by the identification of the pathogen within 2 h. This requires non-
destructive and simple-to-perform assay of ProteAl type. Our screening
experiments have revealed that Proteus is quite frequently isolated in UTI, the
incidence varying from 10 to 30 %. All these clinical isolates were found to
be of MDR type, often resistance to many of the commonly used antibiotics
like amikacin, cephotaxime, amoxyclav and ciprofloxacin. A limited study on
environmental sample, especially around hospital waste-dump sites, did not
show prevalence. However, we feel that since UTI is excreted in infected
urine, it would definitely contaminate community and therefore a survey of
community areas will form a good epidemiological study and provide useful
clues to channelize efforts to control its spread. ProteAl will be suitable for
such studies. In other words, ProteAl could form an integral part of pathogen
identification along with antibiogram devices in the future.
4.2.2 ProteAl is a Convenient Signal Generating Component of
Simple and Affordable Imaging based Diagnostic and
Surveillance Instrumentation
For a diagnostic technique to succeed in the control of a pathogen,
instrumentation is essential. To achieve this, the essential first step of signal
generation has to be simple but easy to read, as in the case of ProteAl. This
assay has been designed with the concept of on or off type signal generation;
green fluorescence is positive and dull orange fluorescence is negative. Since
128
the fluorescence method operates in the visible range of the spectrum,
imaging offers a simple and highly affordable sensing solution to develop
even portable instrument. Since 2-methylbutanal is volatile, even electronic
nose is possible and this will be very useful for surveillance. Taking together,
ProteAl and the volatile biomarker offer convenient starting points in
instrumentation development.
Of late intense effort in the development of diverse biosensors has
opened up avenues for the manufacture of effective instruments for infectious
diseases and this will quite radically change the microbiological and clinical
scenario in the future. In our laboratory simple UV or Vis transilluminators
for imaging 96-well plates or a strip of 12 are being developed as next
generation tools for infectious diseases. Though we have been routinely read
using expensive fluorescence readers, we found that we can get qualitative but
accurate results even by using commercial Gel-Doc system or the ones our lab
has been fabricating with blue LEDs for excitation and capturing the image
with Web camera. It is envisaged that a futuristic instrument for Proteus
detection will involve imaging of ProteAl results from a strip or 96-well
plate. Electrochemical sensors will be developed in our laboratory in the
future for surveillance. Schematic representation of the overview of the thesis
is depicted in Figure 4.1.
12
9
Figure 4.1 Schematic Overview of the thesis
130
CHAPTER 5
CONCLUSION
2-methylbutanal has been identified as a VOC based biomarker for
pathogens belonging to the genus Proteus using extensive cheminformatic
analysis and analytical investigation. ProteAl, a simple, non-destructive and
non-invasive method, is a tool to detect Urinary Tract Infections and other
infections caused by Proteus, a notorious nosocomial pathogen can be
performed within 7 h compared to 2-3 days culture test currently available.
Performed with ease in 96-well microtitre plates, which is routinely used in
diagnostic laboratories, the assay can be easily adopted in clinical laboratories
including peripheral labs and hospitals. This next generation methodology
based on VOC biomarker, 2-methylbutanal is highly economical and
amenable for simple imaging based instrumentation for user-friendly and safe
operation. Being suitable for high-throughput format and based on volatile
compound released, it is highly compatible for screening and surveillance
through even electronic nose.
Considering all these features, we believe that an affordable
instrumentation for an early and high-throughput determination of UTI
pathogens can be introduced in the near future. Furthermore, the reduced cost
and selectivity is an important consideration for affordable healthcare for the
poor communities. This next-generation diagnostic approach can be applied to
identify other pathogens like Staphylococcus and Pseudomonas, which forms
the basis of another thesis work in our laboratory. An important finding of
2-methylbutanal production at several hundred micro molar to milli molar
131
levels make these biomarkers attractive for easier detection of pathogens
using simple optical and electrochemical instrumentation.
First-of-its-kind molecular studies on metabolic regulation of
2-methylbutanal in Proteus not only added new details to the metabolism of
this secondary metabolite but also led to rational design of LB-Ile medium for
better selectivity and sensitivity. This also adds a new dimension by rationally
designing appropriate medium for sensitive and selective pathogen detection
using volatile or non-volatile secretory organic compounds as biomarkers.
The designed medium and the yes-or-no type of method designed for
futuristic instrumentation for infectious diseases has been shown to be useful
in high-throughput screening and in identifying MDR types. VOCs like
2-methylbutanal are also attractive targets for modern devices like electronic
nose that could be used for screening and surveillance. Such methods
generally and ProteAl particularly can be useful in even detecting
2-methylbutanal in breathe of lung cancer patients either using an electronic
nose or properly adapting the method developed in this work for breathe.
This initial work opens up the possibility of developing new
diagnostic and surveillance methods based on volatile and non-volatile
organic compounds specifically released by bacteria as biomarker. When such
methods for a number of commonly encountered pathogens are available,
even an automated device for identification of multiple pathogens with their
antibiogram can be devised and automated.
Detailed metabolic investigations of such secondary or even
primary metabolite biomarkers will help design selective media or media
specific for identification of bacterial pathogens. We envisage that such
approach will lead to new set of bacteriological media based on rational
design, which will drastically bring down the cost and time for diagnosis
making healthcare more affordable.
132
The discoveries of secretion of secondary metabolites like
2-methylbutanal also open up another interesting possibility. These could
have adverse effect on the host and so far this aspect has not been studied
adequately, though a lot of work has been focused on virulence proteins. For
example, the effect of polyketides secreted by gut bacteria on human colonic
cell cycle inhibition and its possible implication has been reported. Therefore
it is plausible to come across interesting pathogenic roles of these diagnostic
targets and device appropriate effective intervention. It is quite possible that
such biomarkers could be useful diagnostically and therapeutically.
133
REFERENCES
1. A brief guide to emerging infectious diseases and zoonoses, World
Helath Organisation 2014.
2. Abdullah-Sayani, A, Bueno-de-Mesquita, JM & van de Vijver, MJ
2006, ‘Technology Insight: tuning into the genetic orchestra using
microarrays-limitations of DNA microarrays in clinical practice’, Nat
Clin Pract Oncol., vol. 3, no. 9, pp. 501-516.
3. Alagumaruthanayagam, A, Pavankumar, AR, Vasanthamallika, TK &
Sankaran, K 2009, ‘Evaluation of solid (disc diffusion)- and liquid
(turbidity)-phase antibiogram methods for clinical isolates of
diarrheagenic E. coli and correlation with efflux’, J Antibiot (Tokyo),
vol. 62, no. 7, pp. 377-384.
4. Ali, M, Elbashier, MD, Malik, AG & Khot, AP 1998, ‘Blood stream
infectious microorganisms, risk factors and mortality rate in Qatif
Central Hospital’, Ann Saudi Med, vol. 18, no. 2, pp. 176-180.
5. Alonso, A, Sanchez, P & Martinez, J 2001, ‘Environmental selection
of antibiotic resistance genes’, Enviorn Microbiol, vol. 3, pp. 1-9.
6. Alphus, D, Wilson & Manuela Baietto 2009, ‘Applications and
Advances in Electronic-Nose Technologies’, Sensors (Basel), vol. 9,
no. 7, pp. 5099–5148.
7. Aminov, R 2010, ‘A brief history of the antibiotic era: lessons learned
and challenges for the future’, Front Microbiol, vol. 1, pp. 134.
8. Andre, GS, Joshua, M, Walter, Y & Edmund, MP 2002, ‘Rapid
detection of pathogenic bacteria by volatile organic compound (VOC)
analysis’, Proc. SPIE4575.
9. Andrej Kochevenko, Wagner L Araujo, Gregory S Maloney,
Denise M Tieman, Phuc Thi Do, Mark G Taylor, Harry J Klee &
Alisdair R Fernie 2012, ‘Catabolism of Branched Chain Amino Acids
Supports Respiration but Not Volatile Synthesis in Tomato Fruits’,
Molecular Plant, vol. 5, no. 2, pp. 366–375.
134
10. Arnold, JW & Senter, SD 1998, ‘Use of digital aroma technology and
SPME GC-MS to compare volatile compounds produced by bacteria
isolated from processed poultry’, Journal of the Science of Food and
Agriculture, vol. 78, no. 3, pp. 343–348.
11. Augusto, F, Lopes, AL & Zini, CA 2003, ‘Sampling and sample
preparation for analysis of aromas and fragnances. Trends in
Analytical Chemistry, vol. 22, no.3, pp. 160-169.
12. Avoidable Costs in U.S. Healthcare: The $200 Billion Opportunity
from Using Medicines More Responsibly. Report by the IMS Institute
for Healthcare Informatics 2013.
13. Beck, HC, Hansen, AM & Lauritsen, FR 2002, ‘Metabolite production
and kinetics of branched-chain aldehyde oxidation in Staphylococcus
xylosus’, Enzyme Microb. Technol., vol. 31, pp. 94–101.
14. Bekir Karlic 2004, ‘Real time bad breathes diagnosis and transmission
for telemedicine’, Proceedings of International Conference on
Intelligent Knowledge Systems (IKS).
15. Bentley, B & Bennett, JW 1988, ‘Biosynthesis of secondary
metabolites’, In: Physiology of Industrial Fungi., Blackwell Sci. Pub.
Oxford, pp. 161-183.
16. Berry, DR 1988, ‘Products of primary metabolic pathways’,
Physiology of Industrial Fungi., Blackwell Sci. Pub. Oxford, pp. 130-
160.
17. Bhaskara V Chikkaveeraiah, Ashwinkumar Bhirde, Nicole Y Morgan,
Henry S Eden & Xiaoyuan Chen 2012, ‘Electrochemical
Immunosensors for Detection of Cancer Protein Biomarkers, ACS
Nano., vol. 6, no. 8, pp. 6546–6561.
18. Borja Sanchez, Maria C Urdaci & Abelardo Margolles 2010,
‘Extracellular proteins secreted by probiotic bacteria as mediators of
effects that promote mucosa–bacteria interactions’, Microbiology,
vol. 156, pp. 3232–3242.
19. Braine, T 2011, ‘Race against time to develop new antibiotics’,
Bulletin of the World Health Organization., vol. 89, no. 2, pp. 88-90.
135
20. Brandon J Umber, Hye-Won Shin, Simone Meinardi, Szu-Yun Leu,
Frank Zaldivar, Dan M Cooper & Donald R Blake 2013, ‘Gas
signatures from Escherichia coli and Escherichia coli-inoculated
human whole blood’, Clin Transl Med., vol. 2, pp. 13.
21. Brian P Mooney, Michael T Henzl, Jan A Miernyk & Douglas D
Randall 2000, ‘The dihydrolipoyl acyltransferase (BCE 2) subunit of
the plant branched-chain a-ketoacid dehydrogenase complex forms a
24-mer core with octagonal symmetry’, Protein Science, vol. 9,
pp. 1334–1339.
22. Butler, KH, Reed, C & Bosker, G 2001, ‘New diagnostic modalities,
alteration of drug resistance patterns and current antimicrobial
treatment guidelines for the hospitals and outpatient settings In:
Clinical Consensus Report’, Urinary Tract Infection.
23. Caroline Mohr O'Hara, Frances W Brenner & Michael Miller, J 2000,
‘Classification, Identification, and Clinical Significance of Proteus,
Providencia, and Morganella’, Clin Microbiol Rev., vol. 13, no. 4,
pp. 534–546.
24. Chen Zhang & Kenneth S Suslick 2005, ‘Colorimetric Sensor Array
for Organics in Water’, J. Am. Chem. Soc., vol. 127, pp. 11548-11549.
25. Chidananda Nagamangala Kanchiswamy, Mickael Malnoy & Massimo
E Maffei 2015, ‘Chemical diversity of microbial volatiles and their
potential for plant growth and productivity’, Front. Plant Sci. vol. 6,
article 151, pp. 1-23.
26. Christopher Coker, Carrie A Poore, Xin Li & Harry LT Mobley 2000,
‘Pathogenesis of Proteus mirabilis urinary tract infection’, Microbes
and Infection, vol. 2, no. 12, pp. 1497–1505.
27. Christopher J Musto & Kenneth S Suslick 2010, ‘Differential sensing
of sugars by colorimetric arrays’, Current Opinion in Chemical
Biology., vol. 14, no. 6, pp. 758–766.
28. David, JR 2005, ‘Chemistry and Technology of Flavour and
Fragrance’, Blackwell, UK.
29. Dennise D Dalma-Weiszhausz, Marina E Chicurel & Thomas R
Gingeras 2002, ‘Microarrays and genetic epidemiology: a
multipurpose tool for a multifaceted field’, Genet. Epidemiol., Genet
Epidemiol., vol. 23, no. 1, pp. 4-20.
136
30. Disease burden in India: estimations and causal analysis. In: 14.
NCMH background papers - burden of disease in India. New Delhi:
National Commission on Macroeconomics and Health & Family
Welfare, Ministry of Health, Government of India, 2005.
31. Elgaali, H & Hamilton-Kemp, TR 2002, ‘Comparison of long-chain
alcohols and Other volatile compounds emitted from food-borne and
related Gram positive and Gram negative bacteria’, J Basic Microbiol.,
vol. 42, no. 6, pp. 373-80.
32. Emily, RM, Sydnor & Trish M Perl 2011, ‘Hospital Epidemiology and
Infection Control in Acute-Care Settings’, Clin Microbiol Rev.,
vol. 24, no. 1, pp. 141–173.
33. Erika Lea Flannery 2011, ‘Contribution of Horizontal Gene Transfer to
Virulence and Antibiotic Resistance in Pathogens Transmitted in
Healthcare Facilities’, PhD dissertation in Epidemiological Science,
University of Michigan.
34. Ezeonu, IM, Price, DL, Simmons, RB, Crow, SA & Ahearn, DG 1994,
‘Fungal production of volatiles during growth on fiberglass’, Applied
and Environmental Microbiology., vol. 60, pp. 4172-4173.
35. Fauci, AS 2001, ‘Infectious diseases: considerations for the 21st 2.
Century’, Clin Infect Dis., vol. 32, pp. 675-685.
36. Frank, W 2008, ‘Cell-Based Assays for High-Throughput Screening:
Methods and Protocols’, Methods in Molecular Biology., vol. 486,
pp. 97-107.
37. Frederick Adzitey, Nurul Huda & Gulam Rusul Rahmat Ali 2012,
‘Molecular techniques for detecting and typing of bacteria, advantages
and application to foodborne pathogens isolated from ducks’,
Biotech., vol. 3, no. 2, pp. 97–107.
38. Garner, CE & Smith, S 2007, ‘Volatile organic compounds from feces
and their potential for diagnosis of gastrointestinal disease’, FASEB
Journal., vol. 21, no.8, pp. 1675-1688.
39. Georg Mitterer, Martin Huber, Ernst Leidinger, Claudia Kirisits,
Werner Lubitz, Manfred W Mueller & Wolfgang M Schmidt 2004,
‘Microarray-Based Identification of Bacteria in Clinical Samples by
Solid-Phase PCR Amplification of 23S Ribosomal DNA Sequences’, J.
Clin. Microbiol., vol. 42, no. 3, pp. 1048-1057.
137
40. Ginawi, I, Mohd Saleem, Mastan Sigh, AK, Vaish, I, Ahmad, VK,
Srivastava, Fahad, A & Abdullah, M 2014, ‘Hospital Acquired
Infections Among Patients Admitted in the Medical and Surgical
Wards of a Non-Teaching Secondary Care Hospital in Northern India’,
J Clin Diagn Res., vol. 8, no. 2, pp. 81–83.
41. Giske, CG, Dominique, L, Cars, MO & Carmeli, Y 2008, ‘Clinical and
Economic Impact of Common Multidrug-Resistant Gram-Negative
Bacilli’, Antimicrob. Agents Chemother., vol. 52, pp. 813-821.
42. Griffith, DP, Musher, DM & Itin, C 1976, ‘Urease: the primary cause
of infection-induced urinary stones’, Invest. Urol., vol. 13, pp. 346–350.
43. Guentzel, MN 1996, Escherichia, Klebsiella, Enterobacter, Serratia,
Citrobacter, and Proteus. In: Barron's Medical Microbiology (Barron
S et al., eds.) (4th ed.). Univ of Texas Medical Branch. ISBN
0-9631172-1-1. (via NCBI Bookshelf)
44. Gus Gonzalez & Michael Stuart Bronze 2014, Proteus Infections
Medication, http://emedicine.medscape.com/article/226434-medication).
45. Hancock, R 1998, ‘Resistance mechanisms in Pseudomonas
aeruginosa and other nonfermentative gram- negative bacteria’, Clin
Infect Dis., vol. 27, pp. 93-99.
46. Holt, JG, Krieg, NR, Sneath, PHA, Staley, JT, Williams, ST &
Hensyl, WR 1994, ‘Bergey’s Manual of Determinative Bacteriology’,
9th Edition, Williams and Wilkins, Baltimore, MD, USA, pp. 184–185.
47. http://emedicine.medscape.com/article/226434-overview
48. http://www.fda.gov/Food/FoodborneIllnessContaminants/FoodborneIll
nessesNeedToKnow/default.htm
49. https://mikesnexus.files.wordpress.com/2015/02/causeofdeathdevelopi
ngcountries.jpg?w=676.
50. Hughes, DT & Sperandio, V 2008, ‘Inter-kingdom signalling:
communication between bacteria and their hosts’, Nat Rev Microbiol.,
vol. 6, pp. 111–120.
138
51. Ian Humphery-Smith 2014, ‘Importance of Bacteriophage in
Combating Hospital-Acquired Infection (HAI)’, Pharmacology &
Pharmacy., vol. 5, pp. 1192-1201.
52. Ida A Casalinuovo, Donato Di Pierro, Massimiliano Coletta &
Paolo Di Francesco 2006, ‘Application of Electronic Noses for Disease
Diagnosis and Food Spoilage Detection’, Sensors., vol. 6, pp.1428-
1439.
53. Infectious Disease Treatments: Global Markets BCC research market
forecasting 2010, (http://www.bccresearch.com/market-research/
pharmaceuticals/infectious-disease-treatments-phm061b.html, Global
markets for infectious disease treatment)
54. Jan E Szulejko & Ki-Hyun Kim 2015, ‘Derivatization techniques for
determination of carbonyls in air’, Trends in Analytical Chemistry.,
vol. 64, pp. 29–41.
55. Jason Herrington, A, Lin Zhang, B, Donald Whitaker, C, Linda
Sheldonc, Junfeng & Zhangbd J 2005, ‘Optimizing a dansylhydrazine
(DNSH) based method for measuring airborne acrolein and other
unsaturated carbonyls’, J Environ. Monit., vol. 7, no. 10, pp. 969-976.
56. Jiangjiang Zhu, Heather D Bean, Yin-Ming Kuo & Jane E Hill 2010,
‘Fast Detection of Volatile Organic Compounds from Bacterial
Cultures by Secondary Electrospray Ionization-Mass Spectrometry’,
Journal of Clinical Microbiology., vol. 48, no. 12, pp. 4426–4431.
57. John CD Auria, Eran Pichersky, Andrea Schaub, Armin Hansel &
Jonathan Gershenzon 2007, ‘Characterization of a BAHD
acyltransferase responsible for producing the green leaf volatile
(Z)-3-hexen-1-yl acetate in Arabidopsis thaliana’, Plant Journal., vol.
49, no. 2, pp. 194–207.
58. Judith AP Bons, Marja van Dieijen-Visser & Will Wodzig 2007,
‘Clinical proteomics in chronic inflammatory diseases: A review’,
Proteomics. Clinical applications., vol. 1, no. 9, pp. 1123-1133.
59. Jyoti Tanwar, Shrayanee Das, Zeeshan Fatima & Saif Hameed 2014,
‘Multidrug Resistance: An Emerging Crisis’, Interdisciplinary
Perspectives on Infectious Diseases., vol. 2014, pp. 1-7.
139
60. Kai, M, Haustein, M, Molina, F, Petri, A, Scholz, B, Piechulla, B 2009,
‘Bacterial volatiles and their action potential’, Appl Microbiol Biot.,
vol. 81, no. 6, pp. 1001–1012.
61. Kamila Schmidt & Ian Podmore 2015, ‘Current Challenges in Volatile
Organic Compounds Analysis as Potential Biomarkers of Cancer’,
Journal of Biomarkers., vol. 2015, pp. 16.
62. Karen Abella Santo-Pietro 2006, Microbial Volatile Organic
Compounds (MVOC's)’, The Environmental Reporter, vol. 4, no. 4.
63. Kell, DB, Kaprelyants, AS, Weichart, DH, Harwood, CR & Barer, MR
1998, ‘Viability and activity in readily culturable bacteria: a review
and discussion of the practical issues’, Antonie Van Leeuwenhoek.,
vol. 73, no. 2, pp. 169-187.
64. Korpi, A 2001, Fungal volatile metabolites and biological responses to
fungal exposure Ph. D Thesis: University of Kuopio, Finland
65. Krikler, MS 1953, ‘The serology of Proteus vulgaris’, Ph.D. Thesis.
University of London, pp. 37.
66. Lashley, FR 2003, ‘The factors which contribute to the occurrence of
emerging infectious diseases’, Biol Res Nurs., vol. 4, no. 4, pp. 258-
267.
67. Laurent, M, Amupuero, S, Zesiger, TMG & Casey 2004, ‘Screening of
aroma-producing lactic acid bacteria with electronic nose’, Int Dairy J,
vol. 14, pp. 846–849.
68. Leclercq, R & Courvalin, P 1991, ‘Intrinsic and unusual resistance to
macrolide, lincosamide, and streptogramin antibiotics in bacteria’,
Antimicrob Agents Chemother., vol. 35, pp. 1273-1276.
69. Li, X, Zhao, H, Lockatell, CV, Drachenberg, CB, Johnson, DE &
Mobley, HL 2002, ‘Visualization of Proteus mirabilis within the
Matrix of Urease-Induced Bladder Stones during Experimental
Urinary Tract Infection’, Infect. Immun., vol. 70, pp. 389-394.
70. Lieuwe DJ Bos, Peter J Sterk & Marcus J Schultz 2013, ‘Volatile
Metabolites of Pathogens: A Systematic Review’, PLoS Pathog., vol.
9, no. 5.
140
71. Malik, VS 1979, ‘Genetics of applied microbiology’, Advances in
Genetics., vol. 20, pp. 37-126.
72. Maria Cristiana Papaleo, Riccardo Romoli, Gianluca Bartolucci, Isabel
Maida, Elena Perrin, Marco Fondi, Valerio Orlandini, Alessio
Mengoni, Giovanni Emiliani, Maria Luisa Tutino, Ermenegilda
Parrilli, Donatella de Pascale, Luigi Michaud, Angelina Lo Giudice &
Renato Fani 2013, ‘Bioactive volatile organic compounds from
Antarctic (sponges) bacteria’, New Biotechnology, vol. 30, no. 6,
pp. 824–838.
73. Mark A Valasek & Joyce J Repa 2005, ‘The power of real-time PCR’,
Adv Physiol Educ., vol. 29, no. 3, pp. 151-159.
74. Martin, V, Andrea, B & Uwe, K 2000, ‘Hydrazine reagents as
derivatizing agents in environmental analysis – a critical review’,
Fresenius J Anal Chem., vol. 366, pp. 781–791.
75. Matsuyama, T, Takagi, Y, Nakagawa, Y, Itoh, H, Wakita, J &
Matsushita, M 2000, ‘Dynamic aspects of the structured cell
population in a swarming colony of Proteus mirabilis’, J. Bacteriol.,
vol. 182, no. 2, pp. 385–93.
76. Max Wynn, R, James R Davie, Jacinta L Chuang, Cynthia D Cote &
David T Chuang 1998, ‘Impaired Assembly of E1 Decarboxylase of
the Branched-chain -Ketoacid Dehydrogenase Complex in Type IA
Maple Syrup Urine Disease’, The Journal of Biological Chemistry.,
vol. 273, no. 21, pp. 13110–13118.
77. Mayon-White, RT 1988, ‘An international survey of the prevalence of
hospital-acquired infection’, J Hosp Infect., pp. 43–48.
78. Meenakshi Gijare 2012, ‘Effectiveness of teaching on infection control
practices among health care professionals’, Sinhgad e Journal of
Nursing, vol. 2, no. 2, pp. 5-9.
79. Melanie Junger, Wolfgang Vautz, Martin Kuhns, Lena Hofmann,
Siobhan Ulbricht, Jorg Ingo Baumbach, Michael Quintel & Thorsten
Perl 2012, ‘Ion mobility spectrometry for microbial volatile organic
compounds: a new identification tool for human pathogenic bacteria’,
Appl Microbiol Biotechnol., vol. 93, no. 6, pp. 2603–2614.
141
80. Michael C Janzen, Jennifer B Ponder, Daniel P Bailey, Crystal K
Ingison & Kenneth S Suslick 2006, ‘Colorimetric Sensor Arrays for
Volatile Organic Compounds’, Anal. Chem., vol. 78, pp. 3591-3600.
81. Mireille Yvon & Liesbeth Rijnen 2001, ‘Cheese flavor formation by
aminoacid catabolism’, International Dairy Journal., vol. 11,
pp. 185–201.
82. Mobley, HL & Warren, JW 1987, ‘Urease-positive bacteriuria and
obstruction of long-term urinary catheters’, J. Clin. Microbiol., vol. 25,
pp. 2216–2217.
83. Mohsen Sohrabi, Li Zhang, Kai Zhang, Adnan Ahmetagic & Ming Q
Wei 2014, ‘Volatile Organic Compounds as Novel Markers for the
Detection of Bacterial Infections’, Clin Microbial., vol. 3, no. 3.
84. Muna Ahmed Mohamed El Hadi, Feng-Jie Zhang, Fei-Fei Wu,
Chun-Hua Zhou & Jun Tao 2013, ‘Advances in Fruit Aroma Volatile
Research’, Molecules., vol. 18, no.7, pp. 8200-8229.
85. Nicholson, JK & Lindon, JC 2008, ‘Systems biology: metabonomics’,
Nature, vol. 455, pp. 1054–1056.
86. Obi, RK, Orji, NM, Nwanebu, FC, Okangba, CC & Ndubuisi, UU
2010, ‘Emerging and Re-Emerging Infectious Diseases: The Perpetual
Menace’, Asian J. Exp. Biol. Sci., vol. 1, no. 2, pp. 271-282.
87. Ochman, H, Lawrence, J & Groisman, E 2000, ‘Lateral gene transfer
and the nature of bacterial innovation’, Nature., vol. 405, pp. 299-304.
88. Olivier Lazcka, F, Javier Del Campo, F & Xavier Mu Noz 2007,
‘Pathogen detection: A perspective of traditional methods and
biosensors’, Biosensors and Bioelectronics., vol. 22, pp. 1205–1217.
89. Pavlou, AK & Turner, AP 2000, ‘Sniffing out the truth: clinical
diagnosis using the electronic nose’, Clin Chem Lab Med., vol. 38,
no. 2, pp. 99-112.
90. Petr Verner 1984, ‘Photoionization detection and its application in gas
chromatography’, Journal of Chromatography A, vol. 300, pp. 249–264.
142
91. Pilar Fernandez de Palencia, Marta de la Plaza, M, Luz Mohedano, M,
Carmen Martınez-Cuesta, Teresa Requena, Paloma LoPez & Carmen
Pelaez 2004, ‘Enhancement of 2-methylbutanal formation in cheese by
using a fluorescently tagged Lacticin 3147 producing Lactococcus
lactis strain’, International Journal of Food Microbiology., vol. 93,
pp. 335–347.
92. Ponce-de-Leon, S 1991, ‘The needs of developing countries and the
resources required’, J Hosp Infect., vol. 18, pp. 376–381.
93. Pothur R Srinivas, Mukesh Verma, Yinming Zhao & Sudhir Srivastava
2002, ‘Proteomics for Cancer Biomarker Discovery’, Clinical
Chemistry., vol. 48, no. 8, pp. 1160 –1169.
94. Pradeep Sahu, Neha Pinkalwar, Ravindra Dhar Dubey, Shweta Paroha,
Shilpi Chatterjee & Tanushree Chatterjee 2011, ‘Biomarkers: An
Emering Tool for Diagnosis of a Disease and Drug Development’,
Asian J. Res. Pharma. Sci., vol. 1, no. 1, pp. 09-16.
95. Prevention of hospital-acquired infections: A practical guide. 2nd
edition WHO/CDS/CSR/EPH/2002.12.
96. Quigley, MA 2006, ‘Shifting burden of disease-epidemiological
transition in India’, Int J Epidemiol., vol. 35, pp. 1530-1531.
97. Rachel T Noble & Stephen B Weisberg 2005, ‘A review of
technologies for rapid detection of bacteria in recreational waters’, J
Water Health., vol. 3, no. 4, pp. 381-92.
98. Rauprich, O, Matsushita, M, Weijer, CJ, Siegert, F, Esipov, SE &
Shapiro, JA 1996, ‘Periodic phenomena in Proteus mirabilis swarm
colony development’, J. Bacteriol., vol. 178, no. 22, pp. 6525–38.
99. Reineccius, G 2006, ‘Flavor Chemistry and Technology’, 2nd ed.;
CRC Press: Boca Raton, FL, USA.
100. Ryan, KJ & Ray, CG 2004, Sherris Medical Microbiology (4th ed.).
McGraw Hill. ISBN 0-8385-8529-9.
101. Saranraj, P & Stella, D 2011, ‘Antibiogram of Nosocomial Infections
and Its Antimicrobial Drug Resistance’, International Journal of
Pharmaceutical & Biological Archives., vol. 2, no. 6, pp. 1598-1610.
143
102. Schmied, Przewosnik, & Bachmann 1989, ‘Determination of traces of
aldehydes and ketones in the troposphere via solid phase derivatisation
with DNSH, Fresenius Z Anal Chem., vol. 335, pp. 464-468.
103. Senka Dzidic & Vladimir Bedekovic 2003, ‘Horizontal gene transfer-
emerging multidrug resistance in hospital bacteria’, Acta Pharmacol
Sin., vol. 24, no. 6, pp. 519-26.
104. Sheela Devi, A & Johanna Rajkumar 2013, ‘A study on antibiotic
susceptibility and resistance profiles of bacterial strains isolated from
patients with Urinary Tract Infection (UTI) At Kanchipuram District,
Tamilnadu, India’, International Journal of Pharmacy and
Pharmaceutical Sciences., vol. 5, no. 3, pp. 817-820.
105. Shneh Sethi, Ranjan Nanda & Trinad Chakraborty 2013, ‘Clinical
Application of Volatile Organic Compound Analysis for Detecting
Infectious Diseases’, Clin Microbiol Rev., vol. 26, no. 3, pp. 462–475.
106. Sichu Li 2014, ‘Recent Developments in Human Odor Detection
Technologies’, Journal of Forensic Science & Criminology., vol. 1,
no. 1, pp. 1-12.
107. Sichu, L 2009, ‘Overview of Odor Detection Instrumentation and the
Potential for Human Odor Detection in Air Matrices’, Project No.
07MSR216 and 1509532.http://www.mitre.org/work/tech_papers/tech
_papers_09/09_4536/09_4536.pdf.
108. Siddhesh B Shinde, Clara B Fernandes & Vandana B Patravale 2012,
‘Recent trends in in-vitro nanodiagnostics for detection of pathogens’,
Journal of Controlled Release., vol. 159, no. 2, pp. 164–180.
109. Simeng Chen, Yuchao Wang & Seokheun Choi 2013, ‘Applications
and Technology of Electronic Nose for Clinical Diagnosis’, Open
Journal of Applied Biosensor., vol. 2, pp. 39-50.
110. Singh, TK, Drake, MA & Cadwallader, KR 2003, ‘Flavor of Cheddar
Cheese: A Chemical and Sensory Perspective’, Comprehensive
Reviews In Food Science And Food Safety., vol. 2, pp. 166-189.
111. Stefan Schulz & Jeroen S Dickschat 2007, ‘Bacterial volatiles: the
smell of small organisms’, Nat. Prod. Rep., vol. 24, pp. 814–842.
144
112. Steven P Djordjevic, Harold W Stokes & Piklu Roy Chowdhury 2013,
‘Mobile elements, zoonotic pathogens and commensal bacteria:
conduits for the delivery of resistance genes in to humans, production
animals and soil microbiota’, Frontire’s in microbiology., vol. 4, no.
86, pp. 1-12.
113. Storer, MK, Hibbard-Melles, K, Davis, B & Scotter, J 2011, ‘Detection
of volatile Compounds produced by microbial growth in urine by
selected ion flow tube mass Spectrometry (SIFT-MS)’, J Microbiol
Methods., vol. 87, no. 1, pp. 111-113.
114. Sung H Lim, Jonathan W Kemling, Liang Feng & Kenneth S Suslick
2009, ‘A colorimetric sensor array of porous pigments’, Analyst.,
vol. 134, no.12, pp. 2453–2457.
115. Tavaria, FK, Dahl, S, Carballo, FJ & Malcata, FX 2002, ‘Amino acid
catabolism and generation of volatiles by lactic acid bacteria’, J. Dairy
Sci., vol. 85, pp. 2462–2470.
116. Taylor, LH, Latham, SM & Woolhouse, ME 2001, ‘Risk factors for
human disease emergence’, Philos Trans R Soc Lond B Biol Sci.,
vol. 356, no. 1411, pp. 983-989.
117. Thorn, RM, Reynolds, DM & Greenman, J 2011, ‘Multivariate
analysis of bacterial volatile compound profiles for discrimination
between selected species and strains in vitro’, J Microbiol Meth.,
vol. 84, pp. 258-264.
118. Tikhomirov, E 1987, ‘WHO Programme for the Control of Hospital
Infections’, Chemiotherapia., vol. 3, pp. 148–151.
119. Turner, N, Jones, M, Grice, K, Dawson, D Ioppolo-Armanios, M, &
Fisher, S 2006, ‘δ13C of volatile organic compounds (VOC’s) in
airborne samples by thermal desorption (TD-GC-IR-MS)’, Atmos.
Environ., vol. 40, pp. 3381-3388.
120. Valerie Tanchou 2014, ‘Review of methods for the rapid identification
of pathogens in water samples’, ERNCIP thematic area Chemical &
Biological Risks in the Water Sector, Task 7, deliverable. 1,
pp. 1-38.
145
121. Vijayata Singh, Mohit Kamthania, Rajendra Pavan, Swati Singh &
Nitin Kumar 2014, ‘Biosensor Developments: Application in crime
detection’, International Journal of Engineering and Technical
Research., pp. 163-166.
122. Vining, LC 1990, ‘Functions of secondary metabolites’, Annual
Reviews of Microbiology., vol. 44, pp. 395-427.
123. Weise, T, Kai, M, Gummesson, A, Troeger, A, Von Reu, S,
Piepenborn, S, Kosterka, F, Sklorz, M, Zimmermann, R, Francke, W &
Piechulla, B 2012, ‘Volatile organic compounds produced by the
phytopathogenic bacterium Xanthomonas campestris pv. vesicatoria
85-10’, Beilstein J Org Chem., vol. 8, pp. 579-96.
124. WHO report 2012, Prevention of hospital-acquired Infections, A
practical guide, 2nd edition.
125. William, H & Stone, K 1958, ‘Reaction of Hydrazine with Acetic Acid
at 25 degrees’, J Org Chem., vol. 23, pp. 2032–2034.
126. Wojciech Filipiak, Andreas Sponring, Maria Magdalena Baur, Anna
Filipiak, Clemens Ager, Helmut Wiesenhofer, Markus Nagl, Jakob
Troppmair & Anton Amann 2012, ‘Molecular analysis of volatile
metabolites released specifically by Staphylococcus aureus and
Pseudomonas aeroginosa’, BMC Microbiology., vol. 12, no. 113,
pp. 1-16.
127. World Health Organization retrieves from http://www.who.int/csr/
sars/country/en (last assessed on 16th Jan 2012).
128. Yuguang Chi, Yanli Feng, Sheng Wen, Huixiong Lu, Zhiqiang Yu,
Wenbing Zhang, Guoying Sheng, Jiamo Fua & Chi, Y 2007,
‘Determination of carbonyl compounds in the atmosphere by DNPH
derivatization and LC–ESI-MS/MS detection’, Talanta., vol. 72, no.2,
pp. 539–545.
146
LIST OF PUBLICATIONS
1. Raju Aarthi, Raju Saranya & Krishnan Sankaran 2014,
‘2-methylbutanal, a volatile biomarker, for non-invasive surveillance
of Proteus’, Appl Microbiol. Biotechnology, vol. 98, no.1, pp.445-454.
2. Raju Saranya, Raju Aarthi & Krishnan Sankaran 2015, ‘Simple and
specific colorimetric detection of Staphylococcus using its volatile
2-[3-acetoxy-4,4,14-trimethylandrost-8-en-17-yl] propanoic acid in the
liquid phase and head space of cultures’, Appl Microbiol
Biotechnology, vol. 99, no. 10, pp. 4423-33.

Full Thesis

  • 1.
    NEW APPROACH TOBACTERIAL DIAGNOSTICS: 2-METHYLBUTANAL AS A VOLATILE ORGANIC BIOMARKER FOR PROTEUS FOR DEVELOPING PROTEAL, A RAPID AND NON-INVASIVE DETECTION METHOD AND RATIONAL DESIGN OF ITS DIAGNOSTIC CULTURE MEDIUM A THESIS Submitted by AARTHI R in partial fulfillment of the requirements for the degree of DOCTOR OF PHILOSOPHY FACULTY OF TECHNOLOGY ANNA UNIVERSITY CHENNAI 600 025 JULY 2015
  • 2.
    ii ANNA UNIVERSITY CHENNAI 600025 CERTIFICATE The research work embodied in the present Thesis entitled “NEW APPROACH TO BACTERIAL DIAGNOSTICS: 2-METHYLBUTANAL AS A VOLATILE ORGANIC BIOMARKER FOR PROTEUS FOR DEVELOPING PROTEAL, A RAPID AND NON-INVASIVE DETECTION METHOD AND RATIONAL DESIGN OF ITS DIAGNOSTIC CULTURE MEDIUM” has been carried out in the Centre for Biotechnology, Anna University, Chennai - 600 025. The work reported herein is original and does not form part of any other thesis or dissertation on the basis of which a degree or award was conferred on an earlier occasion or to any other scholar. I understand the University’s policy on plagiarism and declare that the thesis and publications are my own work, except where specifically acknowledged and has not been copied from other sources or been previously submitted for award or assessment. AARTHI R Dr. K. SANKARAN RESEARCH SCHOLAR SUPERVISOR Professor Centre for Biotechnology Anna University Chennai – 600 025
  • 3.
    iii ABSTRACT Control of infectiousdiseases through early identification of pathogens, or better still, surveillance to eradicate is becoming more and more meaningful with the emergence of Multi-drug-resistance (MDR) and spread of dangerous pathogenic forms from hospitals to communities. The most common and prevalent Urinary Tract Infections (UTI) are also one of the most neglected infectious diseases. The classical and current techniques for diagnosis are not effective for a variety of reasons including the nature of the diagnostic targets and methods. Hence, its treatment is quite challenging making it imperative to develop quick diagnosis and render antibiotic treatment effective. Taking one of the notorious nosocomial causative bacterium, Proteus, we have addressed the challenge making a paradigm shift in the approach of detecting the bacteria. In this regard, Volatile Organic Compounds (VOCs) which are secreted as defense against antagonists or as signalling molecules by the organisms under specific conditions through specific biochemical pathways were exploited. In the case of Proteus, 2-methylbutanal identified by GC-MS was found to be the characteristic volatile compound released in Luria Bertani (LB) broth. Using this compound we were able to develop a simple test in 96- well microplate format that can be directly applied to the 7 h culture of the bacterium to give a yes-or-no type of response for fluorimetric detection. The assay, named ProteAl, (Prote, “Proteus” & Al, “Aldehyde”) involves instant reaction of 5-dimethylaminonaphthalene-1-sulfonylhydrazine (DNSH) with
  • 4.
    iv 2-methylbutanal under acidiccondition to give green fluorescence (other organisms show orange fluorescence). This diagnostic assay has been tested using 39 standard and 56 known clinical strains representing frequently encountered uropathogens including {27 Proteus (both mirabilis and vulgaris), 27 E.coli, 8 Klebsiella, 10 Staphylococcus, 7 Pseudomonas}, 2 Enterobacter, 2 Citrobacter, 7 Salmonella, 4 Shigella and 200 environmental soil strains. The sensitivity and specificity of this high-throughput assay performed in 96-well format were 100% under laboratory conditions and therefore forms the basis for larger clinical validation. This cost-effective diagnostic tool will be useful in hospitals, peripheral clinics, epidemiological studies and environmental surveillance. Metabolic pathway and regulation studies (including qPCR) based on the limited reports available in a few other systems revealed the presence of functional pathway in Proteus and its regulation through Isoleucine (Ile) and Thiamine pyrophosphate (TPP). This led to the designing of LB-Ile medium with 15 mM isoleucine in LB to enhance the production of the biomarker 2.5 times more than normal. The growth in the rationally designed medium and ProteAl now would provide a convenient diagnostic tool for identifying this bacterium from clinical samples within 7 h. The expression of alpha-ketoacid decarboxylase (kdcA) of Proteus grown in LB-Ile medium revealed a seven-fold increase in expression compared to normal LB. This indicated to the operation of transcriptional control in Proteus and this is the first such report revealing the existence of isoleucine catabolism in Proteus (mirabilis and vulgaris).
  • 5.
    v Though we havefocused on Proteus associated with UTI, the method is genus specific and therefore can be used for other disease conditions. The development of such cost effective, non-invasive and non- destructive method has been shown to be readily amenable for simple imaging based instrumentation (like gel doc) for routine clinical use. In conclusion, we have taken a new approach towards next generation diagnostic method for infectious bacteria that can be readily adapted to instrumentation and automation.
  • 6.
    vi ACKNOWLEDGEMENTS I would liketo express my sincere gratitude to my guide Prof. K. Sankaran for providing me an excellent opportunity to work in this challenging field of research. I graciously thank him for all the stimulating scientific discussions and the constant encouragement to aim high scientific standards. I sincerely thank Prof. P. Gautham, Director, Centre for Biotechnology for his support during my Ph.D. I am also grateful to my doctoral committee members, Dr. Venkatesh Balasubramanian, IIT-Madras and Dr. M. Ramalingam (Retd.) Anna University, for their helpful suggestions. I profoundly thank Prof. G.M. Samuel Knight, Director CPDE for his support and encouragement. I am grateful to Mr. Suresh Lingham, M/s Trivitron Pvt Ltd. for clinical samples, Dr. Mathiyarasu and Sankararao, CECRI, Karaikudi, Dr. T. Sivakumar, Prof. B. Sivasankar Anna University, Prof. Mohanakrishnan, University of Madras, Dr. A. Alagumaruthanayagam and B. Palanisamy for analysis and analytical data. I would like to specifically thank my seniors, fellow colleagues and all scholars of CBT for their constant encouragement and support. I owe my sincere gratitude to all technical and non-technical staffs of CBT for their support. I thank UGC-BSR, CPEES and CSIR-SRF for their financial assistance during my research. Heartfelt thanks to my husband Mr. M. Thiruvengadam and my in-laws for their encouragement. Lastly, I must say that I would not be where I am without the unending support of my parents Late. Mr. S. Raju, Mrs. Mangai Raju and all others in my family. I am indebted to them. Their moral support all through these years of my research is the driving force behind this achievement. AARTHI R
  • 7.
    vii TABLE OF CONTENTS CHAPTERNO. TITLE PAGE NO. ABSTRACT iii LIST OF TABLES xvi LIST OF FIGURES xviii LIST OF SYMBOLS AND ABBREVIATIONS xxvi 1 INTRODUCTION 1 1.1 INCREASING BURDEN AND THREAT OF INFECTIOUS DISEASES 1 1.1.1 Nosocomial Infections, Complicating Factor in the Control 8 1.1.2 Multi-drug-resistance is a Major Threat and Challenge 10 1.2 INADEQUACY OF CLASSICAL AND CURRENT DIAGNOSTIC METHODS AND LACK OF SCREENING AND SURVEILLANCE METHODS FOR PREVENTIVE HEALTHCARE 13 1.2.1 Limitations of Emerging Modern Methods 14 1.3 NEED FOR NEW APPROACHES TO DEVELOP NEXT GENERATION TOOL WITH MODERN KNOWLEDGE 17 1.3.1 Intra and Extracellular Targets for Non-invasive and Non-destructive Detection Methods 17 1.3.2 Volatile Organic Compounds (VOCs) as Extracellular Targets 19
  • 8.
    viii CHAPTER NO. TITLEPAGE NO. 1.4 CURRENT METHODS FOR DETECTION OF VOLATILE ORGANIC COMPOUNDS (VOCs) 21 1.4.1 Colorimetric Sensor Array 21 1.4.2 Fluorescent Method for VOC Detection 22 1.4.3 Gas Chromatography and Mass Spectroscopy (GC-MS) 23 1.4.4 Biosensors 25 1.4.5 E-nose 26 1.5 REGULATION OF VOLATILE ORGANIC COMPOUND METABOLISM 27 1.6 RATIONAL DESIGN OF MEDIA FOR ENHANCED VOLATILE ORGANIC COMPOUND PRODUCTION 30 1.7 PROTEUS AS A MODEL STUDY ORGANISM 31 1.7.1 Proteus –General Introduction 32 1.7.2 Pathogenesis and Diseases Caused by Proteus 33 1.7.3 Proteus as a Nosocomial Organism 36 1.8 OVERVIEW OF THE THESIS 37 1.9 OBJECTIVES 39 2 MATERIALS AND METHODS 41 2. 1 MATERIALS USED IN THIS STUDY 41 2.1.1 Chemicals Used 41 2.1.2 Buffers used in this Study 44 2.1.3 Cheminformatic Analysis of Bacterial Volatile Organic Compound 45 2.1.4 Bacterial Strains used in the Study 45
  • 9.
    ix CHAPTER NO. TITLEPAGE NO. 2.1.4.1 Standard strains 45 2.1.4.2 Clinical isolates 46 2.2 PREPARATION OF GROWTH MEDIUM AND TEST METHOD 48 2.2.1 Antibiogram Medium 48 2.2.2 Catalase Test 48 2.2.3 Cetrimide Agar Test 48 2.2.4 Eosin Methylene Blue Agar (EMB) Test 49 2.2.5 Luria Bertani Broth 49 2.2.6 Luria Bertani Agar 49 2.2.7 Methyl Red and Voges Proskauer (MR-VP) Test 49 2.2.8 Motility Test Agar 50 2.2.9 Nutrient Broth 50 2.2.10 Phenylalanine Deaminase Test 50 2.2.11 Salmonella Shigella Agar 51 2.2.12 Simmons’ Citrate Agar 51 2.2.13 Triple Sugar Iron Agar 51 2.2.14 Tryptone Soya Broth 51 2.2.15 Tryptone Broth 51 2.2.15.1 Indole test method 52 2.2.16 Urea Broth 52 2.3 GENOMIC DNA ISOLATION 52 2.3.1 Agarose Gel Electrophoresis 53 2.3.2 Polymerase Chain Reaction (PCR) 54 2.4 EXTRACTION OF VOLATILE ORGANIC COMPOUNDS (VOCS) FROM CULTURE 54
  • 10.
    x CHAPTER NO. TITLEPAGE NO. 2.5 INSTRUMENTAL METHODS FOR VOC IDENTIFICATION 56 2.5.1 Gas Chromatographic (GC) Analysis 57 2.5.2 Gas Chromatography-Mass Spectroscopy (GC-MS) Analysis 57 2.5.2.1 GC 57 2.5.2.2 MS 57 2.5.3 Fourier Transform-Infrared (FT-IR) Analysis 58 2.5.4 Comparative Analysis of Pure Compound and the Characteristic VOC from Proteus using Gas Chromatography 58 2.6 DEVELOPMENT OF SURVEILLANCE METHOD FOR IDENTIFICATION OF CHARACTERISTIC VOC 58 2.6.1 Colorimetric Assay for Carbonyl Volatile Organic Compounds 59 2.6.2 Fluorescent Dye Reagent Specific for Carbonyl Compounds 59 2.7 STANDARDIZATION OF DNSH ASSAY FOR CARBONYL COMPOUNDS 60 2.8 FLUORESCENCE BASED DNSH ASSAY (PROTEAL) FOR DETECTION OF PROTEUS SPECIES 61 2.9 TESTING THE VOLATILITY OF 2-METHYLBUTANAL FROM CULTURE 62 2.10 LABORATORY VALIDATION OF THE PROTEAL ASSAY 62
  • 11.
    xi CHAPTER NO. TITLEPAGE NO. 2.11 SENSITIVITY AND SPECIFICITY CALCULATION 63 2.12 IDENTIFICATION OF THE METABOLIC PATHWAY USING BIOLOGICAL DATABASES 64 2.13 RATIONAL DESIGN OF GROWTH MEDIUM FOR ENHANCED 2-METHYLBUTANAL PRODUCTION 64 2.13.1 Study on the Effect of Branched Chain Amino Acids on 2-methylbutanal Production 65 2.13.2 Study on the Effect of TPP for 2-methylbutanal Production 65 2.14 REGULATION OF THE METABOLIC PATHWAY INVOLVED IN 2-METHYLBUTANAL PRODUCTION 66 2.14.1 Extraction of Total RNA from Proteus Culture 66 2.14.2 Conversion of RNA to cDNA 67 2.14.3 Quantification of Gene Expression using Real-time PCR (qPCR) 67 3 RESULTS 69 3.1 A NON-DESTRUCTIVE APPROACH FOR PATHOGEN DETECTION USING VOLATILE ORGANIC COMPOUNDS 69 3.1.1 VOC Biomarkers Found in Various Uropathogens 70
  • 12.
    xii CHAPTER NO. TITLEPAGE NO. 3.1.2 Microbiological, Biochemical and Molecular Techniques Identifies the Uropathogens 77 3.2 SOLVENT EXTRACTION WAS THE SUITABLE METHOD FOR VOC EXTRACTION FROM CULTURE 79 3.3 GAS CHROMATOGRAM IDENTIFIED THE CHARACTERISTIC COMPOUNDS OF PROTEUS AND SALMONELLA CULTURE EXTRACT 80 3.3.1 Identification of 2-methylbutanal as Specific VOC for Proteus using GC-MS and FT-IR 82 3.3.2 Comparative Analysis of the Gas Chromatogram of 2-methylbutanal and DCM-extract of Proteus Confirmed 2-methylbutanal as the Characteristic VOC of Proteus 85 3.4 DETECTION OF VOLATILE CARBONYLS USING COLORIMETRIC AND FLUORIMETRIC REAGENTS 86 3.4.1 Colorimetric Reagent Detected Micromole Levels of VOCs 86 3.4.2 Standardization of the Fluorescent Reagent Showed Better Sensitivity 87 3.4.2.1 Identification of carbonyl compounds using fluorescent reagent 2,4-DNSH 88
  • 13.
    xiii CHAPTER NO. TITLEPAGE NO. 3.4.2.2 Development of 96-well based fluorimetric assay for detection of carbonyl compounds using the optimized reagent 89 3.4.2.3 Fluorescence shift was observed between Proteus and non-Proteus organisms 90 3.4.2.4 ProteAl is found specific to Proteus among the commonly occurring Uropathogens 92 3.4.2.5 The amount of 2-methylbutanal from Proteus culture was quantified 93 3.4.2.6 The volatile component responsible for green fluorescence in ProteAl was confirmed to be 2-methylbutanal 95 3.4.2.7 The characteristic 2-methylbutanal was highly volatile 96 3.5 VALIDATION OF THE ASSAY USING VARIOUS CLINICAL UROPATHOGENS 97 3.6 RELEASE OF 2-METHYLBUTANAL BY PROTEUS THROUGH ISOLEUCINE METABOLIC PATHWAY 100 3.6.1 In Silico Analyses Revealed the Presence of the Enzymes of Isoleucine Catabolism in Proteus 101
  • 14.
    xiv CHAPTER NO. TITLEPAGE NO. 3.6.2 Enhanced Fluorescence Due to Isoleucine Supplementation in the Growth Medium 104 3.6.3 Enhancement of 2-methubutanal Production using Thiamine Pyrophosphate Supplements 106 3.6.4 LB-Isoleucine (LB-Ile) Medium Enhanced 2-methylbutanal Production Compared to other Supplemented Medium 108 3.7 TOTAL RNA WAS EXTRACTED BY PHENOL- CHLOROFORM METHOD 109 3.7.1 Total RNA was Efficiently Reverse Transcribed to cDNA 110 3.7.2 Amplified Product Showed the Presence of α-ketoacid decarboxylase (kdcA) Gene Transcript 111 3.7.3 Gene Expression of Proteus Species in LB and LB Supplemented Growth Medium 113 3.7.3.1 Isoleucine (Ile) and Thiamine pyrophosphate (TPP) addition to LB medium alters the expression of α-ketoacid decarboxylase (kdcA) Gene in P. mirabilis 113 3.7.3.2 Isoleucine (Ile) and Thiamine pyrophosphate (TPP) addition to LB medium alters the expression of α-ketoacid decarboxylase (kdcA) Gene in P. vulgaris 115
  • 15.
    xv CHAPTER NO. TITLEPAGE NO. 4 DISCUSSION 118 4.1 EXTRACELLULAR VOC HAS BEEN TARGETED FOR NON-DESTRUCTIVE DIAGNOSIS 119 4.1.1 Single Step Reaction to Provide a Sensitive Method 121 4.2 REGULATION OF THE METABOLIC PATHWAY IN PROTEUS 125 4.2.1 ProteAl is Useful in Identifying Multi-drug-resistance of Proteus 127 4.2.2 ProteAl is a Convenient Signal Generating Component of Simple and Affordable Imaging based Diagnostic and Surveillance Instrumentation 127 5 CONCLUSION 130 REFERENCES 133 LIST OF PUBLICATIONS 146
  • 16.
    xvi LIST OF TABLES TABLENO. TITLE PAGE NO. 1.1 Common infectious agents, symptoms and tests currently available for their detection 3 1.2 Advantages and disadvantages of molecular methods used for bacterial identification 16 1.3 Diseases and their odours 18 1.4 Advantages and disadvantages of some of the methods currently used for VOC analysis in clinical aspect 24 2.1 List of reagents, dyes and kits 41 2.2 List of buffers used and their composition 44 2.3 List of biochemical and microbiological tests to identify E. coli, Klebsiella, Proteus, Pseudomonas, Salmonella, Shigella and Staphylococcus 47 2.4 List of organisms and their 16S rRNA Primer sequence 53 2.5 List of environmental sample collection locations 63 2.6 Table for sensitivity and specificity calculation 63 2.7 List of genes and their primer sequences 68 3.1 Reported Volatile Organic Compounds released by various bacteria in different growth medium 71 3.2 Results of the tests performed for a few uropathogens 77 3.3 Comparative VOC profiles of Proteus with medium and negative control 81 3.4 Assay sensitivity for various carbonyl compounds 89 3.5 Validation of ProteAl using standard and clinical strains 98 3.6 Environmental sample details and the strains identified 99
  • 17.
    xvii TABLE NO. TITLEPAGE NO. 3.7 Multiple sequence alignment of aminotransferase in Lactococcus lactis and Proteus mirabilis sequence 102 3.8 Multiple sequence alignment of alpha-ketoacid decarboxylase in Lactococcus lactis and Proteus mirabilis sequence 103 3.9 Concentration of isoleucine and the fluorescence response of ProteAl 104 3.10 Concentration of Thiamine pyrophosphate and the fluorescence response of ProteAl 107 3.11 The fluorescence value of different supplemented growth medium obtained in three trials 109 3.12 Calculation of fold difference in P. mirabilis using 2-ΔΔCT method 114 3.13 Calculation of fold difference in P. vulgaris using 2-ΔΔCT method 115
  • 18.
    xviii LIST OF FIGURES FIGURENO. TITLE PAGE NO. 1.1 The percentage of death in developing countries caused by communicable and non-communicable diseases are represented in the pie chart. Communicable diseases account to 31% of deaths worldwide 2 1.2 The global market for treatment of infectious diseases shows an increase in economic burden due to viral and bacterial infections from 2008 to 2014 7 1.3 Different sources that cause hospital acquired infections 10 1.4 Colorimetric sensor array using metalloporphyrins, metal nanoparticles and acid-base indicators showing different coloured spots when reacted with VOC 22 1.5 Representative VOC metabolic pathway involving amino acids 29 1.6 A schematic diagram showing proteins produced by P. mirabilis that are known or hypothesized to be virulence factors important in urinary tract infections 34 1.7 A schematic diagram of the urinary tract showing urethra, bladder, ureters & kidneys and the indicating (red spots) are the diseases that are associated with Proteus. The virulence factors listed under each infection contribute to their pathogenicity 35 2.1 Charcoal adsorbant contained in a tissue paper bag was kept hanging above the culture or pure compound containing medium to facilitate adsorption for further analysis 55
  • 19.
    xix FIGURE NO. TITLEPAGE NO. 2.2 Silica discs were used as VOC adsorbant as shown in pictures a-c. The adsorbed VOC were eluted using suitable solvent from the silica disc a) Silica disc cut to the size of inner dimension of the Vial cap b) Silica disc placed inside of the vial cap c) Silica disc covering the mouth of the conical flask 55 2.3 Simple VOC extraction setup using a syringe, needle and a capillary tube as shown in pictures a-c. The solvent phase which collects the VOC contained in the syringe and vial were analysed using GC-MS a) shows the VOC collection using a syringe from 1.5ml vial b) shows the VOC collection with the syringe set-up from 15ml centrifuge tube c) shows the VOC collection using a capillary tube 56 3.1 The gas chromatogram of Dichloromethane extracts of LB (media control), Proteus (positive sample) and Salmonella (negative control) cultures. The unique peak for Proteus culture at 8.227 min is denoted by an arrow 82 3.2 GC analysis of DCM extract from Proteus culture and the mass spectrum of the sample at retention time 1.78 min (a) shows the gas chromatograms of volatile organic compounds in the DCM extracts of Proteus. The characteristic peak at 1.78 min in Proteus was further analyzed for identification of mass (b) is the mass spectrum of the unique compound for Proteus at Rt. 1.78 min in GC. The fragment peak at 57 m/z is the base peak showing 100% abundance and corresponding to 2-methylbutanal. No other carbonyl compound was detected from the other peaks 83
  • 20.
    xx FIGURE NO. TITLEPAGE NO. 3.3 FT-IR spectra of P. mirabilis and P. vulgaris solvent extract in comparison with 2-methylbutanal and medium blank. The Proteus samples showed the presence of carbonyl group along with the =C-H stretch corresponding to an aldehyde which is similar to the standard 2-methylbutanal. Together, the analysis was suggestive of the presence of 2-methylbutanal as the volatile organic compound in low abundance in the cultures of Proteus grown in LB 85 3.4 Comparative chromatogram of the culture extract of Proteus and standard 2-methylbutanal. The gas chromatographic peak at 2.3 min from Proteus culture extract matched with the peak for 2-methylbutanal 86 3.5 Spot detection of 2-methylbutanal vapours with 2,4 DNPH produced a bright yellow coloured product while with alcohol and blank no bright yellow coloured product was formed. Standard 2-methylbutanal ranging from 20-50 µmoles were spotted using 2,4 DNPH 87 3.6 Comparative fluorescence response of DNSH reacting with carbonyl compounds (positive) and non-carbonyl compounds (negatives) or DNSH reacting under acidic condition. The signal-to-noise ratio was high when DNSH reacts under acidic conditions. This formed the basis of the DNSH reagent preparation 88 3.7 The picture shows the fluorescence obtained from the reaction of DNSH with pure compounds. The DNSH reagent reacted with the carbonyl compounds to form respectively hydrazones showing green fluorescence while blank and acids form no product retaining the reagent’s orange fluorescence 89
  • 21.
    xxi FIGURE NO. TITLEPAGE NO. 3.8 Differentiation of carbonyl (green fluorescence) and non-carbonyl compounds (orange fluorescence). Carbonyl Compounds used: Hexanal, Nonanal, 2-methylbutanal, Benzaldehyde, Decanal, 2-nonanone, 2-tridecanone, 2-heptanone, 2-undecanone, 2-pentanone, Acetophenone, Non-carbonyl compounds- alcohols: Propanol, Ethanol, Methanol, Butanol and acids: Propionic acid, Phosphoric acid and Butyric acid all added in duplicates 90 3.9 Determination of Ex. /Em. λmax for pure compounds and bacterial cultures. The emission spectra on the left (excitation 336 nm) (a) are of pure carbonyl (hexanal and 2-heptanone), acid (propionic acid) and alcohol (butanol) compounds after reaction with DNSH under the assay conditions. The emission spectra on the right (b) are of the cultures of Proteus, UPEC and Salmonella after reaction with DNSH under the assay conditions 91 3.10 Performance of DNSH reagent on a set of standard strains distinguishing Proteus (A2 to A11& B2 to B11) with green fluorescence from the LB medium blank (A1&B1) and negatives UPEC (A12&B12, D1 to D3 & E1 to E3), Klebsiella (D4, E4, D5 & E5), E. coli (D6 to D9 & E6 to E9) and Salmonella (D10 to D12 & E10 to E12) showing orange fluorescence 92 3.11 Proteus cultures grown in LB medium showed higher fluorescence response compared to the blank and other common growth media NB, AB, and TSB 93
  • 22.
    xxii FIGURE NO. TITLEPAGE NO. 3.12 The fluorescence response of Proteus and other organisms after ProteAl. Proteus species showed maximum fluorescence compared to the medium blank and other bacteria, which have comparable response levels 94 3.13 The set of data in this composite figure compares the properties of pure 2-methylbutanal with those of DCM-extract from the Proteus culture (a) shows the fluorescence emission spectra of DNSH reacted with 2-methylbutanl matched with that of the spectrum obtained from the reaction of DNSH with the culture (b) is the standard graph for 2-methylbutanal using ProteAl assay showing sensitivity up to 1 nmol and good linearity up to 20 nmol (c) shows the graph of the fluorescence response for bacterial cultures using ProteAl performed every hour up to 24 h 95 3.14 2-metyhylbutanal is seen as a secretary VOC product as only the culture supernatant but not the cells of Proteus yielded green fluorescence (wells 7&8) after ProteAl 96 3.15 Volatility of 2-methylbutanal released by Proteus in comparison with pure compound. (a) shows that the fluorescence intensity of DNSH-derivatized carbonyl compound(s) in the Proteus cultures kept at room temperature (27 ºC), fridge (4 ºC) and on ice (0 ºC) reduces drastically as a function of temperature as well as duration of storage indicating volatile nature. (b) shows the fluorescence intensity of standard 2-methylbutanal experimented similar to Proteus culture at different temperatures 96
  • 23.
    xxiii FIGURE NO. TITLEPAGE NO. 3.16 Validation of ProteAl using 39 standard strains and 56 clinical isolates as given in table 3.5. Out of the 95 strains screened, 27 strains gave positive results indicated by bright green fluorescence. Others including uropathogenic strains showed the background orange fluorescence 97 3.17 Validation of environmental strains. Wells G 4, 5 and H 4, 5 are duplicates of standard positive control, P. mirabilis and P. vulgaris respectively. Only Proteus strains were identified by the green fluorescence while the others gave orange fluorescence 100 3.18 The putative isoleucine catabolic pathway involved in the production of 2-methylbutanal in Proteus. The metabolic pathway uses the enzymes aminotransferase and α-ketoacid decarboxylase for conversion of acid to an aldehyde 101 3.19 Fluorescence response for only Proteus increased after addition of isoleucine in the LB medium while the negatives and blank did not show any distinct effect. The profile shows that the addition of isoleucine beyond 15mM (peak concentration) actually led to the reduction in the enzyme activity 105 3.20 The bar-diagram indicates specific increase in fluorescence of Proteus to ProteAl in LB -Ile medium compared to LB or its supplementation with related branched chain amino acids. It evidently shows that only isoleucine enhances 2-methylbutanal production 106
  • 24.
    xxiv FIGURE NO. TITLEPAGE NO. 3.21 Fluorescence increased as a function of Thiamine pyrophosphate supplementation in the LB medium for Proteus. The peak indicates the concentration (2 mM) of TPP for maximal production of 2-methylbutanal. Beyond 2 mM of TPP there is a drastic reduction in 2-methylbutanal production 107 3.22 The picture shows the yield of 2-methylbutanal under growth in LB, LB-Ile, LB-TPP, LB-Ile-TPP. While LB-Ile showed the maximum 2-methylbutanal production in all the three trials 108 3.23 Ethidium bromide stained 1.5 % agarose gel shows the total RNA extracted from Proteus. Lane 1 contains a 1Kb DNA ladder. Lanes 2-4 and 5-7 contains RNA of Proteus mirabilis and Proteus vulgaris respectively 109 3.24 cDNA was synthesized from the total RNA of P. mirabilis and P. vulgaris grown in LB or LB supplemented with Ile or TPP. The cDNA preparations, which appear as smears in agarose gel electrophoresis, was used as template for qPCR amplification 110 3.25 The PCR amplified product shows distinct bands corresponding to the size of alpha-ketoacid decarboxylase gene transcript at approximately 225 bp in P. mirabilis (Fig. (a) lane 1 and Fig. (b) lanes 2&3) and P. vulgaris (Fig. (a) lane 2 and Fig. (b) lanes 4&5) 111 3.26 Sequencing results of alpha-ketoacid decarboxylase gene transcript. The red coloured basepairs denotes the sequence of kdcA gene transcript after sequencing in P. mirabilis and P. vulgaris 112
  • 25.
    xxv FIGURE NO. TITLEPAGE NO. 3.27 The fold difference in PCR template from Proteus cells growing in LB, LB-Ile and LB-Ile-TPP was calculated using the 2-ΔΔCT method. The expression of α-ketoacid decarboxylase of P. mirabilis grown in LB-Ile was found to be maximum compared to LB and LB-Ile-TPP medium corroborating with enzymatic activity data 114 3.28 The expression of α-ketoacid decarboxylase of P. vulgaris grown in LB-Ile was found to be maximum compared to LB and LB-Ile-TPP medium 116 3.29 Concept diagram showing positive feedback regulation of kdcA gene through isoleucine 117 4.1 Schematic Overview of the thesis 129
  • 26.
    xxvi LIST OF SYMBOLSAND ABBREVIATIONS Symbols α - Alpha cm - Centimeter o C - Degree Celsius eV - Electron Volt g - Gram h - Hour λmax - Lambda max L - Litre m/z - Mass-to-charge ratio m - Meter µg - Microgram µl - Microlitre µm - Micrometer µM - Micromolar µmol - Micromole mg - Milligram ml - Milliliter mm - millimeter mM - Millimolar min - Minute M - Molar ng - Nanogram nm - Nanometer nM - Nanomolar
  • 27.
    xxvii nmol - Nanomole N- Normality % - Percentage pmole - Picomole sec - Seconds U - Unit Abbreviations DNSH - 1-Dimethylaminonaphthalene- 5-sulfonylhydrazide MDNPH - 1-methyl-1-(2,4-dinitrophenyl)hydrazine TCPH - 2,4,6-trichlorophenylhydrazine DNPH - 2,4-dinitrophenylhydrazine DAIH - 2-diphenylacetyl-1,3-indandione-1-hydrazone pNPH - 4-nitrophenylhydrazine AIDS - Acquired Immuno Deficiency Syndrome ALT - Alanine transaminase kdcA - Alpha-keto decarboxylase ABD - Aminosulfonylgroup Ap–Sm–Su–Tc–Tp - Ampicillin - streptomycin – sulfamethoxazoletetracycline- trimethoprim AB - Antibiogram medium Ab - Antibody BVOCs - Bacterial Volatile Organic Compounds Bp - Base pair BLAST - Basic Local Alignment Search Tool BCATs - Branched chain aminotransferases BAW - Bulk Acoustic Wave
  • 28.
    xxviii CDC - Centreof Disease Control CAGR - Compounded annual growth rate CP - Conductive Polymer composite chemiresistors dNTP - Deoxy Nucleotide Triphosphate DNA - Deoxy Ribonucleic Acid DCM - Dichloromethane DEPC - Diethyl pyrocarbonate DBD - Dimethylaminosulfonyl group DHE - Dynamic headspace extraction EI - Electron ionization EHEC - Enterohemorrhagic Escherichia coli ETEC - Enterotoxigenic Escherichia coli EIA - Enzyme immunoassay ELISA - Enzyme linked immune sorbent assay EMB - Eosin methylene blue E. coli - Escherchia coli EDTA - Ethylene Diamine Tetra Acetic acid, di sodium salt Ex/Em - Excitation and emission wavelengths ESBL - Extended-spectrum betalactamase FID - Flame ionization detection FT-IR - Fourier Transform-Infrared GC-MS - Gas Chromatography and Mass Spectroscopy GASFET - Gas sensitive field effect transistor sensors HIV - Human Immunodeficiency Virus IgM - Immunoglobulin M IMViC - Indole, methyl red, Voges-Proskauer and citrate ICUs - Intensive care units
  • 29.
    xxix ICH &HC Instituteof Child Health and Hospital for Children ICP - Intrinsically conductive polymer chemiresistors IMS - Ion mobility spectrometry Ile - Isoleucine kb - Kilobase KPa - Kilopascal KEGG - Kyoto Encyclopedia of Genes and Genomes Leu - Leucine LED - Light emitting diode LB - Luria Bertani MOSFET - Metal oxide semiconductor field effect transistors MOS - Metal oxide semiconductors MDR - Multi-drug-resistance NCBI - National Center for Biotechnology Information NBD - Nitrobenzooxadiazole NMR - Nuclear Magnetic Resonance NASBA - Nucleic Acid Sequence Based Amplification NB - Nutrient broth ORF - Open Reading Frame OD - Optical Density PPM - Parts per million PFPH - Pentafluorophenylhydrazine PBS - Phosphate Buffer Saline PID - Photoionization detection PCR - Polymerase Chain Reaction
  • 30.
    xxx DPO - Polymer-DepositedOptical sensors PTR-MS - Proton-transfer-reaction mass spectrometry qPCR - Quantitative PCR QCM - Quartz crystal microbalance RFU - Relative Fluorescent Unit Rt - Retention time RT-PCR - Reverse Transcriptase Polymerase Chain Reaction RNaseA - RibonucleaseA RNA - Ribonucleic acid rpm - Rotations per minute SS agar - Salmonella-Shigella agar SEB - Self-encoded bead SDS - Sodium dodecyl sulfate SHE - Static Headspace Extraction SAW - Surface Acoustic Wave TPP - Thiamine pyrophosphate TSM - Thickness-shear mode TSI - Triple sugar iron test TBE - Tris Borate EDTA Tris - Tris-[Tris-(hydroxy methyl) amino methane] TSB - Tryptone Soya broth UTI - Urinary Tract Infections UPEC - Uropathogenic Escherichia coli Val - Valine VNC - Viable-but-nonculturable VOCs - Volatile Organic Compounds WBCs - White blood cells WHO - World Health Organization
  • 31.
    1 CHAPTER 1 INTRODUCTION 1.1 INCREASINGBURDEN AND THREAT OF INFECTIOUS DISEASES Technical advancements not with-standing, infectious diseases spread by microorganisms including bacteria, fungi, viruses or parasites directly or indirectly result in epidemics and pandemics. Zoonotic diseases are stoically persistent due to animal-human cohabitation and emergence of virulent variants. Non-communicable diseases, malnourishment, therapeutic interventions like chemotherapy compromise immunity and make us prone to opportunistic microbial infections. Several such factors, both due to our dominance on earth and purely man-made factors, keep us constantly on our toes to combat infectious diseases and compel us to look for new approaches against evolving threats. There is a constant battle between technical advancement including the understanding of pathogenesis at molecular level and the capability of microbial pathogens in overcoming host defense, colonize and spread. Despite the remarkable advances in research and treatments during the 20th century, infectious diseases remain among the leading causes of death worldwide (WHO report 2012) for three main reasons: (a) emerging of new infectious diseases; (b) re-emerging of the old infectious diseases; and (c) Persistence of the intractable infectious diseases (Obi et al 2010). Influenza, HIV/AIDS, cholera, tuberculosis, diphtheria, malaria etc have exploded globally and re-emerging diseases such as plague, yellow fever, dengue are on the surge (Lashley 2003). The WHO reported in
  • 32.
    2 2010 that 31%of deaths in developing countries are caused by communicable disease, while the remaining deaths are caused by other non-communicable diseases as shown in Figure 1.1. Figure 1.1 The percentage of death in developing countries caused by communicable and non-communicable diseases are represented in the pie chart. Communicable diseases account to 31% of deaths worldwide. (Reproduced from (https://mikesnexus.files.wordpress.com/2015/02/causeofdea thdevelopingcountries.jpg?w=676) Past three decades of intense research in the molecular pathogenesis, especially using modern genetics and molecular biology, have unraveled stepwise progression involving entry and adherence of pathogens to specific host cells, colonization in tissues, and the damage, which is then diagnosed as the disease. Pathogens enter the host through the orifices in our body such as eyes, mouth, genital openings or wounds that breaches the skin barrier. Though some pathogens grow at the entry site, many pathogens travel to their specific host cells and colonize, either after intracellular or extracellular invasion. Pathogens apart from growing in the host, cause severe tissue damage and diseases through the release of destructive enzymes or
  • 33.
    3 toxins. Despite suchdetailed understanding at the molecular level, our inability to combat these diseases effectively is still a challenge, as the application of emerging technologies is outsmarted by the evolution and emergence of new infectious agents to changes in the human demographics, behavior, land use and changes in the transmission dynamics. Table 1.1 provides the currently prevalent infectious agent, signs and symptoms and diagnosis available for their detection. Table 1.1 Common infectious agents, symptoms and tests currently available for their detection Causative agents by type Signs and symptoms Laboratory testing Viral Hepatitis A Diarrhea, dark urine, jaundice and flu-like symptoms i.e. fever, headache, nausea and abdominal pain. Increase in ALT, bilirubin. Positive IgM and antihepatitis A antibodies. Noroviruses Nausea, vomiting, abdominal cramping, diarrhea, fever and myalgia. Routine RT-PCR. Clinical diagnosis. Stool is negative for WBCs. Rotavirus Vomiting, watery diarrhea, low- grade fever. Temporary lactose intolerance may occur. Infants and children, elderly and immunocompromised are especially vulnerable. Identification of virus in stool via immunoassay. Other viral agents (astroviruses, adenoviruses, parvoviruses) Nausea, vomiting, diarrhea, malaise, abdominal pain, headache and fever. Identification of the virus in early acute stool samples. Serology. Commercial ELISA kits are now available for adenoviruses and astroviruses
  • 34.
    4 Table 1.1 (Continued) Causativeagents by type Signs and symptoms Laboratory testing Bacteria Bacillus anthracis Nausea, vomiting, malaise, bloody diarrhea, acute abdominal pain. Blood test. Bacillus cereus Sudden onset of severe nausea and vomiting. Diarrhea may be present. Normally a clinical diagnosis. Clinical laboratories do not routinely identify this organism. If indicated, send stool and food specimens to reference laboratory for culture and toxin identification. Campylobacter jejuni Diarrhea, cramps, fever, and vomiting; diarrhea may be bloody. Routine stool culture; Campylobacter requires special media and incubation at 42°C to grow Enterohemorrhagic E. coli (EHEC) including E. coli O157:H7 and other Shiga toxin- producing E. coli (STEC) Severe diarrhea that is often bloody, abdominal pain and vomiting. Usually, little or no fever is present. More common in children Stool culture; E. coli O157:H7 requires special media to grow. If E. coli O157:H7 is suspected, specific testing must be requested. Shiga toxin testing may be done using commercial kits; positive isolates should be forwarded to public health laboratories for confirmation and serotyping. Enterotoxigenic E. coli (ETEC) Watery diarrhea, abdominal cramps, some vomiting. Stool culture. ETEC requires special laboratory techniques for identification. If suspected, must request specific testing.
  • 35.
    5 Table 1.1 (Continued) Causativeagents by type Signs and symptoms Laboratory testing Bacteria Listeria monocytogenes Fever, muscle aches, and nausea or diarrhea. Pregnant women may have mild flu-like illness, and infection can lead to premature delivery or stillbirth. Elderly or immunocompromised patients may have bacteremia or meningitis. Blood or cerebrospinal fluid cultures. Asymptomatic fecal carriage occurs; therefore, stool culture usually not helpful. Antibody to listerolysin O may be helpful to identify outbreak retrospectively Salmonella spp Diarrhea, fever, abdominal cramps, vomiting. S. typhi and S. Paratyphi produce typhoid with insidious onset characterized by fever, headache, constipation, malaise, chills, and myalgia; diarrhea is uncommon, and vomiting is not usually severe. Routine stool cultures Shigella spp. Abdominal cramps, fever, and diarrhea. Stools may contain blood and mucus. Routine stool cultures. Staphylococcus aureus Sudden onset of severe nausea and vomiting. Abdominal cramps. Diarrhea and fever may be present. Normally a clinical diagnosis. Stool, vomitus, and food can be tested for toxin and cultured if indicated. Vibrio cholera Profuse watery diarrhea and vomiting, which can lead to severe dehydration and death within hours. Stool culture; Vibrio cholerae requires special media to grow. If V. cholerae is suspected, must request specific testing.
  • 36.
    6 Table 1.1 (Continued) Causativeagents by type Signs and symptoms Laboratory testing Parasites Cryptosporidium Diarrhea (usually watery), stomach cramps, upset stomach, slight fever. Request specific examination of the stool for Cryptosporidium. May need to examine water or food. Cyclospora cayetanensis Diarrhea (usually watery), loss of appetite, substantial loss of weight, stomach cramps, nausea, vomiting, fatigue. Request specific examination of the stool for Cyclospora. May need to examine water or food. Entamoeba histolytica Diarrhea (often bloody), frequent bowel movements, lower abdominal pain. Examination of stool for cysts and parasites—may need at least 3 samples. Serology for long-term infections. Trichinella spiralis Acute: nausea, diarrhea, vomiting, fatigue, fever, abdominal discomfort followed by muscle soreness, weakness, and occasional cardiac and neurologic complications Positive serology or demonstration of larvae via muscle biopsy. Increase in eosinophils. (Adapted from http://www.fda.gov/Food/FoodborneIllnessContaminants/ FoodborneIllnessesNeedToKnow/default.htm) The huge expenditure involved in the treatment of infectious diseases proves to be a drain on global economic resources. Figure 1.2 shows the expenditure on infectious diseases in 2008, valued to be $90.4 billion and this is expected to increase at a compounded annual growth rate (CAGR) of 8.8% and reach $138 billion in 2014. Out of the total expenditure, 53% is spent on antibiotic treatment for bacterial and fungal diseases. As bulk of it is for bacterial diseases, mainly due to a limited number of bacteria like
  • 37.
    7 Mycobacterium tuberculosis, Salmonellatyphi, Shigella spp, E. coli, Streptococcus, Pseudomonas, Proteus, Klebsiella and Camphylobacter our interest is in bringing down the bacterial diseases treatment cost which increased from $40 billion in 2009 to $50 billion in 2014. Viral disease treatments see the fastest CAGR of 12.1%, increasing from nearly $45 billion in 2009 to $79 billion in 2014, but a significant portion of this expenditure is for treating the secondary bacterial infections (Infectious Disease Treatments report 2010). Figure 1.2 The global market for treatment of infectious diseases shows an increase in economic burden due to viral and bacterial infections from 2008 to 2014 (Adapted from Infectious Disease Treatments: Global Markets BCC research market forecasting 2010) Approximately 26% of annual deaths worldwide are caused by emerging infectious diseases. The people in developing countries particularly infants and children face a heavier burden of mortality and morbidity associated with infectious diseases (diarrhoeal diseases and malaria alone is estimated to cause about three million deaths each year) (Fauci 2001, Taylor et al 2001). Developing countries like India suffer excessively from the triple burden of infectious diseases: emergence of new pathogens, communicable diseases and non-communicable diseases that are linked with lifestyle and infrastructural changes (Quigley 2006).
  • 38.
    8 Nearly half ofIndia’s disease burden is due to communicable diseases mainly because of improper sanitation, contaminated food, lack of basic health services and inadequate personal hygiene (Ministry of Health, Government of India 2005). Other demographical, environmental, and socio- economic factors also put India at risk of severe epidemics of new infections. An important take-home message for developing countries like India is to work on prevention and control of bacterial infectious diseases than spending huge amounts of money on treatment. As can be seen, the common denominator in our inability to combat these diseases is lack of field-deployable simple, inexpensive and high- throughput methodologies that have to be addressed in future developments. 1.1.1 Nosocomial Infections, Complicating Factor in the Control Despite a widespread awareness in both public health and hospital care, nosocomial infections continue to develop. Factors like increased medical procedures, decreased immunity among patients and invasive techniques create potential routes of infection, transmission of drug-resistant bacteria and ineffective control practices promote infection among hospital populations (Meenakshi 2012). Sources of hospital acquired infections are listed in Figure 1.3. A survey on the prevalence of nosocomial infections were conducted by World Health Organisation (WHO) in 55 hospitals in 14 countries representing 4 WHO Regions (Europe, Eastern Mediterranean, South-East Asia and Western Pacific). It reported an average of 8.7% of hospital patients with nosocomial infections. An estimation showed that over 1.4 million people suffer from hospital acquired complications worldwide (Tikhomirov 1987, Ginawi et al 2014).
  • 39.
    9 The highest frequenciesof nosocomial infections were reported from hospitals in the East Mediterranean (11.8%) and South-East Asia Regions (10.0%), with a prevalence of 7.7% and 9.0% respectively in the European and Western Pacific (Mayon et al 1988). The urinary tract infections (UTI), infections of surgical wounds and lower respiratory tract infections are the most frequent nosocomial infections. The WHO and other studies have also reported that the highest prevalence of nosocomial infections occurs in Intensive care units (ICUs) and in orthopaedic and acute surgical wards. Infection rates are higher among patients undergoing chemotherapy and increased susceptibility due to old age (Ginawi et al 2014). Hospital-acquired infections lead to functional disability and emotional stress to patients (Ian 2014, Ponce-de-Leon 1991). Different bacteria, viruses, fungi and parasites may cause such infections and these microorganisms are acquired by cross-infection from one person to another in the hospital or by endogenous infection caused by the patient’s own flora. Some organisms may be acquired from environment through substances recently contaminated from another human source. Before the introduction of antibiotics, and basic hygienic practices in hospital settings, most hospital infections were due to microorganisms not present in the normal flora of the patients and pathogens of external origin. (WHO: A practical guide 2002). Progress in the antibiotic treatment of bacterial infections has considerably reduced mortality from many infectious diseases. Hospital acquired infections today are caused mostly by microorganisms common in the general population (e.g. Enterobacteriaceae, Enterococci, Proteus and Staphylococcus aureus). These organisms are transmitted through discharged patients and visitors to the community (Ian 2014, Ponce-de-Leon 1991). In this regard, nosocomial infections need to be taken seriously and diagnosed for proper treatment as they pose great danger
  • 40.
    10 if ignored. Recently,Centers for Disease Control estimated that the burden reflected by hospital-acquired bacterial infections on patients and the healthcare system exceeded 30 billion dollars each year. These incidences account for the significance in mortality and morbidity rates in ICUs and more than 30% of the death rate after being hospitalized (Giske et al 2008). Inspite of treatment, such nosocomial infections increase the medical cost up to $156,000 for patients with hospital acquired infection staying longer than uninfected patients. Figure 1.3 Different sources that cause hospital acquired infections (Adapted from Prevention of hospital-acquired Infections, WHO report 2012) 1.1.2 Multidrug resistance is a Major Threat and Challenge The major challenge in disease management is the resistance developed by the pathogens for antibiotics. Multi-drug-resistance increases the morbidity and mortality (Jyoti et al 2014). Emergence of such superbugs is purely a huge man-made problem stemming out of the following factors:
  • 41.
    11 1. Indiscriminate useof antibiotics Unnecessary use of antibiotics, self-medication and non- completion of the course as health improves lead to bacterial resistance and ineffectiveness of antibiotics. Frequent use of antibiotics can harm vital organs like liver and kidney and cause other serious side effects too. 2. Horizontal gene transfer and acquisition of MDR by pathogens For the past few decades the spectrum and frequency of antibiotic- resistant infections have increased. It is attributed to mutational changes and acquisition of resistance-encoding genetic material transferred from other bacteria. This is also related to the overuse of antibiotics in human health care and in animal feeds, a combination of microbial characteristics, selective pressure of antimicrobial use, social and technical changes that enhance the transmission of resistant organisms. Hospitals play a major role in selection of multi-drug-resistance organisms by their widespread use of antimicrobials in the ICU and for immuno-compromised patients (Senka & Vladimir 2003). Methicillin-resistant Staphylococci, Vancomycin resistant Enterococci and extended-spectrum betalactamase (ESBL) producing gram negative Bacilli are identified as major problem in nosocomial infections due to horizontal gene transfer (Erika 2011). 3. Lack of new antibiotics A WHO report states that the antibiotics pipeline is drying up while resistance to existing drugs is increasing day-by-day. Two major reasons for such a situation are non-development of new formula drugs and modifications of existing ones leading to poor commercial returns as they are used only during infections (Braine 2011).
  • 42.
    12 Nosocomial infections acquiredin hospital settings occur worldwide and affect both resource-poor and developed countries. They are a significant burden for both patient and public health and one among the major causes of death leading to increased morbidity among hospitalized patients (Saranraj and Stella 2001). Every year, organisms resistant to even most potent antibiotics are identified, attracting great public concern worldwide. Since the discovery of penicillin, antibiotics were considered the “magic bullets” in curing infectious diseases. They have been misused and abused in clinical treatment due to inappropriate prescription to patients through misdiagnosis. Premature cessations of therapy not only fail to eradicate the pathogens, but also trigger resistance in the surviving bacteria. Moreover, antibiotics are sold without prescription over the counter especially in developing countries. Another major factor that causes drug resistance is the large-scale use of antibiotics in animal farming which are later consumed by human and accumulated in food chain (Report by the IMS Institute for Healthcare Informatics 2013). Major clinical challenges in both humans and animals are the MDR phenotypes. Consequently, microbes have developed cross resistance to a series of functionally and structurally unrelated drugs. Most of the life threatening pathogens for humans are zoonotic. In India the outbreak of H1N1 virus (swine flu) in 2009 killed more than 500 people and other zoonotic diseases like plague, leptospirosis are often a threat to human lives. Zoonotic diseases such as anthrax, Hepatitis E, Rabies are also very dangerous and difficult to handle when it develops multi-drug-resistance (WHO 2014). Not only underdeveloped or developing countries like India suffer from such out breaks but so do developed countries. The ampicillin (Ap), streptomycin (Sm), sulfamethoxazole (Su), tetracycline (Tc), and trimethoprim (Tp) (Ap– Sm–Su–Tc–Tp) pattern is increasingly reported among MDR E. coli and S. enterica strains isolated from food producing animals. The O104:H4 strain of
  • 43.
    13 E. coli outbreakis well known for displaying resistance to an extended spectrum of β–lactams. It was also resistant to (Ap–Sm–Su–Tc–Tp) making it difficult to locate the genes responsible for encoding the resistance phenotype (Steven et al 2013). Antibiotic resistance was identified in a miniscule portion only in Pseudomonas aeruginosa that have intrinsic and constitutive high drug tolerance (Leclercq & Courvalin 1991, Hancock 1998). Strains have attained elevated drug tolerance due to the usage of antibiotics which serve as an environmental selective pressure. The horizontal transfer of genetic materials enables the wide spread of resistance (Alonso et al 2001). The resistant genes can be transferred either by cell-to-cell conjugation, phage-mediated transduction or by naked DNA transformation. The prevalence of MDR increases the mortality and morbidity of bacterial infection, making the treatment more difficult (Ochman et al 2000). In 2010, Centre of Disease Control (CDC) has reported that bacterial infection resulted in approximately 30,000 deaths each year in the United States (Aminov 2010). MDR strains have been found towards all available antibiotics, presenting one of the biggest threats to public health. 1.2 INADEQUACY OF CLASSICAL AND CURRENT DIAGNOSTIC METHODS AND LACK OF SCREENING AND SURVEILLANCE METHODS FOR PREVENTIVE HEALTHCARE The classical method of detecting and identifying bacteria is based on culturing, enumeration and isolation of presumptive colonies for further identification analysis. In some cases, the sample needs to be homogenized, concentrated or pre-enriched prior to analysis. Bacterial cells can become injured or viable-but-nonculturable (VNC) due to the sub-lethal stressors, such as osmotic shock, acid, heat and cold which makes the analysis difficult
  • 44.
    14 (Kell et al1998). Biochemical tests depend on the unique biochemistry of microbes. Classical biochemical tests like Indole, methyl red, Voges- Proskauer and citrate (IMViC); Triple sugar iron test (TSI) are used routinely in clinical practice. However, chromogenic and fluorogenic media are now being developed by virtue of specific enzymes on the microbe converting the given substrate to coloured or fluorescent products. These methods are both tedious and time-consuming requiring a series of tests with the incubation of the microorganisms for 2-3 days. Another approach in wide use are the enzyme/substrate methods like enzyme immunoassay (EIA) and enzyme-linked immunosorbent assay (ELISA) based upon either chromogenic or fluorogenic substrate methods (Siddhesh et al 2012). Antibody (Ab)-based techniques, which takes the advantage of specific binding affinities of antibodies to specific antigens, can either be developed in the laboratory or purchased commercially. The antibodies can be specific for a single strain of bacteria, or can potentially be produced for a single species (E. coli). Once antibodies are produced, their specificity is tested for by mounting onto a support system like nylon supports, polystyrene waveguides, cantilevers and glass slides (Valerie 2014). Still all these techniques have their own disadvantages viz. development of specific antibody, laboriousness, high cost instrumentation, and lacking skilled personnel (Rachel & Stephen 2005). The limitations of these methods have led to the research focusing on development of rapid and accurate techniques to identify pathogens. 1.2.1 Limitations of Emerging Modern Methods Microarray technique combines the potential of simultaneous identification and speciation of bacteria. The rapid identification of bacteria in clinical samples is important for patient management and antimicrobial
  • 45.
    15 therapy (Georg etal 2004). In this method the bacterial samples are discriminated on a single slide. For quick detection and identification of bacteria using species-specific oligonucleotide probes designed for specific regions of various targeted genes DNA-based microarray approach is becoming popular. The high-throughput nature of microarray experiments impose numerous limitations, which apply to simple issues such as sample acquisition and data mining, to more controversial issues that relate to the methods of biostatistical analysis required to analyze the enormous quantities of data obtained (Abdullah et al 2006). The limiting step for commercialisation and further development of microarrays is the complexity and the time required to design and test discriminatory genetic regions that separate one species from another. This lack of discriminatory information also limits other molecular identification methods, including sequencing (Dennise et al 2002). Methods involving identification of surface proteins or whole-cell or its genetic material are gaining interest now. These include immunoassay techniques and molecule-specific probes, such as lipid or protein attachment- based approaches. Because of the design of the immunoassay, sample contaminants that might interfere with the antigen-antibody reaction can produce false positive results. On the other hand, nucleic acid detection methods target specific nucleic acid sequences of bacteria. These include Polymerase Chain Reaction (PCR), Quantitative PCR (qPCR), Reverse Transcriptase Polymerase Chain Reaction (RT-PCR), and Nucleic Acid Sequence Based Amplification (NASBA). These methods identify specific sequences from a complex mixture of DNA and therefore are useful for determining the presence and quantity of pathogen-specific or other unique sequences within a sample (Mark & Joyce 2005). qPCR facilitates a rapid detection of low amounts of bacterial DNA accelerating therapeutic decisions
  • 46.
    16 and enabling anearlier antibiotic treatment. Molecular recognition approaches have the potential for being more rapid, more sensitive and adaptable to a wider class of pathogens (Rachel & Stephen 2005). However, all these techniques have a setback due to the following disadvantages listed in the Table 1.2. Table 1.2 Advantages and disadvantages of molecular methods used for bacterial identification Methods Advantages Disadvantages PCR (Single) Provides sensitive detection of single gene or bacteria PCR conditions must be optimized. Multiplex PCR Reduces cost and allows rapid detection of multiple bacteria Primer design is critical and primers may interfere with each other leaving some genes and bacteria undetected. Real-time PCR Shortens detection time, detects and quantifies bacteria, high sensitivity, specificity and reproducibility Requires expensive equipment, reagents and operations by skilled technicians. Reverse- transcriptional PCR Can detect only viable cells of pathogens Skill required to handle unstable RNA for pathogen detection Nested PCR Has improved sensitivity and specificity than conventional PCR Greater expense than regular PCR as twice as much enzyme and reagents are used DNA sequencing Has high discriminatory power and reproducibility Complex method, time consuming and relatively expensive (Adapted from Frederick et al 2013)
  • 47.
    17 1.3 NEED FORNEW APPROACHES TO DEVELOP NEXT GENERATION TOOL WITH MODERN KNOWLEDGE Despite the advances in technology and medicine, infectious diseases remain a major cause of death and socioeconomic disruption for millions of people. Many bacteria are responsible for causing infectious diseases in animals and humans. Among these, bacteria like E. coli (UPEC), Shigella and Salmonella are common. Bacteria like Proteus spp. and Pseudomonas are associated with hospital-acquired infections and these are also multi-drug-resistant. Obviously these are quite dangerous and there is an increasing demand to keep them away from communities. Existing protocols for field detection and identification of such bacteria are unavailable or ineffective for surveillance. Hence it is imperative to develop next generation tool with modern knowledge. 1.3.1 Intra and Extracellular Targets for Non-Invasive and Non-Destructive Detection Methods Biomarkers are critically important tools for detection, prognosis, treatment and monitoring (Pothur et al 2002). Biomarkers are biological molecules that are indicators of physiological state and also of change during a disease process (Pradeep et al 2011). The value of a biomarker lies in its ability to provide an early indication of the disease and to monitor disease progression (Judith et al 2007). Recent studies have accumulated scientific evidences suggesting that certain surface-associated and extracellular components produced by bacteria can be used as biomarkers assisting in their identification. These bacterial components would be able to directly interact with the host cells including bacteriocins, exopolysaccharides, surface-associated and extracellular proteins. Extracellular proteins include proteins that are actively
  • 48.
    18 transported to thebacterial surroundings through the cytoplasmic membrane, as well as those that are simply shed from the bacterial surface. Compared to other bacterial components, the interactive ability of extracellular proteins has been less extensively studied (Borja et al 2010). Bacterial Volatile Organic Compounds (BVOCs) have been considered as sensitive and specific biomarkers for bacterial detection in human samples and culture media. The possibility of using VOC markers as one of the largest groups of bacterial metabolites would open a new frontier for developing more efficient techniques in the diagnosis of bacterial infections (Mohsen et al 2014). Table1.3 provides the list of common diseases and/or infections with their characteristic odours. Table 1.3 Diseases and their odours S.No Disease Odour Source 1. Anaerobic infection Rotten apples Skin / sweat 2. Bacterial vaginosis Amine-like Vaginal discharge 3. Bacterial infection Foul Sputum 4. Bladder infection Ammoniacal Urine 5. Cystic fibrosis Foul Infant stool 6. Diabetes mellitus Acetone-like Breath 7. Diphtheria Sweet Sweat 8. Phenylketonuria Musty / horsey Infant skin 9. Pseudomonas infection Grape Skin / sweat 10. Rotavirus gastroenteritis Foul Stool 11. Tuberculosis Stale beer Skin 12. Typhoid Baked brown bread Skin (Adapted from Pavlou & Turner 2000)
  • 49.
    19 1.3.2 Volatile OrganicCompounds (VOCs) as Extracellular Targets Volatile Organic Compounds (VOCs) play an important role in structuring and characterizing life. These kinds of compounds are produced by animals, bacteria, humans and plants and also provide diverse functions in both natural and artificial systems. The volatility of VOCs in the environment gives them unique characteristics making studies of such compounds challenging (Chidananda et al 2015). The production of volatiles has been recognized since millennia and has been exploited as aroma or flavour components in the production of cheese, wine and other fermenting food. Repellent odours from rotting material are produced by bacteria, indicating a chemical communication between different species (Stefan & Jeroen 2007). VOCs have relative molecular masses ranging between 30 and 300 g/mole and heavier molecules are not considered VOCs because they generally have a vapour pressure that is too low at room temperature (Alphus & Manuela 2009). Molecules with one or two polar functional groups are the most volatile ones than those with more functional groups. Non-polar molecules are generally more volatile than polar ones as the volatility is determined by their molecular weight and their intermolecular interaction. (Sichu 2009). Hence, a compound with a low molecular weight, a carbon backbone, a high vapour pressure, (greater than 0.27 KPa) and a boiling point between 50-260 ºC existing as gas under standard temperature and pressure are classified as VOCs (Turner et al 2006). Bacterial Volatile Organic Compounds (BVOCs) are produced from the primary and secondary metabolism of the organisms. The BVOCs are produced as a by-product of primary metabolism involving the breakdown of food in the environment to extract nutrients needed for the maintenance of cell structures. However, the BVOCs are produced by the microbes due to the
  • 50.
    20 environmental stress duringgrowth through secondary metabolism (Kai et al 2009, Hughes & Sperandio 2008). Information on bacterial BVOCs produced through its primary and secondary metabolisms are limited though there are many reports on VOCs released. Bacteria release a number of characteristic VOCs like aldehydes (benzaldehyde, acetaldehyde, formaldehyde, 2-methylbutanal, 3- methylbutanal, Decanal), ketones (2- tridecanone, 2-heptanone, 2-nonanone, Acetophenone, 2-undecanone, acetone), alcohols (2-pentadecanol, propanol, 1-decanol, ethanol, 1-butanol, 1-pentanol), acids (Crotonic acid, phenyl acetic acid) and compounds like hydrogen sulphide, methyl mercaptan, dimethyl sulphide, ethyl butanoate, isoprene, trimethyl amine, n-propyl acetate, dimethyl disulphide, ammonia, trimethyl amine as chemical messengers or secondary metabolites, (Lieuwe et al 2013) under defined growth conditions. These are attractive targets for developing into non-invasive diagnostic markers. In ancient times, physicians relied heavily on their senses to diagnose the infections before sophisticated analytical techniques were available. Colour, smell and taste were used to detect biological markers. VOCs are one such metabolite released from microorganisms as protection against antagonists or as signalling molecules that can be exploited for their specific detection (Nicholson & Lindon 2008). Different pathogens possess similar VOCs and therefore, the volatile profiles under defined growth conditions should be compared in order to identify the unique compound serving as an effective tool for identification. Hence, an alternate method for identifying pathogenic bacteria can be based on such characteristic metabolites generated by these organisms using specific biochemical pathways.
  • 51.
    21 1.4 CURRENT METHODSFOR DETECTION OF VOLATILE ORGANIC COMPOUNDS (VOCs) Volatile organic compounds are currently detected using a variety of methods including colorimetric sensor array, using fluorescent reagents, Gas Chromatography and Mass Spectroscopy (GC-MS), biosensors and E- nose. The description of each method is given below. 1.4.1 Colorimetric Sensor Array The colorimetric sensor array represents a new approach to array- based chemical sensing (Michael et al 2006). Such approach has emerged as a potential tool for the detection of chemically diverse analytes. Similar to the mammalian olfactory system, these arrays produce composite responses unique to an odourant based on cross-responsive sensor elements. In such sensor design architecture, one receptor responds to many analytes and many receptors respond to any given analyte (Christopher et al 2010). A distinct pattern of responses produced by the array provides the possibility of a characteristic fingerprint for each analyte. The different indicators that are available for detection on the array are shown in the Figure 1.4. Based on a broad range of chemical-sensing interactions, rather than on weak nonspecific van der Waals forces, the disposable array exhibits both excellent sensitivity and selectivity to a broad range of organic compounds. The array is well-suited for the detection of biogenically important analytes such as acids, amines and thiols. The arrays are basically nonresponsive to changes in humidity, which avoids the problem of interference due to changes in humidity during environmental sample analyses (Chen Zhang & Suslick 2005).
  • 52.
    22 Figure 1.4 Colorimetricsensor array using metalloporphyrins, metal nanoparticles and acid-base indicators showing different coloured spots when reacted with VOC (Adapted from Sung 2009). 1.4.2 Fluorescent Method for VOC Detection New technologies are being developed using conjunction of high- sensitivity fluorescence based detection to reduce the time required for the assay (Bhaskara et al 2012). Fluorescence-based assays are widely used in high-throughput screening due to their ease of operation, diverse selection of fluorophores, high sensitivity and various display readout modes. As a result, fluorescence-based assays have been applied to monitor a broad range of activities in life-science research such as air analyses, distribution of molecules, organelles or cells, enzymatic activities, molecular dynamics and interactions, and signal transduction (Frank 2008). Detection is achieved through fluorophore-tagged growth substrates included in the media that are added to samples. Upon growth, specific bacterial enzymatic activity cleaves the fluorophore from the substrates, causing fluorescence or increase in fluorescence. This fluorescence can then be detected by a number of
  • 53.
    23 instruments. It isa simple assay that is economical and time saving (Rachel & Stephen 2005). Both colorimetric or fluorimetric method provides cost effective, non-invasive and high throughput diagnostic assays. 1.4.3 Gas Chromatography and Mass Spectroscopy (GC-MS) Traditional analytical methods for VOC detection usually combines Gas Chromatography (GC) coupled most often with Mass Spectrometry (GC-MS) or a certain detection approach such as flame ionization detection (GC/FID), photoionization (GC/PID) (Petr 1984) and Electron Ionisation mode (EI). Sometimes other approaches such as membrane-inlet mass spectrometry or isolation followed by NMR spectroscopy are used (Thorn et al 2011). Though several general mass spectral libraries such as the Wiley and the NIST are available, more specialized, critically evaluated libraries are sometimes more useful for volatile compounds. These libraries are of immense use, as the closest hit within the library might uncritically be taken as positive identification. The inclusion of additional data, especially gas chromatographic retention indices, is critical for structure elucidation. GC/MS has excellent detection sensitivity and specificity, and are thus the best suited for VOC trace detection and identification but real-time direct detection could pose a challenge (Sichu 2014). Even though GC-MS analyses have enabled comprehensive studies, these tools have not emerged as routine instruments for clinical diagnosis due to high operating costs, laborious and time-consuming sample-preparation methods and requirements for significant training and expertise for effective operation and data interpretation. The limited applicability of traditional methods and analytical instruments in clinical diagnoses has prompted the need to develop simpler, cheaper, non-invasive and more user-friendly diagnostic assays for routine clinical applications. Major techniques recently involved in VOCs based
  • 54.
    24 detection of infectiousdiseases their advantages and disadvantages are given in the Table 1.4. Table 1.4 Advantages and disadvantages of some of the methods currently used for VOC analysis in clinical aspect Method Advantage Disadvantage Gas chromatography with mass spectroscopy 1. Identification of unknown VOCs and profiling possible 2. Sensitivity in the ppb range 3. Reproducible 1. Cannot detect non‐ volatile, polar and thermally labile compounds 2. Requires lengthy sample preparation (hydrolysis/ derivatization) Ion mobility spectrometry (IMS) 1. No pre-concentration needed 2. Sensitivity in the ppm range 3. Mobile system 4. Low cost 5. Suitable for clinical use 1. Low resolving power, 2. Lack of positive identification 3. Instability of response (due to humidity and other matrix interferences) 4. The sensitivity of the IMS is reduced due to the low pressure operation of the ionization region and drift tube. 5. Real-time measurements not Possible Selected ion flow tube mass spectrometry 1. Measures VOCs in real time 2. Potential for online testing 3. VOC measurement in headspace (serum/urine) 4. Sensitivity in the ppb range VOC chemical identification and profiling not possible Uses carrier gas, less sensitive than PTR-MS
  • 55.
    25 Table 1.4 (Continued) MethodAdvantage Disadvantage Proton transfer spectrometry 1. No pre-concentration needed 2. Real-time measurements and online monitoring 3. Sensitivity in the ppb range Large and costly instrument mass interferences, library of compounds still to be created. Various chemical sensor matrix platforms/e-noses 1. Easy to use 2. Portable 3. Sensitivity in the ppb range May need chemometric processing, suffers from cross-sensitivities (Adapted from Shneh et al 2013) 1.4.4 Biosensors A variety of chemical sensors, including biosensors and E-noses have demonstrated the feasibility of VOC detection. Chemical sensors detect odour molecules based on the reaction between the odour molecules and the target sensing materials on the sensor surface. This reaction triggers a certain change in mass, volume or other physical properties which is then converted to an electronic signal by a transducer. There are different types of transducers for chemical sensors like optical, electrochemical, heat-sensitive and mass-sensitive. The most common chemical sensors includes surface acoustic wave sensor, quartz crystal microbalance sensor, metal oxide semiconductor sensor, and polymer composite-based sensor biosensors. They are currently drawing interest as it comes with reliable results in much shorter detection time (Vijayata et al 2014).
  • 56.
    26 1.4.5 E-nose E-noses havedrawn much attention since it is the most promising approach so far for high sensitivity and mimicking the biological nose respectively for sensing. The electronic-nose detects volatile compounds with an array of semi-conducting polymer sensors that enables the user to map aroma pattern in a graphical or digital format. It comprises of an array of chemical sensors with different selectivity, a signal-preprocessing unit and a pattern recognition system. The interaction between volatile organic compounds with an array of sensors generates a characteristic fingerprint which can be recognized by comparing it with previously recorded patterns in the recognition system (Simeng et al 2013). Electronic noses can be used for detecting bacterial pathogens, either in vitro or in vivo, or as a potential tool for the identification of patients with diseases. They employ conductivity sensors like Metal oxide semiconductors (MOS), Intrinsically conductive polymer chemiresistors (ICP) and Conductive Polymer composite chemiresistors (CP); Electrostatic Potential sensors like Metal oxide semiconductor field effect transistors (MOSFET) and Gas Sensitive Field Effect Transistor sensors (GASFET); Acoustic Resonance Sensors like Thickness-shear mode / Quartz Crystal Microbalance / Bulk Acoustic Wave (TSM / QCM / BAW) and Surface Acoustic Wave (SAW) and Optical Vapour sensors like Polymer-deposited Optical sensors (DPO) and self-encoded bead (SEB) (Simeng et al 2013). Though biosensors/ E-nose can process in a single run, the chance of capturing and identifying a small amount of pathogens present in samples is difficult (Andre et al 2002). Different sampling methods have been used for the volatile compound detection in order to distinguish between normal and infected specimens and their detectable range (Ida et al 2006). The rapid screening of biological samples could allow faster and appropriate therapeutic
  • 57.
    27 treatment and wouldlead to decrease in mortality rate over classical cultivation and isolation methods. However, there is still much work to do before biosensors become a real alternative for pathogen detection (Olivier et al 2007). A recent review states that studies on VOC based identification of infectious diseases are limited when compared to other identification methods. The major sources for detection of VOCs related to infections are the respiratory tract, gastrointestinal tract, urinary tract and nasal cavity. The upcoming analytical technologies for detection and measurement of volatile organic compounds (VOCs) had shown advantages in clinical applications. Hence, the interest for their use in evaluating the diagnostic potential of VOCs for different diseases has increased. VOCs as specific biomarkers in clinical samples open up a new direction for developing rapid and potentially inexpensive disease screening tools. Most of the studies on volatile biomarkers have been carried out on exhaled-breath samples, although other clinical matrices, such as urine and faeces, have also been investigated (Kamila & Ian 2015). 1.5 REGULATION OF VOLATILE ORGANIC COMPOUND METABOLISM Bacteria and fungi are capable of producing a wide variety of biochemical compounds via primary and secondary metabolism. During primary metabolism, the organism breaks down food in the environment to extract nutrients needed for the maintenance of cell structures and, in the process, creates VOC's as by-products (Karen & Santo-Pietro 2006). In secondary metabolism, there is a competition for resources in a nutrient-poor environment thereby driving the production of VOC. Although the distinction between primary and secondary metabolism is not absolute, the secondary metabolism is known to start after active growth has ceased. Secondary
  • 58.
    28 metabolites have diversechemical structures and are distinct products of particular groups of organisms and sometimes even strains (Vining 1990). The function of secondary metabolites in the organism is not clear, but the process seems to have different purposes owing to their remarkable variety and many different chemical structures (Bentley & Bennett 1988). Volatile aldehydes have been found to be produced by a variety of microorganisms. Acetaldehyde is formed through oxidative carboxylation of acetolactate, a by-product of the synthesis of leucine in yeasts (Berry 1988). Unsaturated fatty acids may be transformed to volatile aldehydes such as hexanal, heptanal and nonanal, and the precursors of 2-decenal, 2 undecenal and 2-heptenal are linoleic and linolenic acid (Korpi 2001). In certain studies investigating the emission of VOCs during microbial growth showed that the concentration of aldehydes decreased as though the microorganisms had consumed the aldehydes. The growth of microorganisms generates volatile metabolites, but the lack of knowledge about metabolic routes makes it generally unclear whether all compounds found in relation to microbial growth really are a metabolic product or whether microbial growth or moisture promote(s) emission of compounds from a substrate (Ezeonu et al 1994). Amino acid, such as alanine, valine, leucine, isoleucine, phenylalanine and aspartic acid, are also involved in aroma biosynthesis as direct precursors, and their metabolism is responsible for the production of a broad number of compounds, including acids, carbonyls, alcohols and esters. The information available to date on the biosynthesis of amino acid-derived volatiles is based on precursor feeding experiments with radio-labelled, stable-isotope-labeled, or unlabeled precursors (Muna et al 2013). Amino acids can undergo an initial deamination or transamination leading to the formation of the corresponding molecules alpha-keto acid.
  • 59.
    29 Subsequent decarboxylation followedby reductions, oxidations or esterifications give rise to aldehydes, acids, alcohols and esters (Reineccius 2006). A general pathway is shown schematically in Figure 1.5. Branched chain volatile alcohols, aldehydes and esters arise from the branched chain amino acids leucine, isoleucine and valine. The general scheme of biosynthesis is thought to proceed in a similar way as that in bacteria or yeast, where these pathways have been more extensively studied (Beck et al 2002, Tavaria et al 2002). Figure 1.5 Representative VOC metabolic pathway involving amino acids From the wide range of reported VOCs, a number of aldehydes and ketones were found to be predomina3.5 ntly produced by bacteria. Besides hydrazines, a multitude of different groups of derivatizing agents has been established for the analysis of carbonyl compounds. All of these comprise of a condensation reaction of the reagent with the analyte under formation of a colored and/or fluorescent derivative.
  • 60.
    30 Therefore, detection maybe performed by photometry or fluorescence spectroscopy (Martin et al 2000). Though reports suggest a variety of dyes like 2,4-dinitrophenylhydrazine (DNPH), 1-Dimethylaminonaphthalene- 5-sulfonylhydrazide (Dansyl hydrazine, DNSH), nitroaromatic hydrazines, 2-diphenylacetyl-1, 3-indandione-1-hydrazone (DAIH), 4-nitrophenylhydrazine (pNPH), 1-methyl-1-(2,4-dinitrophenyl)hydrazine (MDNPH), Nitrobenzooxadiazole (NBD derivatives), a Dimethylaminosulfonyl group (DBD) or an aminosulfonyl (ABD) group, 2,4,6-trichlorophenylhydrazine (TCPH), Pentafluorophenylhydrazine (PFPH) and halogenated phenyl hydrazine reagents specific for carbonyl compound, DNSH has been found to be best suited owing to its lower level detection in atmospheric samples (Laurent et al 2004). The importance of derivatizing agents for the analysis of aldehydes and ketones becomes apparent from the literature search for respective analytical developments and applications. The chemical abstract database which covers literature from 1967 until today, lists more than 1500 articles which focus on derivatization techniques for the analysis of carbonyl compounds (Jan & Ki-Hyun 2015) Therefore, release of a number of carbonyl compounds as specific VOCs by bacteria and availability of a variety of reagents for their detection prompted us to focus on carbonyl compounds as specific biomarker in this study. 1.6 RATIONAL DESIGN OF MEDIA FOR ENHANCED VOLATILE ORGANIC COMPOUND PRODUCTION The biosynthesis of VOCs depends on the availability of carbon, nitrogen and sulfur as well as energy provided by primary metabolism. Therefore, the availability of these building blocks has a major impact on the
  • 61.
    31 concentration of anysecondary metabolite, including VOCs, demonstrating the high degree of connectivity between primary and secondary metabolism. Biosynthesis of the wide array of different VOCs branches off from only a few primary metabolic pathways. Based on their biosynthetic origin, all VOCs are divided into several classes, including fatty acid derivatives and amino acid derivatives in addition to a few species-/genus-specific compounds not represented in those major classes (Stefan & Jeroen 2007). The medium composition has a great influence on both qualitative and quantitative production of volatile metabolites. In general, nutrient-rich media promote larger quantities of VOC than nutrient-poor media. The emission of VOC changes with the growth phase of the bacterial culture (Malik 1979). Additionally many factors affect volatile composition, including the genetic makeup, degree of maturity, environmental conditions such as pH of the medium, levels of CO2 or O2, moisture and temperature (Maria et al 2013). There are several pathways involved in volatile biosynthesis starting from lipids and amino acids. Once the basic skeletons are produced via these pathways, the diversity of volatiles are achieved via additional modification reactions such as acylation, methylation, oxidation/reduction and cyclic ring closure (John et al 2007). Thus, the medium composition / growth conditions can be manipulated in order to achieve an enhanced VOC release. 1.7 PROTEUS AS A MODEL STUDY ORGANISM In this work we have chosen Proteus, a notorious nosocomial pathogen as a model organism and have identified its VOC biomarker. The general introduction about the organism and its pathogenicity are described in detail.
  • 62.
    32 1.7.1 Proteus –GeneralIntroduction Kingdom : Bacteria Phylum : Proteobacteria Class : Gamma proteobacteria Order : Enterobacteriales Family : Enterobacteriaceae Genus : Proteus Species : P. mirabilis and P. vulgaris Proteus species are Gram-negative, facultatively anaerobic, rod shaped bacterium. It shows swarming motility, and urease activity. Proteus organisms are implicated as serious reason of infections in humans, along with Escherichia coli, Klebsiella, Enterobacter and Serratia species. Some of the species of Proteus causing urological diseases are P. mirabilis, P. rettgeri, P. vulgaris, P. norganii, P. penneri, P. hauseri and P. myxofaciens. However, P.mirabilis and P.vulgaris are more prevalent than other species. Proteus species are found in multiple environmental habitats including human intestinal tract as part of normal human intestinal flora and long term care facilities. In hospital settings, it is not unusual for gram-negative bacillus to colonize both the skin and oral mucosa of both patients and hospital personnel. P. mirabilis causes 90% of all 'Proteus' infections in humans and also can be considered a community-acquired infection (http://emedicine. medscape.com/article/226434-overview). Proteus vulgaris and Proteus penneri are isolated from individuals in long-term care facilities hospitals and from patients with underlying diseases or compromised immune systems. Patients with recurrent infections, with structural abnormalities of the urinary tract, those who have had urethral instrumentation, and those whose infections were acquired in the hospital have an increased frequency of infection caused by Proteus (Guentzel 1996).
  • 63.
    33 Proteus species undergoesdramatic morphological changes, from a single rod-shaped swimmer cell to an elongated multicellular swarmer cell, in response to growth on solid surfaces (Holt et al 1994).Most strains produce a powerful urease enzyme, which rapidly hydrolyzes urea to ammonia and carbon dioxide (Ryan et al 2004, Rauprich et al 1996, Matsuyama et al 2000). Urea → 2NH3+ CO2 Proteus species are the causative agent of a variety of opportunistic nosocomial infections including those of the respiratory tract, eye, ear, nose, skin, burns, throat, and wounds; it also may cause gastroenteritis. Proteus mirabilis causes serious kidney infections which can involve invasion of host urothelial cells. Reports suggest prevalence of 17% for P. mirabilis and 5% for P. vulgaris in the faeces of healthy persons. Urinary pathogens are thought to originate mainly from the gut and it is interesting that P. mirabilis is disproportionately more frequently isolated from patients with urinary-tract infections than P. vulgaris (Krikler 1953). 1.7.2 Pathogenesis and Diseases Caused by Proteus Infection depends on the interaction between the infecting organism and the host defense mechanisms. Various components of the membrane interplay with the host to determine virulence. Proteus species in addition, to the outer membrane contains a lipid bilayer, lipoproteins, polysaccharides and lipopolysaccharides. The first step in the infectious process is adherence of the microbe to the host tissue. Fimbriae facilitate adherence and thus enhance the capacity of the organism to produce disease. P. mirabilis like E. coli, and other gram-negative bacteria contain pili, which are tiny projections on the surface of the bacterium. Specific chemicals located on the tips of pili enable organisms to attach to selected host tissue sites (eg. urinary tract endothelium). The virulence factors produced by P. mirabilis are shown in
  • 64.
    34 Figure 1.6. Theadhesion of Proteus species to uroepithelial cells initiates several events in the mucosal endothelial cells, including secretion of interleukin 6 and interleukin 8. Proteus organisms also induce epithelial cell desquamation (Christopher et al 2000). Figure 1.6 A schematic diagram showing proteins produced by P. mirabilis that are known or hypothesized to be virulence factors important in urinary tract infections (Adapted from Christopher et al 2000) Urease production, together with the presence of bacterial motility and fimbriae, may favor the production of upper urinary tract infections. When the pathogen enters the bloodstream, endotoxin, a component of gram- negative bacteria cell walls, apparently triggers a cascade of host inflammatory responses and leads to major detrimental effects. Thus the factors for pathogenesis include adherence to host mucosal surfaces, damage and invasion of host tissues, evasion of host immune systems, and iron acquisition. The ability of Proteus organisms to produce urease and to alkalinize the urine by hydrolyzing urea to ammonia makes it effective in producing an environment in which it can survive. The activity of a urease enzyme, causes polyvalent cations, such as Mg2+ and Ca2+ , to precipitate out of the urine and form struvite and carbonate hydroxyapatite crystals (Griffith et al 1976). The mineral structures also provide bacteria a habitat to hide from antibiotic treatment and the host immune cells (Li et al 2002).
  • 65.
    35 An infection occurswhen microorganisms, usually bacteria, from the digestive tract, cling to the opening of the urethra and begin to multiply. An infection limited to the urethra is called urethritis. From there, bacteria often move on to the bladder, causing a bladder infection called cystitis. If the infection is not treated promptly, bacteria may then go up the ureters to infect the kidneys (Mobley 1987). This infection is called pyelonephritis shown in Figure 1.7. Presumably, males are less prone to ascending UTIs than females because of their longer urethrae. Since the urinary tract is open to the external environment, it is easy for pathogens to gain entry and establish infection. Due to the production of urease by this organism, infection with P.mirabilis not only develops into cystitis and acute pyelonephritis but also causes stone formation in the bladder and kidneys. Urolithiasis is a hallmark of infection with this organism (Griffith 1976). Figure 1.7 A schematic diagram of the urinary tract showing urethra, bladder, ureters & kidneys and the indicating (red spots) are the diseases that are associated with Proteus. The virulence factors listed under each infection contribute to their pathogenicity (Adapted from Caroline et al 2000).
  • 66.
    36 1.7.3 Proteus asa Nosocomial Organism Proteus mirabilis is the second most common cause of urinary tract infection and is also an important cause of nosocomial infections. Bacteriuria occurs in 10% -15% of hospitalized patients with indwelling catheters. The risk of infection is 3% -5% per day of catheterization. In contrast, individuals with multiple prior infections of UTI, multiple antibiotic treatments, urinary tract obstruction, or infection developing after instrumentation frequently become infected with Proteus bacteria. Proteus mirabilis is susceptible to nearly all antimicrobials except tetracycline. It is sensitive to ampicillin, broad-spectrum penicillins such as ticarcillin, piperacillin, first-, second-, and third generation cephalosporins, imipenem and aztreonam; Proteus vulgaris and Proteus penneri are sensitive to trimethoprim and sulfamethoxazole, quinolone, imipenem and fourth generation cephalosporins. P. mirabilis, is believed to be the most common cause of infection-related kidney stones, one of the most serious complications of unresolved or recurrent bacteriuria (Ali et al 1998). Multi-drug-resistance strains of P. mirabilis generally produce extended-spectrum lactamasesor the AmpC type cephalosporinase and rarely carbapenemases and their prevalence in some settings is relatively high. Proteus species were found to have high antimicrobial resistance against tetracycline, chloramphenicol. It is susceptible to some antibiotics like chloramphenicol, vancomycin, and amoxicillin (Gus & Michael 2014). However, regular drug administration to these strains increases the multi-drug resistance property. Coliforms and Proteus species rarely cause extra-intestinal disease unless host defenses are compromised. Disruption of the normal intestinal flora by antibiotic therapy may allow resistant nosocomial strains to colonize or overgrow. Nosocomial strains progressively colonize the intestine and
  • 67.
    37 pharynx with increasinglength of hospital stay, resulting in an increased risk of infection. These infections are often difficult to treat because of high levels of antibiotic resistance among bacteria in the hospital environment. The bacteria responsible for many common outpatient infections have also developed resistant strains, which are creating new obstacles to effective treatment (Butler et al 2001). Prevention of infections, particularly those that are hospital acquired, is difficult and perhaps impossible. Sewage treatment, water purification, proper hygiene, and other control methods for enteric pathogens will reduce the incidence of such enteropathogens. However, these control measures are rarely available in less developed regions of the world. Doctors, staff and other workers in hospitals can do much to reduce nosocomial infections through identification and control of predisposing factors, education and training of hospital personnel, and limited microbial surveillance (Emily & Trish 2011). Since field deployable rapid detection methods are not available for Proteus, developing effective non-invasive detection method using Volatile Organic Compounds (VOC) released by them has been conceived for next generation diagnostics and surveillance. We have developed a technique that has tremendous potential in non-invasive diagnosis and remote identification. 1.8 OVERVIEW OF THE THESIS The analysis of Volatile Organic Compounds (VOCs) in biological specimens has attracted a considerable amount of clinical interest over the past two decades. It is well known that a number of infectious or metabolic diseases could liberate specific odour characteristics of the disease stage, which can be noticeable in the sweat, breath, urine or the stools (Bekir 2004).
  • 68.
    38 Any disorder inthe normal function of the body results in the liberation of complex volatile mixtures through the same media. Urinary Tract Infection (UTI), a disease which is dangerous and unrecognized forerunner of kidney disorders is addressed in this thesis. The potential of diagnostic power of VOC is not much prominent because the odour that is emanating from pathogenic bacteria may be tough to be detected and discriminated. The forthcoming chapters analyses the conventional techniques available for identification of bacteria by volatiles. It provides a potentially non-invasive means of diagnosis and monitoring of pathological processes through simple fluorescent assay named ProteAl. The first chapter of the thesis deals with the basic information on infectious diseases their mortality rate and the availability of conventional and modern methods for their identification. The chapter then elaborates on the use of extracellular target (VOC) for bacterial identification, the current analytical methods available, their limitations and alternate methods that can be employed. The next aspect of the chapter focuses on the metabolic pathways that are well established in bacteria for the production of various VOCs. The last aspect of the chapter describes why Proteus, has been taken as case study in this thesis. The methodology and the resources used in the study in order to execute the objectives are dealt in the second chapter. The study in general employed the common biochemical, microbiological and molecular biology reagents, solvents and techniques. The details of all the analytical instruments involved are also described. A few methods that were slightly modified for specific application are also elaborated in this chapter. The results obtained from the experiments carried out in the study are described in the third chapter. The first section of this chapter provides the
  • 69.
    39 results pertaining tothe literature survey done to catalogue characteristic bacterial VOCs, extraction of VOCs from Proteus. The second section explains the results obtained from GC-MS, FT-IR analyses. The third section describes the development of colorimetric and fluorimetric assays for bacterial volatile aldehyde detection. The final section deals with the identification of metabolic pathway for 2-methylbutanal production in Proteus. The enhancement of 2-methylbutanal production by manipulating the growth medium with an amino acid isoleucine is revealed in this section. The variation in gene expression due to isoleucine supplementation is also focused in this chapter. The fourth chapter discusses the important findings of this study relating it to the existing methods. The first section explains the need for new thoughts for developing diagnostic assays, the significance of the method developed and their need. The next section elaborates on the 2-methylbutanal pathway and the significance of the supplemented media. The last section explains how the current findings are novel and its applications. The future scope of the study is explained with a conceptual diagram in the final section of this chapter. 1.9 OBJECTIVES The emergence and necessity for constant surveillance of UTI pathogens prompted us to develop an appropriate non-invasive instrumentation methodology. Since nondestructive and remote identifications are preferred for early diagnostics and surveillance, identification of such volatile compounds offered a promising approach. Considering the current clinical/diagnostic requirement the following objectives have been framed:  Investigation of characteristic Volatile Organic Compound of various organisms under defined growth conditions.
  • 70.
    40  Characterization andelucidation of structure of the characteristic VOC of Proteus species using instrumental analysis.  Development of simple non-invasive, non-destructive and most sensitive assay for the detection of the specific VOC of Proteus.  Validation of the developed assay using known clinical isolates and environmental samples.  Metabolic study using molecular biology tools to understand specific VOC biosynthesis and its regulation for hyper production.  Rational design of growth media for enhanced VOC production in order to improve the sensitivity.
  • 71.
    41 CHAPTER 2 MATERIALS ANDMETHODS 2.1 MATERIALS USED IN THIS STUDY The Table 2.1 and 2.2 gives the details of various chemicals, buffers and primer sequences used in our study. 2.1.1 Chemicals Used The chemicals such as organic, inorganic, acids, indicators, reagents etc. used in the study are tabulated below. Table 2.1 List of reagents, dyes and kits S. No. Chemicals Suppliers 1. Acids Acetic acid SRL, India Boric acid Merck Butyric acid Merck Hydrochloric acid SRL India Phosphoric acid Merck Propionic acid Merck 2. Alcohols Butanol Merck Ethanol Hayman, UK Methanol SRL India
  • 72.
    42 Table 2.1 (Continued) S.No. Chemicals Suppliers 3. Aldehydes Benzaldehyde Alfa Aesar Decanal Alfa Aesar Hexanal Alfa Aesar Nonanal Alfa Aesar 2-methylbutanal Spectrochem 4. Amino acids Isoleucine Himedia Leucine Himedia DL-Phenylalanine Himedia Valine Himedia 5. Enzymes DNase New England Biolabs Proteinase K Sigma-Aldrich Taq DNA Polymerase New England Biolabs 6. Growth medium Agar Himedia Casein acid hydrolysate Himedia Casein enzyme hydrolysate (Tryptone) Himedia Cetrimide Agar Himedia Eosin Methylene Blue Agar Himedia Methyl Red and Voges Proskauer agar Himedia Nutrient broth Himedia Salmonella Shigella Agar Himedia Simmons’ Citrate Agar Himedia Triple sugar iron agar Himedia Tryptone soya broth Himedia Urease broth Himedia Yeast extract Himedia
  • 73.
    43 Table 2.1 (Continued) S.No. Chemicals Suppliers 7. Ketones Acetophenone Alfa Aesar 2-heptonone Alfa Aesar 2-nonanone Alfa Aesar 2-pentanone Alfa Aesar 2-tridecanone Alfa Aesar 2-undecanone Alfa Aesar 8. Molecular kits PCR Purification Kit QIAGEN cDNA reverse transcription kit Applied Biosystems 9. Molecular Reagents Agarose Lonza, USA Diethylpyrocarbonate (DEPC) Sigma deoxynucleoside triphosphates (dNTP’s) New England Biolabs Ethylenediaminetetra acetic acid (EDTA) SRL India Ethidium bromide SRL India Phenol Sigma Aldrich Sodium dodecyl sulphate (SDS) SRL India Tris base Merck 10. Molecular markers DNA Ladder (100bp) New England Biolabs DNA Ladder (1Kb) New England Biolabs 11. Reagents Barritt reagent A Himedia Barritt reagent B Himedia 2,4 dinitrophenyl hydrazine (DNPH) Sigma Aldrich 5-dimethylaminonaphthalene- 1-sulphonyl hydrazine (DNSH) Sigma Aldrich Kovac’s reagent Himedia Methyl red Merck
  • 74.
    44 Table 2.1 (Continued) S.No. Chemicals Suppliers 12. Salts Disodium phosphate Merck Ferric chloride Merck Sodium acetate SRL India Sodium chloride Merck Sodium hydroxide Merck 13. Solvents Acetonitrile Fischer Scientific Chloroform Fischer Scientific Dichloromethane SRL India Diethyl ether SRL India Dimethyl sulphoxide SRL India Ethyl acetate SRL India Hydrogen peroxide Merck n-hexane SRL India 14. Vitamin Thiamine pyrophosphate (TPP) Himedia 2.1.2 Buffers used in this study The buffers used in the study and their composition are tabulated in Table 2.2. Table 2. 2 List of buffers used and their composition Buffers Composition pH Tris Borate EDTA (TBE) Tris base; Boric acid, 0.5M EDTA 8.0 TNES buffer 0.01 M Tris, 0.4 mM Nacl, 0.1 M EDTA, 0.5% SDS 8.0
  • 75.
    45 2.1.3 Cheminformatic Analysisof Bacterial Volatile Organic Compound Initially, an extensive literature survey was done to catalogue VOCs released by known pathogenic bacteria including Actinobacillus, Bacillus, Citrobacter, Clostridium difficile, E. coli, Enterobacter, Enterococcus faecalis, Klebsiella, Mycobacterium tuberculosis, Neisseria meningitides, Proteus, Psuedomonas, Salmonella, Serratia marcescens, Shigella, Staphylococcus and Xanthomonas campestris. Each organism produces a variety of compounds under different growth conditions. A set of acids, alcohols, aldehydes, esters, hydrocarbons, ketones, nitrogen and sulphur containing compounds have been identified to be produced by the bacteria during their growth. Each of these compounds serves as a signature for the organism in different growth medium. The lists of compounds produced by each organism grown under different growth medium are tabulated in the result section (Table 3.1). 2.1.4 Bacterial Strains used in the Study The details of the standard reference strains and well characterized clinical isolates are given below. 2.1.4.1 Standard strains Standard strains of Shigella flexineri (MTCC-1457 (ATCC- 29508), MTCC-9543), Salmonella paratyphi (MTCC 3220), Salmonella enterica subspecies (MTCC 3231), Proteus mirabilis (MTCC-425 (ATCC7002)), Proteus vulgaris (MTCC-426 (ATCC6380)), E. coli (MTCC-
  • 76.
    46 723, 443 (ATCC-25922),901(ATCC-13534), Klebsiella (MTCC-3384, ATCC- 13883) and Staphylococcus aureus (MTCC-3160) were obtained from Microbial Type Culture Collection (MTCC), Chandigarh. E. coli (ATCC- 25922), Staphylococcus aeureus (ATCC-25923) and Pseudomonas aerunginosa (MTCC-27853) were obtained from Sri Ramachandra University, Chennai, Tamilnadu, India. 2.1.4.2 Clinical isolates Clinical diarrheagenic Escherichia coli strains were isolated from stool samples of children, who were hospitalized with acute or persistent diarrhea at the Institute of Child Health and Hospital for Children (ICH and HC), Chennai, Tamilnadu, India. Salmonella typhimurium strain was obtained from Sri Ramachandra University, Chennai and Uropathogens such as Uropathogenic E. coli (UPEC), Klebsiella, Proteus mirabilis, Proteus vulgaris, Pseudomonas aeruginosa, Citrobacter and Staphylococcus aureus were obtained from M/s Trivitron Healthcare Ltd, Chennai, Tamilnadu, India. The strains were confirmed by standard microbiological, biochemical tests and Sensititre GNID identification plate for gram negative organisms from TREK diagnostics systems, UK. The strains were further confirmed by 16S rRNA sequencing. The lists of tests performed for identification of E. coli, Klebsiella, Proteus, Pseudomonas, Salmonella, Shigella and Staphylococcus are given in Table 2.3.
  • 77.
    47 Table 2.3 Listof biochemical and microbiological tests to identify E. coli, Klebsiella, Proteus, Pseudomonas, Salmonella, Shigella and Staphylococcus S. No E. coli Klebsiella Proteus Pseudomonas Salmonella Shigella Staphylococcus 1. Catalase Catalase Catalase Catalase Catalase Catalase Catalase 2. --- --- --- Cetrimide Agar --- --- --- 3. Eosin Methylene Blue --- Eosin Methylene Blue --- --- --- --- 4. Indole Indole Indole Indole Indole Indole Indole 5. --- --- Urease --- --- --- Mannitol salt agar 6. Methyl red– Voges-Proskauer Methyl red– Voges-Proskauer Methyl red– Voges-Proskauer Methyl red– Voges-Proskauer Methyl red– Voges-Proskauer Methyl red– Voges-Proskauer Methyl red– Voges-Proskauer 7. Motility Motility Motility Motility Motility Motility Motility 8. Salmonella Shigella Agar --- Salmonella Shigella Agar --- Salmonella Shigella Agar Salmonella Shigella Agar --- 9. --- --- Phenylalanine Deaminase Test Simmons’ Citrate Agar Simmons’ Citrate Agar --- --- 10. Triple Sugar Iron Triple Sugar Iron Triple Sugar Iron Triple Sugar Iron Triple Sugar Iron Triple Sugar Iron Triple Sugar Iron
  • 78.
    48 2.2 PREPARATION OFGROWTH MEDIUM AND TEST METHOD The preparation methods and composition for various growth medium used in this study are described below. For biochemical and microbiological tests the growth medium was prepared as per the manufacturer’s (Himedia) instructions. 2.2.1 Antibiogram Medium Antibiogram medium (AB) was prepared according to the reported procedure (Alagumaruthanayagam et al 2009) by dissolving 1 g of tryptone, 1 g of casein acid hydrolysate, 0.5 g of yeast extract and 1 g of Sodium chloride (NaCl) in 1 L of distilled water after the pH was adjusted to 7.2 with 1 M Sodium hydroxide, the broth was autoclaved at 15 lbs pressure for 20 min. 2.2.2 Catalase Test Catalase test was performed by growing the culture in LB medium. To one loop of culture taken in a clean slide 1 drop of hydrogen peroxide was added. A positive reaction was indicated by bubbling. 2.2.3 Cetrimide Agar Test Cetrimide agar was prepared by suspending 45.3 g in 1 L distilled water and the pH was adjusted to 7.2 with 1 M Sodium hydroxide. The agar was sterilized by autoclaving at 15 lbs pressure for 20 minutes. Using streak method the culture was inoculated directly on Cetrimide Agar. The presence of characteristic blue, blue-green, or yellow-green pigment indicated the presence of Pseudomonas.
  • 79.
    49 2.2.4 Eosin MethyleneBlue Agar (EMB) Test EMB agar was prepared by dissolving 35.96 g in 1 L of distilled water after the pH was adjusted to 7.2 with 1 M Sodium hydroxide, the agar was autoclaved at 15 lbs pressure for 20 min. The bacterial culture was streaked on EMB agar plate using the quadrant streak plate method. Since E. coli ferments lactose it produced strong acid end-products, indicated by the development of green metallic sheen. 2.2.5 Luria Bertani (LB) Broth Luria Bertani broth was prepared by dissolving 10 g of tryptone, 5 g of yeast extract and 10 g of NaCl in 1 L of distilled water after the pH was adjusted to 7.2 with 1 M Sodium hydroxide, the broth was autoclaved at 121°C and 15 lbs pressure for 20 min. 2.2.6 Luria Bertani Agar Luria Bertani (LB) agar was prepared by dissolving 10 g of tryptone, 5 g of yeast extract, 10 g of NaCl and 2% agar powder in 1 L of distilled water after the pH was adjusted to 7.2 with 1 M Sodium hydroxide, the agar was autoclaved at 121°C and 15 lbs pressure for 20 min. 2.2.7 Methyl Red and Voges Proskauer (MR-VP) Test MR-VP broth was prepared by dissolving 17 g in 1 L of distilled water. The pH was adjusted to 6.9 with 1 M Sodium hydroxide, the agar was autoclaved at 15 lbs pressure for 20 min. On growing the culture in the test medium, the MR test was performed by adding one drop of Methyl red indicator. VP test was done by adding 1 drop of Barritt Reagent A and 1drop of Barritt Reagent B. Development of bright red color after Methyl Red addition indicated positive result; while yellow-orange color indicated
  • 80.
    50 negative results. Developmentof red colour after the addition of Barritt Reagent (A&B) indicated a positive result for VP test. 2.2.8 Motility Test Agar Motility test agar was prepared by dissolving 10 g of tryptone, 5 g of NaCl and 0.6 g of agar in 1 L of distilled water, after the pH was adjusted to 7.2 with 1 M Sodium hydroxide, the agar was autoclaved at 15 lbs pressure for 20 min. Tubes were inoculated by stabbing through center of the medium with inoculating needle to approximately one-half the depth of the medium. Motile bacteria showed diffused growth throughout the entire medium. Non- motile organisms grew only along the line of inoculation. 2.2.9 Nutrient Broth (NB) Nutrient broth was prepared by dissolving 5 g of peptic digest of animal tissue, 1.5 g of beef extract, 1.5 g of yeast extract and 5 g of NaCl in 1 L of distilled water, after the pH was adjusted to 7.3 with 1 M Sodium hydroxide, the broth was autoclaved at 15 lbs pressure for 20 min. 2.2.10 Phenylalanine Deaminase Test Phenylalanine agar was prepared by dissolving 3 g of yeast extract, 5 g of sodium chloride, 2 g DL-Phenylalanine, 1 g disodium phosphate and 15 g of agar in 1 L of distilled water. The pH was set at 7.3 using 1 M sodium hydroxide. The agar was autoclaved at 15 lbs pressure for 20 min. After incubation of the culture in Phenylalanine agar, five drops of 10% ferric chloride and 3 drops of 0.1N HCl were added and were gently shaken. The immediate appearance of an intense green color (1 - 5 minutes) indicates the presence of phenylpyruvic acid, an indicative test for Proteus.
  • 81.
    51 2.2.11 Salmonella Shigella(SS) Agar Salmonella Shigella agar was prepared by dissolving 63.02 g in 1 L of distilled water and the pH was adjusted to 7.0 with 1M Sodium hydroxide. The agar was boiled without overheating and then cooled before use. 2.2.12 Simmons’ Citrate Agar Simmons’ Citrate broth was prepared by dissolving 24 g of Simmons’ Citrate agar in 1 L of distilled water, after the pH was adjusted to 7.0 with 1 M Sodium hydroxide the agar was autoclaved at 15 lbs pressure for 20 min. 2.2.13 Triple Sugar Iron (TSI) Agar Triple sugar iron agar was prepared by suspending 64.62 g in 1 L distilled water, after the pH was adjusted to 7.4 with 1 M Sodium hydroxide the broth was autoclaved at 15 lbs pressure for 20 min. 2.2.14 Tryptone Soya Broth (TSB) Tryptone Soya Broth was prepared by dissolving 30 g of the powder in 1 L of distilled water, pH was adjusted to 7.3 with 1 M Sodium hydroxide and the broth was autoclaved at 15 lbs pressure for 20 min. 2.2.15 Tryptone Broth Tryptone broth was prepared by dissolving 15 g of tryptone in 1 L of distilled water after the pH was adjusted to 7.5 with 1 M Sodium hydroxide and the broth was autoclaved at 15 lbs pressure for 20 min.
  • 82.
    52 2.2.15.1 Indole testmethod On growing the culture in the tryptone broth, 2 drops of Kovac’s reagent was added. 2.2.16 Urea Broth Urea broth was prepared by dissolving 38.7 g in 1 L of distilled water after the pH was adjusted to 6.8 with 1 M Sodium hydroxide. The broth was filter sterilized using 0.2 micron filter (Sartorius stadim- Minisart). 2.3 GENOMIC DNA ISOLATION Genomic DNA was extracted from 1.5 ml (taken in 2 ml centrifuge tubes) of overnight grown cultures of various uropathogens including E. coli, Klebsiella, Psudomonas, Proteus, Staphylococcus, Shigella and Salmonella. The cells were centrifuged at 25 ºC for 10 min at 10,000 rpm. The supernatant was discarded and to the pellet, 500 µl of TNES buffer and 35 µl of Proteinase K was added and mixed by slowly inverting the tubes several times. The tubes were incubated for 10 min in ice followed by incubation at 55 ºC (drybath) for 10 min. Then 150 µl of 6 M NaCl was added and the tubes were vigorously shaken for 20 sec. Following centrifugation at 10,000 rpm for 20 min the supernatant was carefully transferred to fresh tube without any debris. To the supernatant double the volume of cold absolute ethanol was added. Tubes were shaken till a white precipitate was observed. Centrifugation was done for 20 min at 10,000 rpm. The pellet was then washed thrice with 100 µl of 70% ethanol. After each wash centrifugation was done at 10,000 rpm for 10 min. The ethanol was poured off and the pellet was air dried. The air dried pellet was dissolved in 20 µl of 0.5X Tris Borate EDTA (TBE) buffer. Table 2.4 gives the list of primers for various bacterial strains that was used to identify the organism.
  • 83.
    53 Table 2.4 Listof organisms and their 16S rRNA Primer sequence Organism 16S rRNA Primers Forward Reverse E. coli 5’ AGAGTTTGATCCTG GCTCAG 3’ 5’ CTTGTGCGGGC CCCCGTCAATTC 3’ Klebsiella 5’ AGAGTTTGAT CMTGGCTCAG 3’ 5’ TACGGATACCT TGTTACGACTT 3’ Proteus 5′ CGA AGA AGT AAC AGC CAA AG 3′ 5′ ATC CCAACA TCT CTC CCA CT 3′ Pseudomonas 5'-CTACGGGAG GCAGCAGTGG 3' 5’ TCGGTAACG TCAAAACAGCAAAGT 3' Salmonella 5' GGTGGT TTC CGT AAA AGT A 3’ 5' GAA TCG CCT GGT TCT TGC 3' Shigella 5’ AAACTCAAAGG AATTGAC 3’ 5’ GACGGGCGTGTGTACAA 3’ 2.3.1 Agarose Gel Electrophoresis To check for the extracted RNA and conversion to cDNA, agarose gel electrophoresis was employed. 1.5 % of agarose was dissolved in 0.5 X TBE by heating in a microwave oven for 2 minutes. To the molten agarose mix, 0.5 µg/ml of ethidium bromide was added at hand bearable temperature and the contents in the flask were swirled to mix thoroughly. The mix was poured into gel tray fitted with combs. The gel was allowed to solidify for 15 minutes. The gel was submerged in 0.5 X TBE buffer present in the electrophoretic gel tank. The samples mixed with 6 X gel loading dye were loaded into wells; appropriate DNA markers (1 kb or 100 bp ladders) were also loaded into the wells. Electrophoresis was performed at constant voltage of 150 volts till the tracking dye reached the anodic end of the gel. The gel was viewed using gel documentation system (Biorad, USA). The
  • 84.
    54 concentration of theextracted genomic DNA was quantified using Nano Drop 2000/2000c from JH BIO innovations Pvt. Ltd/ Thermo Scientific, India. 2.3.2 Polymerase Chain Reaction (PCR) PCR analysis was carried out using 20 µl reaction mixture containing 12.5 µl of sterile water, 2 µl 10 X buffer, forward and reverse primer each 1 µl containing 5 picomole, 2 µl of 2.5 mM deoxynucleoside triphosphates (dNTPs), template DNA (~40 ng), and 0.2 µl of 5 U Taq DNA polymerase. Thermocycling conditions were as follows: 95 °C for 5 min; 30 cycles of 95 °C for 1 min; 55 °C for 1 min; 72 °C for 1 min and 72 °C for 5 min. The PCR product was purified using the PCR purification kit. 2.4 EXTRACTION OF VOLATILE ORGANIC COMPOUNDS (VOCs) FROM CULTURE Different methods for the extraction of VOC from the culture were attempted in this study. Initially a small bag (Figure 2.1) made of tissue paper was packed with 400 mg of charcoal powder and was placed inside the flask containing the pure compound or the culture. Then, either diethyl ether or n-hexane or dichloromethane or acetonitrile or dimethyl sulphoxide or methanol or ethanol was used to elute the adsorbed compounds from the charcoal. Similarly, silica discs cut to the size of inner dimensions of the cap (Figure 2.2 a) were used to cover the mouth of the vial (1.5 ml) (Figure 2.2 b) and conical flask (250 ml) (Figure 2.2 c) containing either pure compound or culture. After incubation the silica was scrapped off the plates with the solvents mentioned above. The extracts were analysed using Gas chromatogram (GC).
  • 85.
    55 Figure 2.1 Charcoaladsorbant contained in a tissue paper bag was kept hanging above the culture or pure compound containing medium to facilitate adsorption for further analysis (a) (b) (c) Figure 2.2 Silica discs were used as VOC adsorbant as shown in pictures a-c. The adsorbed VOC were eluted using suitable solvent from the the silica disc (a) Silica disc cut to the size of inner dimension of the vial cap (b) Silica disc placed inside of the vial cap (c) Silica disc covering the mouth of the conical flask Secondly, the culture was inoculated in 1.5 ml vials, 15 ml centrifuge tubes and 250 ml conical flasks containing 1.0, 7.0 and 100 ml of LB medium respectively. After 7 h a 2.5 ml syringe containing 200 µl of extraction solvents (acetonitrile or ethanol) was punctured with the needle {(Figure 2.3a) and (Figure 2.3b)} into the headspace of the vial and the headspace was extracted. Another method where one end of the capillary tube was inserted into the conical flask closed with a rubber cork and another end Tissue paper bag containing charcoal
  • 86.
    56 carrying a vialcontaining 1ml of the solvent (Figure 2.3c) was also tried to extract the VOC. The extracted samples were then analysed using GC. (a) (b) (c) Figure 2.3 Simple VOC extraction setup using a syringe, needle and a capillary tube as shown in pictures a-c. The solvent phase which collects the VOC contained in the syringe and vial were analysed using GC-MS (a) shows the VOC collection using a syringe from 1.5 ml vial (b) shows the VOC collection with the syringe set-up from 15 ml centrifuge tube (c) shows the VOC collection using a capillary tube The third method attempted was solvent extraction of the culture. To 1 mL of sterile LB medium contained in 2 mL centrifuge tube, 20 µL (105 cells) of each organism was inoculated separately and incubated in a rotary shaker set at 37 ºC and 170 rpm. Following 7 h of incubation, equal volume of chloroform or dichloromethane (DCM) or ethyl acetate, was added and vortexed for 1 min to extract the VOCs. The solvent phase was collected and analyzed in GC-MS and FT-IR. 2.5 INSTRUMENTAL METHODS FOR VOC IDENTIFICATION To identify the characteristic compound of Proteus the extracted solvent phase was analysed using GC-MS and FT-IR. The specifications of the instrument and other conditions are provided below.
  • 87.
    57 2.5.1 Gas Chromatographic(GC) Analysis The extracts from pure compound and culture were analysed using gas chromatography. The Gas chromatogram and other conditions used are mentioned below. GC (Shimadzu GC-9A, Chromatpak. Spec: Column: Epiezon L; Flame Ionization Detector (FID); Injection port: 150 ºC; Column temperature: 150 ºC; Detector temperature: 200 ºC; carrier gas: Nitrogen). 2.5.2 Gas Chromatography-Mass Spectroscopy (GC-MS) Analysis GC-MS was performed using Shimadzu QP 2010. 2.5.2.1 GC The samples were injected at an injector temperature of 140 °C and separated on Rtx-624 ms (Restek) column (length: 30 m; diameter: 0.32 mm and film thickness: 1.8 µm). Helium (99.9%) was used as the carrier gas at the flow rate of 3.02 mL/min; the oven temperature was 35 °C. Column temperatures were programmed from 35 to 240 ºC. 2.5.2.2 MS The samples were scanned at the range 35-400 m/z between 1.5 min to 24 min with electron ionization detector set at ionization EI of -70 eV. The ion source temperature was 200 ºC with the interface temperature of 240 ºC. The event time and solvent cut time was 0.5 sec and 5 min respectively.
  • 88.
    58 2.5.3 Fourier Transform-Infrared(FT-IR) Analysis FT-IR method of analysis is sensitive, rapid and an inexpensive form of analysis of compounds of biological importance requiring a small amount of sample. To get an estimate of the molecular components in the extract the FT-IR analysis was performed. It identifies specific chemical functional groups within compounds. The FT-IR vibrational spectra of the solvent extracts were read using a IR Prestige model FT-IR spectrometer (Make: Shimadzu, Japan). IR spectrum was recorded by placing the infrared cell containing the solvent (DCM) extracted sample in the IR path. The spectrum was scanned from 400 to 4000 cm-1 with a resolution of 4 cm-1 . The presence of the functional groups was identified by the different positions of absorption peaks in the FT-IR spectrum due to the vibration of specific functional group corresponding to the different modes of vibration. 2.5.4 Comparative Analysis of Pure Compound and the Characteristic VOC from Proteus using Gas Chromatography Further to confirm that the characteristic VOC from Proteus was 2-methylbutanal the pure compound and the extract was analysed using GC (details have been mentioned earlier). The culture extract and standard 2-methylbutanal was taken in DCM. After analysis the chromatogram of both the samples were matched. 2.6 DEVELOPMENT OF SURVEILLANCE METHOD FOR IDENTIFICATION OF CHARACTERISTIC VOC Though, the GC-MS analysis of the extracts revealed the presence of the characteristic compound of Proteus, the colorimetric and fluorimetric assays were carried out using common volatile organic aldehydes and ketones. Since a number of carbonyl compounds are produced by different
  • 89.
    59 organisms in variousgrowth medium and also the indicators and dyes used in this study are generic to all carbonyl compounds, the assay was standardized with other carbonyls. Thus, such assays can be applied to other organisms grown in defined growth conditions. 2.6.1 Colorimetric Assay for Carbonyl Volatile Organic Compounds Colorimetric assay for identification of carbonyl VOC was developed using 2,4 DNPH reagent. The preparation of the reagent and the assay method are as follows: Preparation of reagent: 2,4 DNPH reagent was prepared by dissolving 0.2 g of 2,4 DNPH powder in 100 ml 2 N Hydrochloric acid. The solution was heated for 1 h and left overnight for the undissolved particles to settle. Then the solution was filtered using a crude filter paper. To the filtrate 100 ml of absolute ethanol was added and used for spotting. Assay method: Methodologies were developed for identifying carbonyl compound by simulating experimental conditions using commercially available pure compounds. Silica coated discs were used to adsorb in the inner side of the lids of air-tight vials and appropriate carbonyl specific colouring reagent, 2,4, Dinitrophenyl hydrazine (Yuguang et al 2007) were used to reveal the adsorbed molecules. However, due to its limited sensitivity an alternative fluorescent dye DNSH was chosen. 2.6.2 Fluorescent Dye Reagent Specific for Carbonyl Compounds Fluorimetric assay for identification of carbonyl VOC was developed using Dansyl hydrazine (DNSH) reagent. The preparation of the reagent and the assay method are as follows:
  • 90.
    60 Reagent preparation: Fluorogenicreagents for the derivatization of carbonyl compounds are in routine practice for sensitive and selective detection. Owing to its sensitivity the fluorimetric dye, 5-dimethylaminonaphthalene- 1-sulphonyl hydrazine (DNSH) (Jason et al 2005, Schmied et al 1989) was chosen for the study. The dye solution was prepared by dissolving 0.02 g of the dye powder in 1 mL of HPLC grade acetonitrile to give a final concentration of 75.3 mM. Assay method: Initially, VOC adsorbed silica disc was spotted using DNSH reagent, however, due to the lack of dye stability the assay was standardized in liquid medium. Similarly, the sensitivity of the dye was not adequate for detecting lower concentrations of VOC from bacteria. Hence, when the dye solution (75.3 mM) was added to the sample followed by glacial acetic acid (for acid catalysis), the fluorescence yield increased 2 times and the conversion of orange to green fluorescence could be visualized in UV transilluminator. For testing the reagent 200 µL sample in 96-well plate was mixed with 5 µL of dye reagent followed by 2.5 µL of glacial acetic acid. 2.7 STANDARDIZATION OF DNSH ASSAY FOR CARBONYL COMPOUNDS To standardize the DNSH assay, 16 pure compounds, carbonyl as well as non-carbonyl, (2-methybutanal, benzaldehyde, hexanal, decanal, 2-heptanone, 2-nonanone, 2-tridecanone, 2-pentanone, acetophenone, propanol, ethanol, methanol and butanol, propionic acid, phosphoric acid and butyric acid) were reacted with the dye and the resultant fluorescence was scanned for excitation at 300-400 nm. Subsequently the samples were excited at the fixed maximum excitation wavelength for carbonyl compounds, and scanned at 500-600 nm for respective emission maximum. Thus excitation was fixed at 336 nm and emission was fixed at 531 nm. For detecting carbonyl compounds from culture, DNSH assay was performed with bacterial
  • 91.
    61 strains after 7h of growth and the fluorescence was read in a fluorimeter set at the above excitation and emission wavelengths (Ex/Em). The fluorescence was measured using a fluorimeter, (Model: Enspire, Perkin Elmer, USA) and the same was imaged using a UV transilluminator for visualization. 2.8 FLUORESCENCE BASED DNSH ASSAY (PROTEAL) FOR DETECTION OF PROTEUS SPECIES The DNSH assay for detecting the aldehyde released by Proteus species was performed in a 96-well plate. Each well was filled with 180 µL of LB medium and 20 µL of 105 cells of the test strains were inoculated. The plate was incubated at 37 °C and 100 rpm for 7 h in an orbital shaker. The optical densities (600 nm) of bacterial cultures were measured after 7 h using Multiscan reader (Thermo, Finland) and then the DNSH assay was performed by adding 5.0 µL of the dye solution and 2.5 µL of glacial acetic acid. The fluorescence was measured after 5 min using the fluorimeter and the plates were also imaged. The assay is referred to as ProteAl (Prote, “Proteus” & Al, “Aldehyde”). To check for the specificity of the growth medium in VOC production Proteus was grown in various media like LB, NB, AB and TSB and ProteAl was performed. To profile VOC release with respect to time, the assay was performed every one hour of bacterial growth. ProteAl assay was performed with various concentrations of 2-methylbutanal; and a standard graph was generated using the fluorescence data obtained for each concentration. A quantitative estimation of the VOC in the culture at different time point (from 4th hour) was obtained using the standard graph.
  • 92.
    62 2.9 TESTING THEVOLATILITY OF 2-METHYLBUTANAL FROM CULTURE In order to confirm that the fluorescence produced is only due to the VOC and to check the interference of the cells with the assay, 2 sets of positive (Proteus) and negatives were grown in similar conditions where, one set was centrifuged, supernatant was removed and assayed. And in the other set, cells were washed twice with 0.9 % saline to remove the medium components and then assayed. To check whether the target of the assay is a volatile carbonyl compound released by Proteus, each well was filled with 180 µL of LB medium and 20 µL of 105 cells were inoculated. The assay plate was incubated open at different temperatures: at room temperature (≈ 27 °C), in refrigerator (≈ 4 °C) and on ice and the assay was performed after 1 and 2 h. 2.10 LABORATORY VALIDATION OF THE PROTEAL ASSAY Initially the optimized assay conditions were tested on a few standard strains of Proteus and a few other common bacteria subsequently 39 standard and 56 known clinical strains representing frequently encountered uropathogens including {27 Proteus (both mirabilis and vulgaris), 27 E.coli, 8 Klebsiella, 10 Staphylococcus, 7 Pseudomonas}, 2 Enterobacter, 2 Citrobacter, 7 Salmonella, 4 Shigella and 1 Listeria were tested in duplicate for validation. For validating the method using environmental samples approximately 200 soil strains were collected from three different areas located close to the laboratory as listed in the Table 2.5.
  • 93.
    63 Table 2.5 Listof environmental sample collection locations Location Type of waste dumped Madipakkam, Chennai Hospital waste Pallikaranai, Chennai Domestic waste Taramani, Chennai Laboratory waste Around 10 g of soil samples were collected from each location by digging the ground approximately 6 inches below the surface. From this 1 g of the soil was dissolved in 10 ml of sterile distilled water and was serially diluted to ~105 cells and plated onto LB agar plates. Morphologically different colonies were isolated and common microbiological and biochemical tests were performed followed by screening with ProteAl assay. 2.11 SENSITIVITY AND SPECIFICITY CALCULATION Sensitivity and specificity of the assay was calculated using the formula, Sensitivity = [a/ (a+c)] ×100 and Specificity = [d/ (b+d)] ×100 Table 2.6 Table for sensitivity and specificity calculation True positive (a) False positive (b) False negative (c) True negative (d) When the growth (OD) of the strains where similar, the 99 % confidence for the positive (Proteus) and negatives were calculated using the formula.
  • 94.
    64 X± 2.58 (δ/√n) WhereX is sample mean; δ, population standard deviation and n, sample size (Jose 2009). 2.12 IDENTIFICATION OF THE METABOLIC PATHWAY USING BIOLOGICAL DATABASES A detailed literature search was done to understand the pathways that are involved in the production of 2-methylbutanal. A number of pathways have been identified using bioinformatics databases like KEGG, MetaCyc and BioCyc in different organisms that produce 2-methylbutanal, mainly as end product of isoleucine catabolism. Though, there are no reports on such a pathway in Proteus species, the enzymes involved in the pathway in other bacteria including Lactococcus lactis (Pilar et al 2004) were identified and the sequence of the enzymes involved in isoleucine degradation pathway (branched chain aminotransferase and alpha-ketoacid decarboxylase) were blasted against Proteus genome using NCBI BLAST with all non-redundtant databases. Based on the nucleic acid sequence alignment, the primers at the 5’ end of sense and non-sense sequences were designed to amplify the Open reading frame (ORF) corresponding to alpha-ketoacid decarboxylase (kdcA). 2.13 RATIONAL DESIGN OF GROWTH MEDIUM FOR ENHANCED 2-METHYLBUTANAL PRODUCTION In order to enhance the production of 2-methylbutanal a rational medium was designed by supplementing the growth medium with isoleucine and thiamine pyrophosphate. The optimized medium composition is mentioned below.
  • 95.
    65 2.13.1 Study onthe Effect of Branched Chain Amino Acids on 2-methylbutanal Production Initially various concentrations (8, 15, 23, 31, 38 and 76 mM) of Isoleucine (Ile) was supplemented in LB medium and checked for 2- methylbutanal levels by the fluorescence method (method described earlier). The LB-Ile broth was prepared by dissolving 10 g of tryptone, 5 g of yeast extract, 10 g of NaCl and 2 g of isoleucine in 1 L of distilled water; after the pH was adjusted to 7.2 with 1 M Sodium hydroxide and autoclaved at 15 lbs pressure for 20 min. Similarly various concentrations of Leucine (Leu) and Valine (Val) was also supplemented in the LB medium and checked if it had an effect on 2-methylbutanal enhancement. 2.13.2 Study on the Effect of TPP for 2-methylbutanal Production After the standardization of optimum concentration of isoleucine for enhanced VOC production, LB-Ile broth was supplemented with various concentrations (0.5, 1.0, 1.5, 2.0, 2.5 mM) of Thiamine pyrophosphate (TPP) since it acts as a cofactor for alpha-ketoacid decarboxylase enzyme (Max et al 1998). The optimal concentration of TPP was found out using ProteAl assay. The effect of LB with Ile and TPP and the combined effect of Ile and TPP in LB were studied by growing Proteus strains in the doubly supplemented medium and assaying them for 2-methylbutanal release. The medium in which there was maximum enhancement of fluorescence was used further for studying the gene regulation.
  • 96.
    66 2.14 REGULATION OFTHE METABOLIC PATHWAY INVOLVED IN 2-METHYLBUTANAL PRODUCTION To study the regulation of the metabolic pathway and to understand the influence of isoleucine and TPP at gene level the total RNA was extracted and reverse transcribed to cDNA. The cDNA was further used as a template for gene expression quantification using real-time PCR. The protocol for extraction, conversion and quantification are briefed below. 2.14.1 Extraction of Total RNA from Proteus Culture Total RNA was extracted from Proteus culture grown for 7 h in different growth medium including LB, LB-Ile and LB-Ile-TPP. 2 ml of culture were taken in 2 ml centrifuge tube and centrifuged at 10,000 rpm for 10 min at 10 ºC (Eppendorf cooling centrifuge 5804 R). The pellet was re-suspended in 100 µl of Tris EDTA solution and 100 µl of 2% Sodium dodecyl sulphate (SDS) was added and mixed well to disrupt the cells and release the contents. 1ml of phenol was added and incubated at room temperature for 5 min. Chloroform (200 µl) was added to the mixture and the solution was mixed gently for a few seconds. The tubes were centrifuged at 10,000 rpm for 10 min at 10ºC. The aqueous phase (~300 µl) was carefully aspirated and transferred to fresh tubes. To the aqueous extract 30 µl of 3M Sodium acetate and 1.5 ml of 100% ethanol were added and incubated in -20 ºC freezer for 30 min to precipitate nucleic acid. The tubes were centrifuged at 10,000 rpm for 10 min at 10 ºC to collect the pellet, which was then washed twice by suspending it in 70% ethanol and then centrifuging at 10,000 rpm for 10 min at 10 ºC. Pellet was dissolved in 40 µl of nuclease-free water and digested with 1U of DNase to remove DNA. The extracted RNA was confirmed by agarose gel electrophoresis.
  • 97.
    67 2.14.2 Conversion ofRNA to cDNA The total RNA was reverse transcribed into cDNA using a high- capacity cDNA reverse transcription kit with RNase inhibitor and random hexamers. Each reaction mixture (20 µl) contained 5.2 µl of sterile water, 2 µl of 10X buffer, 0.8 µl of 2.5 mM deoxynucleoside triphosphates (dNTPs), 2 µl of random hexamers, 1 µl of RNase inhibitor, 1 µl reverse transcriptase and 8 µl of template (RNA). Thermocycling conditions were as follows: 25°C for 10 min, 37°C for 2 h, 85°C for 5 min and hold at 4 ºC for 5 minutes. 2.14.3 Quantification of Gene Expression using Real-time PCR (qPCR) In a 0.1 ml PCR tube (Applied Biosystems), a qPCR reaction in 10 μl of total volume was set up as follows: 5 μl 1X PCR master mix (Kapa), 1 μl (5 picomole) each of forward and reverse PCR primer, 0.5 μl of high ROX Reference Dye (25 μM), 1 μl (~12 ng) of diluted cDNA Template and 0.5 μl of Diethylpyrocarbonate (DEPC)-treated sterile water.The primers used for qPCR analysis are tabulated in Table 2.7. The thermal cycling program of ABI StepOne (Applied Biosystems PCR machine) was: Holding stage: 95 °C for 20 sec, Cycling stage: 95 °C for 3 sec, Annealing 55 °C for 30 sec for 40 cycles and Melt curve stage 95 °C for 15 sec, 60 °C for 1 min, 95 °C for 15 sec.
  • 98.
    68 Table 2.7 Listof genes and their primer sequences Gene Primers Product sizeForward Reverse Alpha- ketoacid decarboxylase (gene responsible for the conversion of an acid to aldehyde) GTTGGCGCGCCTT CTCAGTCA CATCACACCGACAT CCTCTGGT ~225 bp DNA-directed RNA polymerase subunit alpha (rpo A) (Housekeeping gene) GCGTGTTATAGCC CAGTTGA AGGCTGACGAACAT CACGT ~200 bp
  • 99.
    69 CHAPTER 3 RESULTS VOC baseddetection, which has the distinct advantage of being non-invasive and suitable for surveillance over existing techniques, is yet to emerge as a diagnostic approach in bacterial identification. Highly sensitive fluorescence based chemical methods are now becoming popular in a variety of analytical applications. Hence, such a fluorescence method has been developed in this study to detect the carbonyl compound, 2-methylbutanal from the cultures of Proteus. The results on identification of 2-methylbutanal as characteristic carbonyl compound under defined growth conditions, standardization of the assay, ProteAl, its laboratory validation and media development for enhanced production of the VOC are given below. 3.1 A NON-DESTRUCTIVE APPROACH FOR PATHOGEN DETECTION USING VOLATILE ORGANIC COMPOUNDS Prevention by effective surveillance and high throughput screening are essential in the control of infectious diseases. Non-invasive diagnosis is the future trend to obviate the unpleasant, painful and even dangerous invasive practices (prone to secondary complications) in vogue. Modern diagnosis of diseases also prefers a non-destructive approach employing minimal sample handling for obvious advantages. In this regard, detection of characteristic VOC has the distinct advantage of even remote monitoring of pathogens in environment for preventive surveillance; monitoring of pathological processes and assessment of pharmacological responses are also
  • 100.
    70 possible. Sensitive fluorescence-baseddetection methods are emerging as the present trend in a variety of analytical applications. Therefore, fluorescence detection of VOC has great promise in pathogen detection and surveillance. Such a method has been developed in this study to detect the carbonyl compound, 2-methylbutanal, characteristic VOC of Proteus in the culture. 3.1.1 VOC Biomarkers Found in Various Uropathogens A variety of VOCs are produced by a bacterial pathogen. The characteristic one has to be identified by a comparative analysis among other pathogens that can also cause the disease under the same or similar condition. Since we were interested in Proteus associated with UTI, cheminformatic analysis of VOCs produced by all common uropathogens was performed and the results are tabulated in Table 3.1. From the information obtained, it is evident that the compounds emitted by uropathogens belonged to a great variety that includes aldehydes, ketones, alcohols, acids, sulphur or nitrogen compounds, esters and cyclic compounds. However, the actual VOC produced is dependent on the organisms and the type of medium and growth conditions (see the growth medium column in the Table 3.1). In the case of Proteus we chose to look for characteristic aldehyde or ketone (owing to the availability of highly sensitive, easy-to-perform colorimetric and fluorescence methods; their reactivity and their volatility) while culturing the organism in the popular Luria Bertani broth.
  • 101.
    71 Table 3.1 ReportedVolatile Organic Compounds released by various bacteria in different growth medium S. No Organism Acids Alcohols Aldehydes Cyclic compounds Esters Hydro- carbons Ketones Nitrogen containing Sulfur containing Growth medium References 1. Bacillus cereus Benzenecar- boxylic acid, Crotonic acid, Propionic acid n-butyl alcohol, n-propanol Nonanal Acetoin Dimethyl disulphide Luria Broth (Horsman & Crouse 2008) 2. Enterobacter 1-decanol, 1- dodecanol,1- octanol Trypti- case soy broth (Elgaali & Hamilton et al 2002) 3. Citrobacter 1-decanol, 1- dodecanol,1- octanol Trypti- case soy broth (Elgaali & Hamilton et al 2002) 4. Clostridium difficile Ethanoic acid 1-butanol, 2-methyl-1- propanol, 3-methyl-1- butanol, 2-propanol, phenylethyl alcohol Benzaldehyde, ethanal, hexanal, 2- methylbutanal, 3- methylbutanal, 2-methyl propanal Acetone,2-butanone, 2,3-butanedione, 2-heptanone, 3-hydroxy-2- butanone, 2-pentanone, 2,3- pentane-dione Infected stool samples (Garner & Smith et al 2007) 5. Entero- coccus faecalis Formaldehyde, 2-methylbutanal Ethyl butanoate, n-propyl acetate Acetone, butanone, 2-pentanone Ammonia Dimethyl disulphide, dimethyl sulphide, hydrogen sulphide, methyl mercaptan Urine (Storer et al 2011)
  • 102.
    72 Table 3.1 (Continued) S. No OrganismAcids Alcohols Aldehydes Cyclic compounds Esters Hydro- carbons Ketones Nitrogen containing Sulfur containing Growth medium References 6. Escheri- chia coli 3-methyl-1- butanol,2- (methylthio) -ethanol Methyl benzoate 1-methyl- naphtha- lene, 2-methyl- naphtha- lene 2-decanone, 2-nonanone, 2-octanone, 2-undecanone Benzonitrile Dimethyl disulfide Brain hearth infusion medium (Melanie et al 2012) 1-propanol Methylcyclo- hexane Methyl propanoate Dimethyl disulfide, dimethyl trisulfide LB broth (Brandon et al 2013) Ethanol, 1- decanol, 1- dodecanol, octonol, 1- propanol Acetonitrile Dimethyl sulphide Tryptic soy broth (Arnold & Senter 1998, Jiangjiang et al 2010) Acetic acid, butanoic acid, phenylacetic acid 1-butanol, Ethanol, 1-pentanol Formalde- hyde Pyrrole Ethyl acetate, ethylbuta- noate Acetone , Acetoin, 2-aminoaceto -phenone Trimethylamine Dimethyl disulfide, Hydrogen sulphide, Methyl mercaptan Tryptone yeast extract broth (TYE) (Thorn et al 2011) Acetic acid Ethanol methanol Formalde- hyde Ethyl acetate, ethylbutano- ate, n-propyl acetate Acetone, 2-aminoacto- phenone Trimethylamine Dimethyl disulphide, dimethyl sulphide, hydrogen sulphide, methyl mercaptan Urine (Storer et al 2011)
  • 103.
    73 Table 3.1 (Continued) S. No OrganismAcids Alcohols Aldehydes Cyclic compounds Esters Hydro- carbons Ketones Nitrogen containing Sulfur containing Growth medium References 7. Klebsiella pnuemoniae 3-methyl-1- butanol, 2- (methylthio) -ethanol 3-methyl- butanal 1-undecene 2-nonanone Brain hearth infusion medium (Melanie et al 2012) 1-butanol, ethanol, 1-pentanol Formalde- hyde 2-amino acetophe none Ammonia, trimethylamine Hydrogen sulphide, methyl mercaptan Tryptone yeast extract broth (TYE) (Thorn et al 2011) Ethanol Formalde- hyde Ammonia, trimethylamine Dimethyl disulphide, dimethyl sulphide, hydrogen sulphide, methyl mercaptan Urine (Storer et al 2011) 8. Proteus mirabilis 2- (methylthio) -ethanol , phenethyl alcohol 2-acetylthi- azole Isoamyl benzoate, 3- methylbutyl 2- methylpropano ate, S-methyl thiobenzoate, 2-phenyl ethyl acetate 2,3-heptane- dione, 2- nonanone, 2- undeca-none N-n- butylphthalimide, N-(1,1- dimethylethyl)- benzamide, 3- methyl-N-(3- methylbutylidene)- 1-butanamine, 3-methyl-N-(2- phenylethylidene)- 1-butanamine Dimethyl Disulfide, dimethyl trisulfide, 2,3- heptanedione Brain heart infusion medium (Melanie et al 2012)
  • 104.
    74 Table 3.1 (Continued) S. No OrganismAcids Alcohols Aldehydes Cyclic compounds Esters Hydro carbons Ketones Nitrogen containing Sulfur containing Growth medium References Butanoic acid, phenyl- acetic acid 1-butanol, ethanol, 1-pentanol Formalde- hyde, 2-methyl- butanal Pyrrole Ethyl acetate, ethyl butanoate Acetoin, 2- aminoacetophenone Trimethylamine Dimethyl disulfide, hydrogen sulphide, methyl mercaptan Tryptone yeast extract broth (TYE) (Thorn et al 2011) 9. Proteus vulgaris Acetalde- hyde, formalde- hyde n-propyl acetate Acetone, Aminoaceto- phenone Ammonia, trimethyl amine Dimethyl sulphide, dimethyl disulphide, hydrogen sulphide, methyl mercaptan Urine (Storer et al 2011) 10. Pseudomonas aeruginosa 3-methyl-1- butanol 3-methyl butanal 1-undecene 2-nonanone Dimethyl disulfide Brain hearth infusion medium (Melanie et al 2012) Acetic acid Ethanol 10-methyl- 1-undecene Acetone, 2-aminoaceto- phenone, 2-pentanone Acetonitrile Tryptic soy broth (Jiangjiang et al 2010, Wojciech et al 2012) 1-butanol ethanol, 1-pentanol Formalde- hyde 2-aminoaceto- phenone Ammonia, trimethylamine Hydrogen sulphide, methyl mercaptan Tryptone yeast extract broth (TYE) (Thorn et al 2011) Ethanol Formalde- hyde Methyl mercaptan Urine (Storer et al 2011)
  • 105.
    75 Table 3.1 (Continued) S. No OrganismAcids Alcohols Aldehydes Cyclic compounds Esters Hydrocarb ons Ketones Nitrogen containing Sulfur containing Growth medium References 11. S. typhimurium Acetic acid Butanol , ethanol, isopentanol, 4-methylphenol Pyrimidine Acetone, 2-nonanone, 2-pentanone Acetonitrile Tryptic soy broth (Jiangjiang et al 2010) 12. Staphylococcus aureus 3-methyl-1- butanol, 2- (methylthio)- ethanol 3-methyl- butanal Brain hearth infusion medium (Melanie et al 2012) Acetic acid, isovaleric acid Butanol, ethanol, isopentanol, 4-methylphenol 2- methyl-1- propanol, 3- methyl-1- butanol Acetaldehyde , (Z)-2-methyl- 2-butanal, 3-methyl- butanal, 2- methyl- propanal Pyrimi-dine 1,3-butadien, n-butane, 2-butene 2- methylpropene propane Methyl methacry- late Acetone, 2-nonanone, 2-pentanone Acetonitrile Dimethyl disulfide, methanethiol Tryptic soy broth ( Wojciech et al 2012, Lieuwe et al 2013) Formaldehyde, 2-methyl- butanal Ammonia, trimethyl- amine Methyl mercaptan Urine (Storer et al 2011)
  • 106.
    76 Table 3.1 (Continued) S. No OrganismAcids Alcohols Aldehydes Cyclic compounds Esters Hydrocarb ons Ketones Nitrogen containing Sulfur containing Growth medium References 13. Xantho- monas campestris Benzylalcohol, 2-phenylethanol, 8-methylnonan- 2-ol, 7-methylnonan- 2-ol, undecan- 2-ol, 10-methylundecan- 2-ol, 9-methyundecan- 2-ol, tridecan-2-ol, 12-methyltridecan- 2-ol, 11-methyltridecan- 2-ol, tetradecan-2-ol n-octane hexan-2-one, 5-methylhexan-2-one, heptan-2-one, n-nonane, 6-methylheptan-2-one, 5-methylheptan-2-one, octan-2-one, acetophenone, 7-methyloctan-2- one, nonan-2-one, 8-methylnonan-2-one, 7- methylnonan-2-one, decan-2-one, 9-methyldecan-2-one, undecan- 2-one, 10-methylundecan-2-one, 9- methylundecan-2-one, dodecan-2-one, geranylacetone, 11-methyldodecan-2-one, tridecan-2-one, 12-methyltridecan-2-one, 11- methyltridecan-2-one, 13-methyltetradecan-2-one, pentadecen-2-one, pentadecan- 2-one, 14-methylpentadecan-2- one, 13-methylpentadecan-2- one Nutrient broth without glucose (Weise et al 2012)
  • 107.
    77 3.1.2 Microbiological, Biochemicaland Molecular Techniques Identfies the Uropathogens The standard, clinical and environmental strains were reconfirmed by known microbiological, biochemical and molecular techniques as shown in Table 3.2. Table 3.2 Results of the tests performed for a few uropathogens S. No E. coli Klebsiella Proteus Pseudomonas Salmonella Shigella Staphylococcus 1. Catalase positive (+) Catalase positive (+) Catalase positive (+) Catalase positive (+) Catalase positive (+) Catalase positive (+) Catalase positive (+) 2. --- --- --- Cetrimide Agar- positive (+) --- --- --- 3. Eosin Methylene Blue- Metallic green sheen --- Eosin Methylene Blue – Pink colonies --- --- --- --- 4. Indole positive (+) Indole negative (-) Indole negative (-) Indole negative (-) Indole negative (-) Indole negative (-) Indole negative (-) 5. Urease negative (-)Urease positive (+) Urease positive (+) Urease negative (-) Urease negative (-) Urease negative (-) Urease negative (-) 6. Methyl red positive (+) Voges-Proskauer- negative (-) Methyl red– negative (-) Voges-Proskauer- positive (+) Methyl red– positive (+) Voges-Proskauer- negative (-) Methyl red– negative (-) Voges-Proskauer- negative (-) Methyl red– positive (+) Voges-Proskauer- negative (-) Methyl red– positive (+) Voges-Proskauer- negative (-) Methyl red– negative (-) Voges-Proskauer- positive (+) 7. Motile Non-motile Motile Motile Motile Non-motile Non-motile
  • 108.
    78 Table 3.2 (Continued) S.No E. coli Klebsiella Proteus Pseudomonas Salmonella Shigella Staphylococcus 8. Salmonella Shigella Agar- colourless colonies --- Salmonella Shigella Agar- colourless colonies --- Salmonella Shigella Agar- Colourless colonies with black centre Salmonella Shigella Agar- Pink Colonies --- 9. --- Simmons’ Citrate Agar Butt-Green Slant-Blue Phenylalanine Deaminase positive (+) --- Simmons’ Citrate Agar Butt-Green Slant-Blue Simmons’ Citrate Agar Butt-Green Slant-green Mannitol salt agar- positive (+) 10. Triple Sugar Iron Butt-yellow Slant-yellow Triple Sugar Iron Butt-yellow Slant-yellow Triple Sugar Iron Butt-yellowish green Slant-yellow Triple Sugar Iron Butt-Red Slant-Red Triple Sugar Iron Butt-yellow Slant-Red Triple Sugar Iron Butt-yellow Slant-red Triple Sugar Iron Butt-yellow Slant-yellow 11. 16SrRNA - √ 16SrRNA - √ 16SrRNA - √ 16SrRNA - √ 16SrRNA - √ 16SrRNA - √ 16SrRNA - --- 12. Strain confirmed Strain confirmed Strain confirmed Strain confirmed Strain confirmed Strain confirmed Strain confirmed Catalase Positive (+): Bubble Formation, Negative (-): No bubble formation. Indole Positive (+): Red Colour, Negative (-): No Colour change. TSI Positive (+): Black Butt (H2S production) and Pink Slant, Negative (-): Yellow or no change in Butt/Slant colour. MR Positive (+): Red colour, Negative (-): No Colour change. VP Positive (+): Copper colour, Negative (-): Red colour/No colour change.
  • 109.
    79 3.2 SOLVENT EXTRACTIONWAS THE SUITABLE METHOD FOR VOC EXTRACTION FROM CULTURE Carbonyl compounds like 3-methylbutanal, 2-methylbutanal, formaldehyde and acetaldehyde are the known volatile compounds produced by Proteus (see Table 3.1). Since it was not known which of these carbonyl compound(s) is produced under the conditions used in this study, the head space of the culture was targeted for isolation and identification of the compound(s). To capture the VOCs from the headspace, based on the literature reports, activated charcoal powder was first chosen as a suitable adsorbent. However, even when exposed upto 250 mL of culture, the adsorbed compound(s) could not be eluted in spite of using different solvents like diethyl ether, n-hexane, dichloromethane, acetonitrile, dimethyl sulphoxide, methanol and ethanol. Simulation using pure aldehyde compounds showed that such adsorption and desorption was effective only in millimolar concentrations; at lower concentrations the efficiency of adsorption was reduced to a greater extent. The same was the case when an alternative adsorbent, silica was used. Hence, different approaches for trapping of the compound(s) either from the head space or the spent medium was experimented. When the culture headspace from closed vials or centrifuge tubes or rubber corked conical flasks was sparged through the solvents using a syringe or allowed to flow through and then analyzed by GC, no characteristic chromatogram, especially pertaining to the known aldehyde compounds of Proteus, could be obtained. However, when the same set-up was tested using pure compounds detection at millimolar concentrations was possible.
  • 110.
    80 The failure tocapture the released VOCs from bacteria was attributed to the low abundance in ppm or ppb levels as well as to the poor efficiency of the systems used. Hence direct extraction of VOCs from the culture (present in equilibrium with the vapour phase) into solvents compatible with gas chromatography and mass spectroscopy (MS) analysis was attempted. Out of the solvents tested, DCM was found to be best suitable for extracting the VOCs from bacterial culture. The GC, GC-MS analyses of the solvent phase showed the presence of various compounds including aldehydes of Proteus. 3.3 GAS CHROMATOGRAM IDENTIFIED THE CHARACTERISTIC COMPOUNDS OF PROTEUS AND SALMONELLA CULTURE EXTRACT The gas chromatograms for medium blank, positive and negative samples revealed the presence of characteristic compounds of Proteus. From the gas chromatograms (Figure 3.1), a small but distinct peak at 8.227 min could be observed for Proteus, which was not seen in the medium as well as the negative sample, i.e Salmonella enterica subspecies. The identity of the compounds separated in GC, as obtained from the GC-library is shown in Table 3.3. The characteristic peak found at Rt 8.227 min in Proteus sample was identified as 2-methylbutanal. It was resolved at an average concentration of 330 ppb, indicating that it was either not an abundant VOC or it is highly volatile.
  • 111.
    81 Table 3.3 ComparativeVOC profiles of Proteus with medium and negative control Blank (LB medium) Proteus Salmonella Rt (min) Compound Rt (min) Compound Rt (min) Compound 7.779 Ethene, 1,2- dichloro- 7.791 Ethene, 1,2- dichloro- 7.795 Ethene, 1,2- dichloro- Nil - 8.227 Butanal, 2-Methyl- Nil - 10.645 Carbon tetrachloride 10.653 Carbon tetrachloride 10.652 Carbon tetrachloride 11.457 Pentane, 3- Ethyl- Nil - 11.456 Pentane, 3- Ethyl- Nil - 14.762 Benzene, Methyl 14.765 Benzene, Methyl Nil - Nil - 17.308 Ethyl benzene Nil - 18.485 Benzene, (1- Methylethyl) 18.488 Benzene, (1- Methylethyl) 20.639 Benzene, 1,4- dichloro 20.640 Benzene, 1,4- dichloro 20.645 Benzene, 1,4- dichloro Nil - Nil - 23.364 Naphthalene Medium Blank Proteus Figure 3.1 (Continued)
  • 112.
    82 Salmonella Figure 3.1 Thegas chromatogram of Dichloromethane extracts of LB (media control), Proteus (positive sample) and Salmonella (negative control) cultures. The unique peak for Proteus culture at 8.227 min is denoted by an arrow 3.3.1 Identification of 2-methylbutanal as Specific VOC for Proteus using GC-MS and FT-IR The volatile compounds extracted into DCM were directly subjected to GC-MS analysis. Figure 3.2 (a) shows the gas chromatogram of the DCM-extract of Proteus having 3 peaks at 1.57, 1.78 and 2.92 min. The mass spectrum at each Rt showed that the fraction at 1.78 min was from a compound with a molecular mass ion of 86 (shown in Figure 3.2 (b)). Matching retention indices and fragmentation pattern with the spectral library indicated that the compound could be 2-methylbutanal. Its low abundance, however, pointed out that the detection limit of the fluorescence assay to be developed should be in ppb level. Previously, it has been reported that 2- methylbutanal is one of the VOCs released by Proteus when grown in similar complex medium (Thorn et al 2011).
  • 113.
    83 Figure 3.2 GCanalysis of DCM extract from Proteus culture and the mass spectrum of the sample at retention time 1.78 min (a) shows the gas chromatograms of volatile organic compounds in the DCM extracts of Proteus. The characteristic peak at 1.78 min in Proteus was further analyzed for identification of mass (b) is the mass spectrum of the unique compound for Proteus at Rt 1.78 min in GC. The fragment peak at 57 m/z is the base peak showing 100% abundance and corresponding to 2-methylbutanal. No other carbonyl compound was detected from the other peaks The FT-IR spectra of 2-methylbutanal, DCM extracts of LB, Proteus vulgaris and Proteus mirabilis after eliminating DCM peaks are
  • 114.
    84 shown in Figure3.3. In the spectra of 2-methylbutanal, the peak at 1723 cm−1 is characteristic to strong C=O stretching representing the presence of carbonyl group. The two peaks at 2684 and 2829 cm−1 are attributed to the medium intensity =C-H stretching indicating an aldehyde. The absorption peaks at 1421 and 2976 cm−1 are representing a variable C-H bending and a strong C-H stretching respectively, which corresponds to alkane. The other peaks in the spectrum corresponded with those of the blank indicating the organic compounds released from the medium. The spectra of Proteus vulgaris and Proteus mirabilis also showed peaks at 1721 and 1725 cm−1 for C=O stretching. The absorption peaks corresponding to =C-H stretching (2686 and 2827 cm−1 for Proteus vulgaris; 2686 and 2830 cm−1 for Proteus mirabilis) indicated an aldehyde. Similarly, the absorption peaks representing a variable C-H bending (1423 cm−1 for P. vulgaris and 1427 cm−1 for P. mirabilis) and a strong C-H stretching (2985 cm−1 for P. vulgaris and 2986 cm−1 for P. mirabilis) corresponding to alkanes were observed. This comparative analysis of pure 2-methylbutanal with the DCM-extract of Proteus confirmed the presence of an aldehyde under the described conditions. The Proteus samples showed the presence of carbonyl group along with the =C-H stretch corresponding to an aldehyde which is similar to the standard 2- methylbutanal. Together, the analysis was suggestive of the presence of 2- methylbutanal as the volatile organic compound in low abundance in the cultures of Proteus grown in LB.
  • 115.
    85 Figure 3.3 FT-IRspectra of P. mirabilis and P. vulgaris solvent extract in comparison with 2-methylbutanal and medium blank. The Proteus samples showed the presence of carbonyl group along with the =C-H stretch corresponding to an aldehyde which is similar to the standard 2-methylbutanal. Together, the analysis was suggestive of the presence of 2-methylbutanal as the volatile organic compound in low abundance in the cultures of Proteus grown in LB 3.3.2 Comparative Analysis of the Gas Chromatogram of 2-methylbutanal and DCM-extract of Proteus Confirmed 2-methylbutanal as the Characteristic VOC of Proteus To confirm that the volatile compound from Proteus was 2-methybutanal, GC was carried out using pure 2-methylbutanal as well as DCM-extract. A distinct peak at 2.25 min in the gas chromatogram of the DCM-extract from Proteus culture matched with the peak at 2.30 min of pure 2-methylbutanal (Figure 3.4), indicating a good match and proving that the VOC released by Proteus under the optimized condition was 2-methylbutanal.
  • 116.
    86 Figure 3.4 Comparativechromatogram of the culture extract of Proteus and standard 2-methylbutanal. The gas chromatographic peak at 2.3 min from Proteus culture extract matched with the peak for 2-methylbutanal 3.4 DETECTION OF VOLATILE CARBONYLS USING COLORIMETRIC AND FLUORIMETRIC REAGENTS Volatile carbonyl compound was identified initially using colorimetric reagent. Owing to the lower abundance of these compounds from culture an alternative assay using fluorescent reagent was standardized. The results of both the methods are explained below. 3.4.1 Colorimetric Reagent Detected Micromole Levels of VOCs Once 2-methylbutanal was confirmed to be the characteristic VOC of Proteus, first a colorimetric assay using 2,4-dinitrophenyl hydrazine was attempted. It was able to differentiate volatile carbonyl compounds from the other non-carbonyl compounds when tested in pure form. Hence when silica coated discs were used for adsorption of the vapours of pure compounds and reacted with 2,4-DNPH, colour differentiation was observed as shown in Figure 3.5. However, the sensitivity measurement indicated that the methodology could be used to detect only PPM levels of these volatile
  • 117.
    87 compounds, which wasapparently inadequate based on the abundance of 2-methylbutanal in micromole levels in the culture medium. Figure 3.5 Spot detection of 2-methylbutanal vapours with 2,4-DNPH produced a bright yellow coloured product while with alcohol and blank no bright yellow coloured product was formed. Standard 2-methylbutanal ranging from 20-50 µmoles were spotted using 2,4-DNPH 3.4.2 Standardization of the Fluorescent Reagent Showed Better Sensitivity The colorimetric indicator was then replaced by the fluorescent reagent, dansyl hydrazine (DNSH) for its superior sensitivity in nanomole range. The DNSH reagent prepared by dissolving DNSH in acetonitrile along with acetic acid at a pH 3.4 differentiated the carbonyls and non-carbonyls more effectively than only the dye without acidification (Figure 3.6). When headspace was targeted, apart from being poorly reproducible, lower concentrations were not easy to be adsorbed and detected using silica discs even with this sensitive reagent. Therefore detection of VOCs in vapour phase was given up after a lot of trails. Instead solution phase, which is in equilibrium with the vapour phase, was targeted.
  • 118.
    88 Figure 3.6 Comparativefluorescence response of DNSH reacting with carbonyl compounds (positive) and non-carbonyl compounds (negatives) or DNSH reacting under acidic condition. The signal-to-noise ratio was high when DNSH reacts under acidic conditions. This formed the basis of the DNSH reagent preparation 3.4.2.1 Identification of carbonyl compounds using fluorescent reagent 2,4-DNSH Two carbonyl compounds (2-methylbutanal and tridecanone) showed distinct fluorescence shift from orange (blank) to green when viewed at 330 nm in a UV transilluminator; other compounds like acids and alcohols did not cause this fluorescence shift as shown in Figure 3.7. As can be seen in Table 3.4, the sensitivity of the assay was found to be ranging from 1 to 100 nmoles for various aldehydes and ketones in their pure form. In the case of 2-nonanone the sensitivity was much lower at 580 nanomole. The literature survey showed that many VOCs are produced in these ranges by bacteria including Proteus.
  • 119.
    89 Figure 3.7 Thepicture shows the fluorescence obtained from the reaction of DNSH with pure compounds. The DNSH reagent reacted with the carbonyl compounds to form respective hydrazones showing green fluorescence while blank and acids form no product retaining the reagent’s orange fluorescence Table 3.4 Assay sensitivity for various carbonyl compounds S. No. Compound Detection limit ±2 nanomoles 1. Benzaldehyde 20 2. Decanal 30 3. Hexanal 8 4. Nonanal 6 5. 2-methylbutanal 1 6. Acetophenone 17 7. 2- heptonone 7 8. 2- nonanone 580 9. 2- pentanone 98 10. 2- tridecanone 8 3.4.2.2 Development of 96-well based fluorimetric assay for detection of carbonyl compounds using the optimized reagent Since surveillance demands high-throughput methods, the assay was adapted to the standard 96-well microtitre plate format compatible to be
  • 120.
    90 read using afluorescence plate reader or imaged with a UV transilluminator. The assay was performed in this new format with the pure compounds consisting of aldehydes (benzaldehyde, hexanal, nonanal, and 2-methylbutanal), ketones (2- heptonone, 2- nonanone, 2- tridecanone, 2- undecanone, 2- pentanone and acetophenone), acids (propionic acid, phosphoric acid and butyric acid) and alcohols (propanol, ethanol, methanol and butanol) with suitable blank and controls showed the green shift for carbonyls. Figure 3.8 shows the fluorescence image of the test plate where the carbonyl compounds showed the green fluorescence whereas, the alcohols and acids showed only orange fluorescence of the reagent. Figure 3.8 Differentiation of carbonyl (green fluorescence) and non- carbonyl compounds (orange fluorescence). Carbonyl Compounds used: Hexanal, Nonanal, 2-methylbutanal, Benzaldehyde, Decanal, 2-nonanone, 2-tridecanone, 2-heptanone, 2-undecanone, 2-pentanone, Acetophenone, Non-carbonyl compounds- alcohols: Propanol, Ethanol, Methanol, Butanol and acids: Propionic acid, Phosphoric acid and Butyric acid all added in duplicates 3.4.2.3 Fluorescence shift was observed between Proteus and non- Proteus organisms After the development of a simple fluorescence method for Proteus detection in culture, the method was tested for its utility as diagnostic method for Proteus and non-Proteus organisms. The Em λmax of DNSH under acidic
  • 121.
    91 condition (pH 3.4)was 564 nm and when it was reacted with carbonyl compounds (pure or in culture), the Em λmax shifted to between 510 to 535 nm (bright green fluorescence), while for a variety of acids and alcohols it was between 545 to 570 nm (orange fluorescence). The Figure 3.9 (a) below shows the representative spectra of the carbonyl and non-carbonyl compounds and Figure 3.9 (b) shows those of bacterial cultures. The shift to green fluorescence from orange, specific to carbonyl compounds among commonly reported VOC types, was also convenient for visual observation. For the routine assay, ProteAl, excitation was set at 336 nm and the fluorescence shift was measured at 531 nm. Figure 3.9 Determination of Ex. /Em. λmax for pure compounds and bacterial cultures. The emission spectra on the left (excitation 336 nm) (a) are of pure carbonyl (hexanal and 2-heptanone), acid (propionic acid) and alcohol (butanol) compounds after reaction with DNSH under the assay conditions. The emission spectra on the right (b) are of the cultures of Proteus, UPEC and Salmonella after reaction with DNSH under the assay conditions
  • 122.
    92 3.4.2.4 ProteAl isfound specific to Proteus among the commonly occurring uropathogens Confirming the performance of the simple fluorescence-based DNSH method devised for carbonyls with respect to specificity and sensitivity using pure compounds, it was applied to the uropathogens, E.coli, Klebsiella, Pseudomonas, Proteus and Enterobacter and other pathogens, Shigella, Salmonella and Staphylococus. When the strains were grown in LB medium at 37 °C for 7 h, only Proteus (mirabilis and vulgaris) showed the distinct green fluorescence upon addition of the reagent indicating the presence of carbonyl compounds. Encouraged by the promising results, more number of Proteus strains (both clinical and standard) were tested along with other negative strains as shown in the Figure 3.10. As can be seen, only Proteus strains scored positive in this test, thus making the test 100% specific and sensitive in this limited trial. It is also to be noted that in spite of the capability of other organisms to produce carbonyl compounds, under the conditions used, only Proteus was able to produce either one or more such compounds. Figure 3.10 Performance of DNSH reagent on a set of standard strains distinguishing Proteus (A2 to A11 & B2 to B11) with green fluorescence from the LB medium blank (A1 & B1) and negatives UPEC (A12&B12, D1 to D3 & E1 to E3), Klebsiella (D4, E4, D5 & E5), E. coli (D6 to D9 & E6 to E9) and Salmonella (D10 to D12 & E10 to E12) showing orange fluorescence
  • 123.
    93 When Proteus grownin various media like LB, NB, AB and TSB were assayed, the differentiation of the positive and the negative was minimally significant quantitatively in AB and NB medium while no change was observed in TSB medium. Visual differentiation of positive and negative was significant only in LB medium. The fluorescence values obtained for blank and Proteus are shown as bar diagram in Figure 3.11. Figure 3.11 Proteus cultures grown in LB medium showed higher fluorescence response compared to the blank and other common growth media NB, AB and TSB 3.4.2.5 The amount of 2-methylbutanal from Proteus culture was quantified The fluorescence response of Proteus and other organisms to ProteAl showed effective differentiation between the blank, positives and the negatives as shown in the Figure 3.12.
  • 124.
    94 Figure 3.12 Thefluorescence response of Proteus and other organisms after ProteAl. Proteus species showed maximum fluorescence compared to the medium blank and other bacteria, which have comparable response levels The fluorescence spectra of ProteAl for 2-methylbutanal and Proteus VOC matched well as shown in Figure 3.13(a). The sensitivity of the method was ~1 nmol and the measurements of 2-methylbutanal was linear up to ~200 μmol with 0.99 regression Figure 3.13(b). The amount of VOC released by Proteus was calculated using this standard graph. The assay at various time points of growth, from 0-24 h, as shown in Figure 3.13(c), revealed that detectable amounts of the compound was present in the culture from 4th h (~1 nmol) in the mid-log phase, and increased linearly up to 10 h (~15 nmol). Only Proteus showed the release of 2-methylbutanal in nanomoles that reached a maximum of 13 nmol in broth culture and assay conditions. Being a volatile compound, the actual amount of 2-methylbutanal released by the organism could be hundreds of nmoles. From the point of view of diagnostic test, detection requires 5 h of growth for a sensitive fluorimeter and 7 h for observation using UV illuminator, even when the inocula/samples contain as low as 102 cells. RFU Blank Proteus vulgaris Proteus mirabilis Salmonella UPEC Klebsiella Pseudomonas
  • 125.
    95 Figure 3.13 Theset of data in this composite figure compares the properties of pure 2-methylbutanal with those of DCM- extract from the Proteus culture (a) shows the fluorescence emission spectra of DNSH reacted with 2-methylbutanl matched with that of the spectrum obtained from the reaction of DNSH with the culture (b) is the standard graph for 2-methylbutanal using ProteAl assay showing sensitivity up to 1 nmol and good linearity up to 20 nmol (c) shows the graph of the fluorescence response for bacterial cultures using ProteAl performed every hour up to 24 h 3.4.2.6 The volatile component responsible for green fluorescence in ProteAl was confirmed to be 2-methylbutanal The fact that the dye was reacting only with the released 2-methylbutanal but not with the cell components was apparent, as culture- free supernatant was positive and the cells were negative for the assay as shown in Figure 3.14. The fluorescence intensity reduced due to centrifugation.
  • 126.
    96 Figure 3.14 2-methylbutanalis seen as a secretary VOC product as only the culture supernatant but not the cells of Proteus yielded green fluorescence (wells 7&8) after ProteAl 3.4.2.7 The characteristic 2-methylbutanal was highly volatile The fact that ProteAl was reacting with only volatile 2-methylbutanal in the culture was evident by the green fluorescence seen in samples maintained at 4 °C and on ice but not in those maintained at room temperature and assayed after 1 h or 2 h, as shown in the Figure 3.15(a) below, the cold conditions obviously prevented the evaporation. The result was similar to that of pure compound 2-methylbutanal dissolved in the culture medium as shown in Figure 3.15(b). Figure 3.15 Volatility of 2-methylbutanal released by Proteus in comparison with pure compound. (a) shows that the fluorescence intensity of DNSH-derivatized carbonyl compound(s) in the Proteus cultures kept at room temperature (27 ºC), fridge (4 ºC) and on ice (0 ºC) reduces drastically as a function of temperature as well as duration of storage indicating volatile nature (b) shows the fluorescence intensity of standard 2-methylbutanal experimented similar to Proteus culture at different temperatures
  • 127.
    97 3.5 VALIDATION OFTHE ASSAY USING VARIOUS CLINICAL UROPATHOGENS Following the confirmation of 2-methylbutanal as a biomarker for Proteus spp. the ProteAl was validated with more number of strains. As can be seen from the Figure 3.16, laboratory-level validation using 39 standard strains and 56 samples of clinical bacterial isolates consisting of commonly occurring uropathogens such as E. coli, Proteus spp., Pseudomonas aeruginosa, Klebsiella spp., Enterobacter, Citrobacter, Staphylococcus spp. and Salmonella spp. showed absolute specificity and sensitivity (using the formula given in section Materials and Methods) for the genus Proteus. The concentrations of 2-methylbutanal for the cut-off with 100% sensitivity and specificity is approximately 55 µM, where, the RFU is >10,000 for positives and less than 10,000 for negatives. Figure 3.16 Validation of ProteAl using 39 standard strains and 56 clinical isolates as given in table 3.5. Out of the 95 strains screened, 27 strains gave positive results indicated by bright green fluorescence. Others including uropathogenic strains showed the background orange fluorescence The confidence intervals for the positive, Proteus and the negatives were calculated using 28 samples of each in triplicates. The confidence interval for the sensitivity and specificity of the assay was calculated using 28 samples (taken in triplicate). Thus, the 99% confidence interval for sensitivity and specificity of all positive and negatives are between 0.941-1.039.
  • 128.
    98 Table 3.5 Validationof ProteAl using standard and clinical strains Table 1 Validation of ProteAl using standard and Clinical strains Well No. Organism ProteAl (RFU) Well No. Organism ProteAl (RFU) Well No. Organism ProteAl (RFU) Trial 1 Trial 2 Trial 1 Trial 2 Trial 1 Trail 2 A1 Medium blank 7234 8241 C9 K. pneumoniae (MTCC 2653) 8281 7089 F5 *P. aeruginosa (326543) 8204 7096 A2 E. coli (ATCC 25922) 7826 8315 C10 *P. mirabilis (328271) 18401 11032 F6 *P. aeruginosa (326604) 8121 7336 A3 P. aeruginosa (ATCC 27853) 7730 7662 C11 K. pneumoniae (MTCC 661) 8345 9021 F7 *P. aeruginosa (121602592) 7873 7327 A4 S. flexneri (ATCC 29508) 8375 7729 C12 P. aeruginosa (MTCC 424) 8685 7085 F8 *P. mirabilis (5164) 13838 16615 A5 S. flexneri (MTCC 9543) 8401 7734 D1 *P. vulgaris (121103217) 11232 15289 F9 *S. typhimurium (327753) 8219 8007 A6 P. mirabilis (ATCC 7002) 13774 15241 D2 P. aeruginosa (MTCC 1934) 8338 7844 F10 *S. typhimurium (328897) 8471 8208 A7 S. paratyphi (MTCC 3220) 7931 7869 D3 S. flexneri (MTCC 1457) 8447 7256 F11 *P. mirabilis (5166) 16296 11272 A8 S. enterica (MTCC 3231) 8259 7549 D4 S. flexneri (MTCC 9543) 8129 6951 F12 *S. typhimurium (121703058) 8386 7909 A9 P. mirabilis (ATCC 29906) 19267 14619 D5 S. pneumoniae (MTCC 655) 8617 9430 G1 *S. typhimurium (18946) 8173 7854 A10 E. coli (MTCC 723) 7394 7017 D6 S. pyogenes (MTCC 1927) 9819 9099 G2 * Enterobacter (14736) 8590 7178 A11 E. coli (MTCC 443) 7623 8229 D7 S. enterica (MTCC 3224) 9818 9980 G3 *P. mirabilis (5169) 10112 16873 A12 E. coli (ATCC 13534) 8218 8382 D8 *P. mirabilis (15322) 13310 15802 G4 * Enterobacter (339969) 8068 8246 B1 P. vulgaris(ATCC 6380) 13416 12288 D9 L. monocytogenes (MTCC 839) 8002 9433 G5 *P. mirabilis (281) 12381 18743 B2 S. aureus (MTCC 3160) 7605 7901 D10 S. aureus (ATCC 25923) 8309 8242 G6 * Citrobacter (24361) 8534 7408 B3 K. pneumoniae (ATCC 13883) 8440 8005 D11 E. coli (MTCC 901) 8390 7989 G7 *Citrobacter(328327) 8716 7517 B4 P. vulgaris (MTCC 1771) 12981 12476 D12 *P. mirabilis (806970) 12492 13234 G8 *E. coli (311475) 7946 7112 B5 S. aureus (MTCC 3160) 8577 8474 E1 *E. coli (21728) 7956 9475 G9 *E. coli ( 21595) 8864 8502 B6 S. aureus (MTCC 6908) 8654 7718 E2 *P. mirabilis (122101203) 13055 15298 G10 *P.mirabilis (282) 11938 20535 B7 S. chromogenes (MTCC 6153) 8669 8876 E3 *E. coli (21748) 8043 8335 G11 *E. coli (121201233 ) 8783 7321 B8 S. haemolyticus (MTCC 8924) 7432 8412 E4 *E. coli (25922) 8001 8254 G12 *P.mirabilis ( 803) 13259 13946 B9 P. mirabilis (ATCC 336874) 18682 16120 E5 *P. mirabilis (5155) 10596 16132 H1 *E. coli (318253) 8066 7642 B10 S. epidermidis (MTCC 435) 7624 8792 E6 S. aureus (25923) 8450 9152 H2 *P. mirabilis (487 ) 17231 16465 B11 *P. mirabilis (6878) 18187 15111 E7 *P. mirabilis (3401488) 10587 15056 H3 *E. coli (318304) 8336 7977 B12 E. coli (MTCC 568) 7395 8635 E8 *P. aeruginosa (27853) 8060 9715 H4 *E. coli (318429) 8806 7372 C1 E. coli (MTCC 1687) 9822 8178 E9 *P. mirabilis (5156) 24917 12583 H5 *P. mirabilis (981447) 16962 17126 C2 *P. vulgaris (307316) 12610 24749 E10 *E. coli (340266) 8166 8217 H6 *E. coli (318510) 8257 7626 C3 E. coli (MTCC 433) 8941 8254 E11 *E. coli (111406070) 8081 8570 H7 *E. coli (320149) 8276 8818 C4 *P. mirabilis (121101096) 20973 24003 E12 *E. coli (111706439) 8045 7422 H8 *P. mirabilis ( 494750) 14519 14311 C5 E. coli (MTCC 9537) 9591 8299 F1 *Klebsiella (340053) 8083 7470 H9 *E. coli (320487) 9455 7401 C6 K. pneumoniae (MTCC 3384) 9132 8347 F2 *Klebsiella (4483) 8618 7389 H10 *E. coli (320652) 8568 7327 C7 *P. mirabilis (332049) 11746 22184 F3 *Klebsiella (121103186) 8276 7809 H11 *E. coli (320904) 8257 7788 C8 K.oxytoca (MTCC 2275) 8151 7629 F4 *P. mirabilis (5163) 16255 15389 H12 *E. coli (320923) 8449 7231 *M/s Lister Metropolis Laboratory, RFU – relative fluorescence unit
  • 129.
    99 Table 3.6 Environmentalsample details and the strains identified Location Type of waste No. of strains based on colony morphology No. of strains identified using biochemical and microbiological tests Staphylo- coccus Proteus E. coli Pseudomonas Bacillus Others Madipakkam, Chennai Garbage disposal 70 7 2 5 2 5 49 Pallikaranai Chennai Soil at hospital site 67 4 3 5 2 - 53 Taramani Chennai Soil from lab disposal 63 7 4 4 5 5 38 Total 200 18 9 14 9 10 140
  • 130.
    100 Around 200 environmentalstrains were screened using ProteAl assay out of which 9 strains were found to be Proteus. The Table 3.6 provides the details of the samples and the identified strains. Figure 3.17 Validation of environmental strains. Wells G 4, 5 and H 4, 5 are duplicates of standard positive control, P. mirabilis and P. vulgaris respectively. Only Proteus strains were identified by the green fluorescence while the others gave orange fluorescence 3.6 RELEASE OF 2-METHYLBUTANAL BY PROTEUS THROUGH ISOLEUCINE METABOLIC PATHWAY On the basis of structural considerations, it is reported that 2-methylbutanal and 2-methylbutanol are derived from isoleucine. The actual pathways for their synthesis and the biosynthetic enzymes have not been identified in bacteria but a pathway has been described in yeast and Lactococcus lactis. This proposed pathway begins with the action of branched chain aminotransferases (BCATs) (Andrej et al 2012) that removes the amino group from the respective amino acids and subsequently, there is a decarboxylation to produce the aldehydes and a reduction to form the
  • 131.
    101 alcohols. Aminotransferase enzymesuse α-ketoglutarate as amino group acceptor and thereby produce glutamate. The α-keto acids of the branched- chain amino acids have been recognized to have cheesy flavours (Singh et al 2003). They are further metabolised to other flavour compounds such as aldehydes, alcohols and carboxylic acids, but also into hydroxyl acids, which are not considered to contribute to flavor. The putative pathway is shown in Figure 3.18. Figure 3.18 The putative isoleucine catabolic pathway involved in the production of 2-methylbutanal in Proteus. The metabolic pathway uses the enzymes aminotransferase and α-ketoacid decarboxylase for conversion of acid to an aldehyde 3.6.1 In Silico Analyses Revealed the Presence of the Enzymes of Isoleucine Catabolism in Proteus Reports suggested that 2-methybutanal was released by isoleucine pathway in yeast, insilico analyses were conducted to identify if such a pathway was involved in Proteus also. The gene coding for the enzyme(s) responsible for the production of 2-methylbutanal identified in Lactococcus
  • 132.
    102 lactis was blastedwith P. mirabilis sequence. The sequence of the enzymes aminotransferase of Lactococcus lactis (Uniprot ID: F2HLX1) when blasted with Proteus mirabilis (Uniprot ID: B4F1U2) using the CLUSTAL W2 tool gave 46% similarity. The sequence similarity of alpha-ketoacid decarboxylase (kdcA) Lactococcus lactis (Uniprot ID: Q6QBS4) with Proteus mirabilis (Uniprot ID: S5UQF3) was 53%. The protein sequence match between both the organisms is given in the Table (3.7 and 3.8). However, there was no report on the presence of these enzymes in P. vulgaris. Table 3.7 Multiple sequence alignment of aminotransferase in Lactococcus lactis and Proteus mirabilis sequence
  • 133.
    103 Table 3.8 Multiplesequence alignment of alpha-ketoacid decarboxylase in Lactococcus lactis and Proteus mirabilis sequence
  • 134.
    104 3.6.2 Enhanced FluorescenceDue to Isoleucine Supplementation in the Growth Medium After ascertaining the presence of genes for 2-methybutanal pathway, LB medium was supplemented with isoleucine for activating the production of 2-methylbutanal. There was an increase in the fluorescence for Proteus spp. up to a concentration of 15mM isoleucine compared to unsupplemented LB (Table 3.9; Figure 3.19). Table 3.9 Concentration of isoleucine and the fluorescence response of ProteAl Concentration of isoleucine (mM) 0 8 15 23 31 38 76 Blank Trial 1 3899 4723 4366 3314 3297 3276 2994 Trial 2 5675 4952 4482 4445 4956 4861 4168 Trial 3 3695 4464 6537 3330 4267 3265 3138 Trial 4 5675 4952 4482 4445 4956 4861 4168 Proteus Trial 1 24497 24694 32740 27202 32225 21138 12911 Trial 2 11798 12238 16965 17087 17626 11949 8501 Trial 3 27479 26832 34871 28601 25091 27287 20184 Trial 4 11798 13708 26637 16606 16366 18195 16473 Salmonella Trial 1 5129 4848 6193 4490 4742 4766 4517 Trial 2 6616 5814 6269 5240 5558 5715 4822 Trial 3 4866 4664 6164 4692 4575 4546 4319 Trial 4 6616 6634 7263 6753 6468 6923 6376
  • 135.
    105 However, above thisconcentration there was no distinct increase but the fluorescence started to fall back to the level in normal LB. Salmonella species which is also reported to possess similar genes did not show an increase in fluorescence when grown in the supplemented media. While the isoleucine concentration was varied and checked for the increase in fluorescence, leucine and valine were also tested to check for specificity of the activator. There was neither an increase nor decrease in fluorescence when leucine and valine was supplemented. The bar diagram in Figure 3.20 shows the comparative fluorescence response to ProteAl for LB and other supplemented medium. Figure 3.19 Fluorescence response for only Proteus increased after addition of isoleucine in the LB medium while the negatives and blank did not show any distinct effect. The profile shows that the addition of isoleucine beyond 15 mM (peak concentration) actually led to the reduction in the enzyme activity
  • 136.
    106 Figure 3.20 Thebar-diagram indicates specific increase in fluorescence of Proteus to ProteAl in LB -Ile medium compared to LB or its supplementation with related branched chain amino acids. It evidently shows that only isoleucine enhances 2-methylbutanal production 3.6.3 Enhancement of 2-methubutanal Production using Thiamine Pyrophosphate Supplements Several reports suggest that TPP acts as a catalytic cofactor for alpha-ketoacid dehydrogenase. It catalyzes the decarboxylation of the α-ketoacid. Hence its effect on 2-methylbutanal production when supplemented in the LB medium was experimented with various concentrations (0.5,1.0,1.5,2.0,2.5 mM). There was increase in fluorescence even with the addition of 0.5 mM. However maximum increase in fluorescence was obtained at 2 mM concentration as shown in the Figure 3.21 beyond which there was decrease in the fluorescence. Hence, the standardised LB-TPP was prepared with 2 mM TPP in regular LB medium. The Table 3.10 gives the RFU obtained for Proteus when various concentrations of TPP was supplemented.
  • 137.
    107 Table 3.10 Concentrationof Thiamine pyrophosphate and the fluorescence response of ProteAl Concentration of TPP in mM 0 0.5 1.0 1.5 2.0 2.5 Blank Trial 1 8188 8145 8103 8080 7773 7750 Trial 2 7943 8280 8298 8321 7883 7993 Trial 3 9700 9599 9174 8625 8453 8011 Trial 4 8860 9625 8384 8623 8638 7835 Proteus Trial 1 13466 16166 17507 15009 18854 15046 Trial 2 14538 16441 17147 15557 21504 11649 Trial 3 13973 16260 16657 15116 19704 13346 Trial 4 14204 16121 15922 14523 17606 14715 Figure 3.21 Fluorescence increased as a function of Thiamine pyrophosphate supplementation in the LB medium for Proteus. The peak indicates theconcentration (2 mM) of TPP for maximal production of 2-methylbutanal. Beyond 2 mM of TPP there is a drastic reduction in 2-methylbutanal production
  • 138.
    108 3.6.4 LB-Isoleucine (LB-Ile)Medium Enhanced 2-methylbutanal Production Compared to other Supplemented Medium Different supplemented media including LB-Ile, LB-TPP and LB-Ile-TPP were prepared with LB medium. LB when supplemented with isoleucine and TPP individually showed enhanced fluorescence when compared to ProteAl on regular LB medium. LB with Ile and TPP in combination also gave enhanced fluorescence. However, maximum fluorescence was obtained in LB supplemented with isoleucine without the co-factor TPP. There was approximately two and a half fold increase in the fluorescence value as shown in Figure 3.22. Hence this medium was found to be the most suitable for enhancement of 2-methylbutanal production. The RFU obtained in three different trials for LB and LB supplemented media are given in the Table 3.11. Figure 3.22 The picture shows the yield of 2-methylbutanal under growth in LB, LB-Ile, LB-TPP, LB-Ile-TPP. While LB-Ile showed the maximum 2-methylbutanal production in all the three trials
  • 139.
    109 Table 3.11 Thefluorescence value of different supplemented growth medium obtained in three trials Medium LB LB-Ile LB-TPP LB-Ile-TPP RFU Trial 1 12478 32740 18854 26746 RFU Trial 2 13218 30965 21504 20726 RFU Trial 3 14521 34871 19704 27387 3.7 TOTAL RNA WAS EXTRACTED BY PHENOL- CHLOROFORM METHOD To probe if the increase in 2-methylbutanal is due to transcriptional or translational regulations, total RNA was extracted from 7 h grown culture of P.mirabilis and P.vulgaris in LB, LB-Ile and LB-Ile-TPP medium . The distinct bands of 23S, 16S and 5S subunits were observed as shown in Figure 3.23. A few other bands on the gel denoted the smaller fragments of RNA. The purity of RNA (A260/280) was approximately 2 measured in the “Nanodrop”. Figure 3.23 Ethidium bromide stained 1.5 % agarose gel shows the total RNA extracted from Proteus. Lane 1 contains a 1Kb DNA ladder. Lanes 2-4 and 5-7 contains RNA of P. mirabilis and P. vulgaris respectively
  • 140.
    110 3.7.1 Total RNAwas Efficiently Reverse Transcribed to cDNA Total RNA obtained from P. mirabilis and P. vulgaris grown in LB and other LB supplemented medium was reverse transcribed with random hexamers and the resultant cDNA was confirmed on agarose gel. The cDNA of P. mirabilis and P. vulgaris appeared like a smear on the gel as seen in the figure 3.24. The purity (A260/280) was approximately 1.9 in all the samples. The concentration of cDNA for P. mirabilis grown in LB, LB-Ile and LB-Ile- TPP were 200 ng/µl, 693 ng/µl and 1256 ng/µl respectively. The concentration of P. vulgaris was 1664 ng/µl, 3537 ng/µl and 856 ng/µl respectively. These samples were further diluted to contain approximately 10- 12 ng/µl and used as template for qPCR. Figure 3.24 cDNA was synthesized from the total RNA of P. mirabilis and P. vulgaris grown in LB or LB supplemented with Ile or TPP. The cDNA preparations, which appear as smears in agarose gel electrophoresis, was used as template for qPCR amplification
  • 141.
    111 3.7.2 Amplified ProductShowed the Presence of α-ketoacid decarboxylase (kdcA) Gene Transcript Further, the gene transcript was amplified using the specific α-keto acid decarboxylase primers. The amplified product of this gene transcript was approximately 225 bp as seen in figure 3.25 a & b. This was sequenced in both P. mirabilis and P. vulgaris. Figure 3.25 shows the sequence of the gene transcript of α-keto acid decarboxylase in both P. mirabilis and P. vulgaris. The BLAST analysis of the gene transcript obtained with the reported Proteus mirabilis BB2000 showed 100% identity. The presence of this gene transcript in P. vulgaris is reported for the first time in this study. Figure 3.25 The PCR amplified product shows distinct bands corresponding to the size of alpha-ketoacid decarboxylase gene transcript at approximately 225 bp in P. mirabilis (Fig. (a) lane 1 and (b) lanes 2&3) and P. vulgaris (Fig. (a) lane 2 and Fig. (b) lanes 4&5)
  • 142.
    112 >ENA|AGS58890|AGS58890.1 Proteus mirabilisBB2000 alpha-keto acid decarboxylase : Location:1..1638 ATGATTACAGTTTTAGATTATTTATTAGTAAGATTAAAAGAGTTAGAAAT TAAAACTATTTTTGGTGTTCCCGGCGATTATAATTTACCTTTTATTGGTGT TGTTGATAATGATAAAGATATTCAATGGGTAGGAGCATGTAATGAATTA AATGCATCATATGCTTGTGAAGGATACGCACGGATCAAAGGTTTTTCTGC TCTGTGTACAACCTATGGAGTGGGGGAGTTAAGTGCGATAAATGGTGTT GCTGGCGCCTTTGCAGAGCAGGTTCCTATTATTCATATTGTTGGCGCGCC TTCTCAGTCAAAGCAAGAGAAAGGAAAAACATTACATCATTGTTTAGCG ACGGGTAGGTTTGATGCCTTTGAAAAAATGTATCGTCATATTTCAAAAAC AACGGCTGTATTAACATATCACAATGCGACGGAAGAAATTGATAGAGTA TTAGAAACATTGTGGCGTTATCGATATCCGGTTTATTTATTAATACCAGA GGATGTCGGTGTGATGAAAGTTAATAAACCAAAGTTACCATTACAATTA ACATTACCTCAAAGTAATCCCGACGATTTAAATAAAGTTATTACTCTTCT TGAAAATAAAATTAAGCAATCAAAATCACCATGTATTATTATTGGCGAA CAAGTATCACGTTACCAATTAAGAAAACAAGTTGAGAATTTATTAGAAA AAACTAATCTGCCATTTTTTACTGTATGGGGAAGTAAAGGGGTTGTTGAT GAAGGGCGTCAACAGTATGGTGGAATATTATTTGGTGAATTATCTAATCC ACAAGGTTTAGATTATATTATAAATTCTGATTTAATTATTAGTCTTGGGG TGAGTTGGGATGAAGTTAATACAGCTGGATTTACCTTCGACGTTCCCACA CAAAATTGCTATCAATTTTATGATACTTATAGCTTAATTGAGGAAGAGAA GATTTATGGCGTTTCTTTACTCGATATGCCTAACGCCTTATTAGCCCTTGA CTATATTTATCCCCACAACATAGCGTTACTACCGCAAAAAATAGTACCGC CTGATTGGCAAGGACTGATAAAAATAGATTCTATTCCTCTTCTGTTAGAT AAAGTCCTTGATGATAATTCGGTTATTCTTGCTGAAGCAGGTAATGCTTT TTTATGTGCTGTTAATCATATATTTTCTGGTAACAGTCAATTAGTGGTCA GTAATATTTGGGCATCCATTGGTTATACTTTACCCGCCGCATTAGGTGTT ACTCTTGCATTAGAAAACCAAGGACGTGCCTTTGTTGTTATTGGTGATGG TGCATTTCAGATGACTGCACAAGAGCTTTCTACTTTATTACGCTTAAAAC TCAATCCCGTTATTTTTATTGTTAATAATCAAGGTTACGCATTTGAAAAG ATCTTTTACGGGCCTAAAGATACCTTTAATGATATCCAAAACTGGAATTA CTCACAGTTACCTGAGCTATTTAATTGTGATGCTTATAGTGTGAAAGTGG ATAGTCTAGAAGCGTTAGAAACCGTATTACCTTTATTAAAAGTGCATCAA GATAAACTGTGCCTTGTTGAACTTGATATGGATAAACATGACTATTCGGA GCCAATCAGTGAATTTATTGCGTTGCTTAATCAGTATAAATGA Figure 3.26 Sequencing results of alpha-ketoacid decarboxylase gene transcript. The red coloured basepairs denotes the sequence of kdcA gene transcript after sequencing in P. mirabilis and P. vulgaris
  • 143.
    113 3.7.3 Gene Expressionof Proteus Species in LB and LB Supplemented Growth Medium Real-time PCR amplification curves for alpha-ketoacid decarboxylase gene obtained were reproducible and indicated that primers were selective and effective in producing the specific PCR products. 3.7.3.1 Isoleucine (Ile) and Thiamine pyrophosphate (TPP) addition to LB Medium alters the Expression of α-ketoacid decarboxylase (kdcA) Gene in P. mirabilis The cells grown in LB-Ile exhibited significant up-regulation (P<0.0001) of kdcA gene expression compared to LB. However, the comparative analysis between LB and LB-Ile-TPP exhibited less significant change in expression. The gene expression values were calculated using the 2-ΔΔCT method as given in the Table 3.12. A reduction of seven fold increase in the message in the presence of Ile to approximately five-fold in TPP was observed. Confidence interval (95%) for LB with LB Ile, LB with LB-Ile- TPP, LB with LB-TPP are -12.33 to -4.367, -9.027 to -1.063 and 10.24 to 13.35 respectively. The fold difference of gene expression of Proteus between different growth medium is shown in the Figure 3.27. The melting curves generated at the end of the PCR reaction showed that all amplicons of kdcA had a melting temperature of 78-79°C. The amplicons of rpo A (reference gene) had a melting temperature of 82°C.
  • 144.
    114 Table 3.12 Calculationof fold difference in P. mirabilis using 2-ΔΔCT method Sample (Proteus mirabilis) kdcA - Average CT rpoA Average CT Δ CT kdcA -rpoA ΔΔCT ΔCT LB - ΔCT other medium Fold difference in supplemented medium relative to LB medium LB 16.92±0.01 20.93±0.002 -4.00±0.01 0±0.01 1 16.85±0.16 20.93±0.46 -4.06±0.48 0±0.48 1.4 17.05±0.35 20.28±0.46 -3.22±0.57 0±0.57 1.5 LB Isoleucine 17.11±0.20 23.93±0.00 -6.82±0.20 -2.81±0.20 8.1 17.54±0.50 23.931±1.11 -6.39±1.21 -2.32±1.21 11.6 17.05±0.15 22.37±1.10 -5.32±1.11 -2.09±1.11 9.3 LB Isoleucine TPP 17.06±0.16 23.09±0.88 -6.03±0.89 -2.03±0.89 7.5 16.15±0.98 21.85±0.13 -5.70±0.98 -1.63±0.98 6.1 17.15±0.09 22.04±0.75 -4.88±0.75 -1.66±0.75 5.3 Figure 3.27 The fold difference in PCR template from Proteus cells growing in LB, LB-Ile and LB-Ile-TPP was calculated using the 2-ΔΔCT method. The expression of α-ketoacid decarboxylase of P. mirabilis grown in LB-Ile was found to be maximum compared to LB and LB-Ile-TPP medium corroborating with enzymatic activity data
  • 145.
    115 3.7.3.2 Isoleucine (Ile)and Thiamine pyrophosphate (TPP) addition to LB medium alters the expression of α-ketoacid decarboxylase (kdcA) Gene in P. vulgaris The cells grown in LB-Ile exhibited significant up-regulation of kdcA gene expression compared to LB. The statistical analysis using ANOVA gave a P value (P<0.0001). However, the comparative analysis between LB and LB-Ile-TPP exhibited no significant change in expression. The gene expression values calculated using the 2-ΔΔCT method is given in the Table 3.13. The melting curves generated at the end of the PCR reaction showed that all amplicons of kdcA had a melting temperature of 78°C. The amplicons of rpo A (reference gene) had a melting temperature of 81°C. Table 3.13 Calculation of fold difference in Proteus vulgaris using 2-ΔΔCT method Sample (Proteus vulgaris) kdcA- Average CT rpoA Average CT Δ CT kdcA- rpoA ΔΔCT ΔCT LB - ΔCT other medium Fold difference in supplemented medium relative to LB medium LB 17.90±0.01 20.88±0.35 -2.98±0.35 0±0.35 1.3 17.60±0.18 20.39±0.05 -2.78±0.17 0±0.17 1.1 17.56±0.00 20.31±0.40 -2.75±0.53 0±0.53 1.4 LB Isoleucine 17.55±0.45 23.85±0.01 -6.30±0.45 -3.32±0.45 13.7 17.49±0.00 23. 86±0.08 -6.37±0.08 -3.59±0.08 12.7 17.41±0.02 22.97±0.09 -6.56±0.09 -3.81±0.09 14.9 LB Isoleucine TPP 17.41±0.21 21.03±0.02 -3.61±0.21 -0.64±0.21 1.8 17.69±0.31 21.07±0.02 -3.38±0.30 -0.59±0.30 1.9 17.39±0.25 21.09±0.05 -3.70±0.26 -0.95±0.26 2.3
  • 146.
    116 The fold differenceof gene expression of Proteus between different growth medium is shown in the Figure 3.28. The 95% confidence interval for LB with LB Ile, LB with LB-Ile-TPP, LB with LB-TPP was -14.07 to -10.96, -2.270 to 0.8393 and 10.24 to 13.35 respectively. A reduction of ten and a half fold increase in the expression in the presence of Ile to one and a half fold in TPP was observed. The metabolic pathway showing positive feedback regulation is shown in the figure 3.29. Figure 3.28 The expression of α-ketoacid decarboxylase of P. vulgaris grown in LB-Ile was found to be maximum compared to LB and LB-Ile-TPP medium
  • 147.
    11 7 Figure 3.29 Conceptdiagram showing positive feedback regulation of kdcA gene through isoleucine
  • 148.
    118 CHAPTER 4 DISCUSSION Bacterial infectionscontinue to devastate the developing countries due to lack of diagnostic tests that can be performed with low-infrastructure at suburban and rural areas. Bacterial volatiles are diverse and produce bouquets of compounds with comparable complexity as those of fungi or plants. A review by Stefan and Dickschat estimated that about 50–80% of the bacteria produce volatiles under laboratory conditions (Stefan & Jeroen 2007). Although it is known that growth of bacteria generates volatile organic metabolites there is a lack of knowledge about the metabolic pathway which is involved in their production. Owing to the complex nature of the volatile profiles, many factors including the growth media, genetic make-up and environmental conditions influence the volatile composition. To date we have a limited understanding of how these factors interact to determine the actual volatile composition resulting in the odour of bacteria (Muna et al 2013). In this regard, this thesis demonstrates the feasibility of using Volatile Organic Compound as a biomarker for Proteus and also our ability to design rational media for maximal production of such targets based on relevant metabolic studies. Though, research show that cultured samples of a number of bacteria has distinguishable VOC signature patterns, we were able to identify single VOC marker for Proteus in the defined growth conditions. The development of simple fluorescent based diagnostic assay provides a novel approach and best solution to combat UTI. The discussion also beckons
  • 149.
    119 to elaborate therelevance of isoleucine in the growth medium to enhance 2-methylbutanal and their effect on regulation of gene expression. 4.1 EXTRACELLULAR VOC HAS BEEN TARGETED FOR NON-DESTRUCTIVE DIAGNOSIS Despite advances in technology and medicine, UTI remains a major but neglected infectious disease affecting millions, predominantly (80%) women. Though only a few bacteria namely E. coli, Enterobactor, Klebsiella, Proteus, Pseudomonas and Staphylococcus cause the infection, this persistent and often recurrent disease has not been under control (Sheela & Johanna 2013). In the present scenario, preliminary protocols for field detection and identification of Proteus are time consuming and intensive involving a number of microbiological and biochemical tests. Field deployable rapid detection methods are not available for Proteus and therefore the non- invasive, non-destructive, and easy-to-perform detection method using its characteristic VOC, 2-methylbutanal, provides first such method useful for the next generation diagnostics and surveillance. A number of VOCs have been identified from bacteria, though not with the specific purpose of diagnostics, and these are scattered in literature requiring extensive literature survey, as done in this study. However, recently a database with a compilation of VOCs from a number of bacteria, other than Proteus, has been made available as a potential tool for identifying characteristic VOC markers. Therefore this study provides for the first time a comprehensive list of VOCs of Proteus, which includes a variety of aldehydes, ketones, alcohols, acids and sulphur-containing compounds. Since simple colorimetric and highly sensitive fluorescent reagents have been developed for the detection of carbonyl compounds compared to other functional groups, we targeted aldehydes and identified 2-methylbutanal. Interestingly, though Proteus can produce other aldehyde compounds, as
  • 150.
    120 reported in theliterature, in LB it produced only 2-methylbutanal making it a specific aldehyde compound worth using as a diagnostic target. Among the commonly used reagents like DNPH, DNSH, nitroaromatic hydrazines, 2-diphenylacetyl-1, 3-indandione-1-hydrazone (DAIH) and halogenated phenyl hydrazine for the specific detection of carbonyl compounds, DNSH, has been found to be the best suited owing to its lower level of detection even in atmospheric samples (Laurent et al 2004). Further, we were able to show the analytical reliability and practicability of DNSH, especially when used in liquid phase. Though our extensive literature survey on VOCs released by a number of common pathogenic bacteria, including the ones encountered in UTI infections, indicated that 2-methylbutanal is also produced by Staphylococcus (Lieuwe et al 2013), under the defined growth conditions described in this study only Proteus produced 2-methylbutanal. It was found to be produced only in LB but not when grown in other minimal and complex media, as also ascertained by the absolute specificity obtained in validation using other UTI and non-UTI bacteria. Detailed analysis of our compilation also showed that this phenomenon is true for other VOCs and bacteria, for which there is no evidence based reasoning, but plausibly because of the differential activation of the pathways involved. In any case this adds another useful dimension in the specificity of detection, which in nature may be relevant to sensing and sending of information about the milieu. One more advantage of selecting such VOCs, which are secondary metabolites, is the ability to induce them and achieve better sensitivity. 2-methylbutanal of Proteus is known to be released as a secondary metabolite from isoleucine degradation (David 2005) and it could be induced to secrete two and half times more than the normal, thus increasing the sensitivity proportionally. However, one of the difficulties with this compound is its
  • 151.
    121 volatility, which madeit difficult to work with the head space though a number of methods, including Static headspace extraction (SHE), Dynamic headspace extraction (DHE) or purge and trap extraction did not yield consistent and good yields (Augusto et al 2003). We were able to achieve detectable concentration of VOC from the culture by liquid-liquid extraction using dichloromethane. It is noteworthy that this extraction has to be performed soon after culturing is stopped, as the molecule evaporates within 15 min at room temperature and even simple steps like centrifugation to get clear supernatant could not be employed without drastically affecting the yield. Even freezing and thawing resulted in the loss of the compound. Maintaining cold conditions to arrest evaporation is not practical in diagnostic techniques, especially when these have to be used in peripheral labs and field level. Hence the method we developed detects the molecule instantly from the cultures using direct addition of reagents. As discussed below, this method has several advantages. In view of the vast array of products, which microorganisms can produce, no single or multiple VOC based assay has been developed so far for Proteus identification. Our study demonstrates for the first time, the presence of a single volatile biomarker, 2-methylbutanal that potentially differentiates Proteus species specifically from other organisms. 4.1.1 Single Step Reaction to Provide a Sensitive Method Since 2-methylbutanal is an aldehyde, among several possible reagents, we chose DNSH not only because of its sensitivity but also because it readily reacts with the aldehyde under acidic condition to give instantaneous bright green fluorescence, which is stable for hours as the product is non-volatile. The only precaution is that the measurement should be performed within 15 min, as the dye is air-oxidized to turn dull orange fluorescence to bright green fluorescence. It is noteworthy that the maximum fluorescence yield was observed only when the dye in acetonitrile is added
  • 152.
    122 first followed byacetic acid (final pH 3.6 to 3.9). Simplification of the assay by mixing DNSH and glacial acetic acid to give a reagent with the same pH range resulted in half the fluorescence yield due to the competing reaction of carboxylic group in acetic acid with the hydrazine group in DNSH (William & Stone 1958). The direct addition of the two reagent components one by one quickly into the culture was found to be the best and the simplest method known for the specific detection of Proteus. As our limited but quite representative screening of clinical isolates consisting of 18 different pathogens showed 2-methylbutanal to be characteristic of Proteus and ProteAl assay was absolutely specific. Our validation experiment with other common bacteria and environmental sample screening also showed 100% specificity and 100% sensitivity among the 95 known strains tested. Since screening of 200 environmental samples led us to identify 9 Proteus strains, which were also independently verified by biochemical tests, we are confident that this will be a useful technique for cost-effective mass screening. It has to be noted that our assay identifies Proteus even from mixed culture of 3 different organisms. Therefore it would be a useful tool to identify Proteus even when other bacteria are present in a sample, as in mixed infections. As the culture concentration of the VOC was found to be maximal at 7 h for a moderate inoculum of 105 bacteria, the same was set as the minimum time required before the test for visual observation using UV transilluminator. Using sensitive fluorimeters it was possible to detect fluorescence changes from 5th hour even for a lower inoculum of 102 cells. Simple viewer with Blue LED that we had fabricated was also found effective to view the plates. This will drastically reduce the cost of instrumentation based on this test.
  • 153.
    123 Our quantitative estimationof 2-methylbutanal from the standard graph for the pure compound in LB showed that the culture concentration of the compound was in the range of 5-100 nM indicating that it is a secondary metabolite synthesized in moderate levels (detected from 4th hour of growth onwards). Apart from volatile compounds, a number of non-volatile aldehydes produced by bacteria have been reported and it is possible that they could interfere with the assay, especially when the test is performed directly in the culture. However, a number of organisms other than Proteus that were tested were negative under the same experimental conditions indicating that other aldehydes, whether volatile or non-volatile, are either not produced or produced at levels below detection limit. The role of culture media in such specific release of a volatile compound can be an important factor for use of LB has not been reported in such studies. The classical biochemical methods for the identification and differentiation of Proteus are Urease and Phenylalanine deaminase tests, which are easy to perform, but not very specific. Common UTI pathogen, Klebsiella, is urease positive. Providencia and Morganella, which are uncommon UTI pathogens, are phenylalanine deaminase positive. Modern nucleic acid based methods like nested PCR have excellent specificity but require skill and not amenable for challenging peripheral laboratory conditions. ProteAl provides potential alternative in specifically identifying Proteus with absolute specificity and ease even by semiskilled workers. For diagnostic purpose, ProteAl can be employed for testing the urine samples or even identifying the organisms grown on the plates from urine samples. A small amount of the urine sample or a colony isolated from it could be grown for 6-7 hours before the fluorescent reagent is added. The fluorescence can be either read in a plate reader or imaged from a UV-transilluminator. As fluorescence measurements are becoming quite
  • 154.
    124 popular such instrumentationis becoming cheaper and more affordable. However, more work is needed to standardize the assay with urine samples and validate with samples from normal as well as in a variety of disease conditions. In contrast to the current identification methods, which take 18-24 h, ProteAl takes only 6-8 h for identification. In terms of affordability, as compared to all the methods that are currently available, ProteAl has a definitive advantage of requiring small amounts of inexpensive growth medium, less expensive reagents, high-throughput capability making the test most cost-effective (Rs. 2-3 per sample) and most convenient for mass screening. A 96-well plate assay will take only a few minutes after 7 h growth, making the method suitable to analyse hundreds of samples most economically. While such methods are not available for Proteus currently, the cost of doing it will cost a few hundreds of rupees per sample and take up to 3 days. The simple operation of the method makes it amenable for automation, demands less skill and provides safety. Though the initial results are promising, the actual clinical and environmental utility of the method requires more thorough evaluation with larger sizes of the samples with diverse organisms. To ensure that ProteAl exhibited high specificity towards Proteus we wanted to exploit the use of specific inducers of 2-methylbutanal so that a highly selective medium could be formulated. This required the study of the metabolic pathway of this secondary metabolite, which has not been probed. We employed bioinformatic approach to identify the pathway in Proteus and prove its existence and its regulation through catabolite activation. This enabled us to develop a medium that enhanced the production of 2-methylbutanal rationally.
  • 155.
    125 4.2 REGULATION OFTHE METABOLIC PATHWAY IN PROTEUS Our investigation on the metabolic pathway of 2-methylbutanal revealed that isoleucine was the precursor for its production. It is known from literature that isoleucine degradation starts with the transamination of isoleucine to α-keto-3-methyl valerate. Therefore our focus was on α-keto acid decarboxylase, which coverts it to 2-methylbutanal. To our knowledge no gene or enzyme of Proteus has yet been characterized at genetic or protein level that is involved in isoleucine metabolism to produce volatile 2-methylbutanal. Similarity to the extent of 46 and 53% respectively between branched chain aminotransferase and alpha keto-acid decarboxylase in Lactococcus lactis and Proteus mirabilis indicated the presence of appropriate enzyme and operation of this pathway in the latter. Amplification of kdcA gene from the cDNA preparations of Proteus employing the primers synthesized from its published genome sequence showed that the enzyme is not only coded but also transcribed. In fact, the existence of a fully regulated pathway was revealed by the demonstration of increase in the secretion of 2- methylbutanal by isoleucine, as in the cases of Lactobacillus, Saccharomyces and plant mitochondrial kcdA (Brian et al 2000). TPP, the co-factor of the enzyme was also able to marginally enhance the production of 2- methylbutanal by 1.5 fold at 2 mM. Beyond 15 mM isolecucine and 2 mM TPP the production was found to decline. However, when both were present, the actual amount of 2-methylbutanal production was less than when Ile alone was present. To understand the regulatory mechanism operating in Proteus better, qPCR was performed on 7 h culture to correlate the transcription levels of the α-keto acid decarboxylase gene when grown in the presence and absence of Ile or Ile and TPP. The reduction of seven-fold increase in the
  • 156.
    126 message in presenceof Ile to five-fold when present along with TPP corroborated with the decline in the production of 2-methylbutanal. This indicated to the operation of transcriptional control and this is the first such report in this pathway. On the basis of these studies, 15 mM Ile was supplemented in LB to formulate the fist-of-its-kind rational diagnostic medium for Proteus to maximize the production of 2-methylbutanal for sensitive detection using ProteAl. The utility of such rational medium was validated with other clinical isolates. Since the decarboxylase enzyme plays an important role in enhancing 2-methylbutanal production for aroma in cheese, sausage and wine manufacturing, this additional knowledge and approach could be made use of for enhancing the flavor (Mireille et al 2001). Another important outcome of our study is the demonstration of this pathway in P. vulgaris, which is also a UTI pathogen but for which genomic information is not available till now. Since 2-methylbutanal has been shown to be produced by P. vulgaris and is positive for ProteAl and it is regulated by Ile and TPP in the same manner as P. mirablis and the corresponding genes have been identified by PCR amplification and sequencing, our finding is the first comprehensive report of 2-methylbutanal production and regulatory mechanism in P. vulgaris. Though we have not studied the other rare species of Proteus, ProteAl offers genus-level detection, which appears to be sufficient for the clinician to plan treatment. What is even more important for a clinician is the right antibiotic to be given for a nosocomial pathogen like Proteus, which is often multi-drug-resistant and difficult to manage. Though we have focused on Proteus associated with UTI, the method is genus specific and therefore can be used for other disease conditions and identification in water, food and other environmental samples.
  • 157.
    127 4.2.1 ProteAl isUseful in Identifying Multi-drug-resistance of Proteus In a novel approach to obtain quicker antibiogram, within 6 h, for UTI pathogens in urine samples, our lab has been developing a method that first reports the drug resistance using a patented viability assay. This is followed by the identification of the pathogen within 2 h. This requires non- destructive and simple-to-perform assay of ProteAl type. Our screening experiments have revealed that Proteus is quite frequently isolated in UTI, the incidence varying from 10 to 30 %. All these clinical isolates were found to be of MDR type, often resistance to many of the commonly used antibiotics like amikacin, cephotaxime, amoxyclav and ciprofloxacin. A limited study on environmental sample, especially around hospital waste-dump sites, did not show prevalence. However, we feel that since UTI is excreted in infected urine, it would definitely contaminate community and therefore a survey of community areas will form a good epidemiological study and provide useful clues to channelize efforts to control its spread. ProteAl will be suitable for such studies. In other words, ProteAl could form an integral part of pathogen identification along with antibiogram devices in the future. 4.2.2 ProteAl is a Convenient Signal Generating Component of Simple and Affordable Imaging based Diagnostic and Surveillance Instrumentation For a diagnostic technique to succeed in the control of a pathogen, instrumentation is essential. To achieve this, the essential first step of signal generation has to be simple but easy to read, as in the case of ProteAl. This assay has been designed with the concept of on or off type signal generation; green fluorescence is positive and dull orange fluorescence is negative. Since
  • 158.
    128 the fluorescence methodoperates in the visible range of the spectrum, imaging offers a simple and highly affordable sensing solution to develop even portable instrument. Since 2-methylbutanal is volatile, even electronic nose is possible and this will be very useful for surveillance. Taking together, ProteAl and the volatile biomarker offer convenient starting points in instrumentation development. Of late intense effort in the development of diverse biosensors has opened up avenues for the manufacture of effective instruments for infectious diseases and this will quite radically change the microbiological and clinical scenario in the future. In our laboratory simple UV or Vis transilluminators for imaging 96-well plates or a strip of 12 are being developed as next generation tools for infectious diseases. Though we have been routinely read using expensive fluorescence readers, we found that we can get qualitative but accurate results even by using commercial Gel-Doc system or the ones our lab has been fabricating with blue LEDs for excitation and capturing the image with Web camera. It is envisaged that a futuristic instrument for Proteus detection will involve imaging of ProteAl results from a strip or 96-well plate. Electrochemical sensors will be developed in our laboratory in the future for surveillance. Schematic representation of the overview of the thesis is depicted in Figure 4.1.
  • 159.
    12 9 Figure 4.1 SchematicOverview of the thesis
  • 160.
    130 CHAPTER 5 CONCLUSION 2-methylbutanal hasbeen identified as a VOC based biomarker for pathogens belonging to the genus Proteus using extensive cheminformatic analysis and analytical investigation. ProteAl, a simple, non-destructive and non-invasive method, is a tool to detect Urinary Tract Infections and other infections caused by Proteus, a notorious nosocomial pathogen can be performed within 7 h compared to 2-3 days culture test currently available. Performed with ease in 96-well microtitre plates, which is routinely used in diagnostic laboratories, the assay can be easily adopted in clinical laboratories including peripheral labs and hospitals. This next generation methodology based on VOC biomarker, 2-methylbutanal is highly economical and amenable for simple imaging based instrumentation for user-friendly and safe operation. Being suitable for high-throughput format and based on volatile compound released, it is highly compatible for screening and surveillance through even electronic nose. Considering all these features, we believe that an affordable instrumentation for an early and high-throughput determination of UTI pathogens can be introduced in the near future. Furthermore, the reduced cost and selectivity is an important consideration for affordable healthcare for the poor communities. This next-generation diagnostic approach can be applied to identify other pathogens like Staphylococcus and Pseudomonas, which forms the basis of another thesis work in our laboratory. An important finding of 2-methylbutanal production at several hundred micro molar to milli molar
  • 161.
    131 levels make thesebiomarkers attractive for easier detection of pathogens using simple optical and electrochemical instrumentation. First-of-its-kind molecular studies on metabolic regulation of 2-methylbutanal in Proteus not only added new details to the metabolism of this secondary metabolite but also led to rational design of LB-Ile medium for better selectivity and sensitivity. This also adds a new dimension by rationally designing appropriate medium for sensitive and selective pathogen detection using volatile or non-volatile secretory organic compounds as biomarkers. The designed medium and the yes-or-no type of method designed for futuristic instrumentation for infectious diseases has been shown to be useful in high-throughput screening and in identifying MDR types. VOCs like 2-methylbutanal are also attractive targets for modern devices like electronic nose that could be used for screening and surveillance. Such methods generally and ProteAl particularly can be useful in even detecting 2-methylbutanal in breathe of lung cancer patients either using an electronic nose or properly adapting the method developed in this work for breathe. This initial work opens up the possibility of developing new diagnostic and surveillance methods based on volatile and non-volatile organic compounds specifically released by bacteria as biomarker. When such methods for a number of commonly encountered pathogens are available, even an automated device for identification of multiple pathogens with their antibiogram can be devised and automated. Detailed metabolic investigations of such secondary or even primary metabolite biomarkers will help design selective media or media specific for identification of bacterial pathogens. We envisage that such approach will lead to new set of bacteriological media based on rational design, which will drastically bring down the cost and time for diagnosis making healthcare more affordable.
  • 162.
    132 The discoveries ofsecretion of secondary metabolites like 2-methylbutanal also open up another interesting possibility. These could have adverse effect on the host and so far this aspect has not been studied adequately, though a lot of work has been focused on virulence proteins. For example, the effect of polyketides secreted by gut bacteria on human colonic cell cycle inhibition and its possible implication has been reported. Therefore it is plausible to come across interesting pathogenic roles of these diagnostic targets and device appropriate effective intervention. It is quite possible that such biomarkers could be useful diagnostically and therapeutically.
  • 163.
    133 REFERENCES 1. A briefguide to emerging infectious diseases and zoonoses, World Helath Organisation 2014. 2. Abdullah-Sayani, A, Bueno-de-Mesquita, JM & van de Vijver, MJ 2006, ‘Technology Insight: tuning into the genetic orchestra using microarrays-limitations of DNA microarrays in clinical practice’, Nat Clin Pract Oncol., vol. 3, no. 9, pp. 501-516. 3. Alagumaruthanayagam, A, Pavankumar, AR, Vasanthamallika, TK & Sankaran, K 2009, ‘Evaluation of solid (disc diffusion)- and liquid (turbidity)-phase antibiogram methods for clinical isolates of diarrheagenic E. coli and correlation with efflux’, J Antibiot (Tokyo), vol. 62, no. 7, pp. 377-384. 4. Ali, M, Elbashier, MD, Malik, AG & Khot, AP 1998, ‘Blood stream infectious microorganisms, risk factors and mortality rate in Qatif Central Hospital’, Ann Saudi Med, vol. 18, no. 2, pp. 176-180. 5. Alonso, A, Sanchez, P & Martinez, J 2001, ‘Environmental selection of antibiotic resistance genes’, Enviorn Microbiol, vol. 3, pp. 1-9. 6. Alphus, D, Wilson & Manuela Baietto 2009, ‘Applications and Advances in Electronic-Nose Technologies’, Sensors (Basel), vol. 9, no. 7, pp. 5099–5148. 7. Aminov, R 2010, ‘A brief history of the antibiotic era: lessons learned and challenges for the future’, Front Microbiol, vol. 1, pp. 134. 8. Andre, GS, Joshua, M, Walter, Y & Edmund, MP 2002, ‘Rapid detection of pathogenic bacteria by volatile organic compound (VOC) analysis’, Proc. SPIE4575. 9. Andrej Kochevenko, Wagner L Araujo, Gregory S Maloney, Denise M Tieman, Phuc Thi Do, Mark G Taylor, Harry J Klee & Alisdair R Fernie 2012, ‘Catabolism of Branched Chain Amino Acids Supports Respiration but Not Volatile Synthesis in Tomato Fruits’, Molecular Plant, vol. 5, no. 2, pp. 366–375.
  • 164.
    134 10. Arnold, JW& Senter, SD 1998, ‘Use of digital aroma technology and SPME GC-MS to compare volatile compounds produced by bacteria isolated from processed poultry’, Journal of the Science of Food and Agriculture, vol. 78, no. 3, pp. 343–348. 11. Augusto, F, Lopes, AL & Zini, CA 2003, ‘Sampling and sample preparation for analysis of aromas and fragnances. Trends in Analytical Chemistry, vol. 22, no.3, pp. 160-169. 12. Avoidable Costs in U.S. Healthcare: The $200 Billion Opportunity from Using Medicines More Responsibly. Report by the IMS Institute for Healthcare Informatics 2013. 13. Beck, HC, Hansen, AM & Lauritsen, FR 2002, ‘Metabolite production and kinetics of branched-chain aldehyde oxidation in Staphylococcus xylosus’, Enzyme Microb. Technol., vol. 31, pp. 94–101. 14. Bekir Karlic 2004, ‘Real time bad breathes diagnosis and transmission for telemedicine’, Proceedings of International Conference on Intelligent Knowledge Systems (IKS). 15. Bentley, B & Bennett, JW 1988, ‘Biosynthesis of secondary metabolites’, In: Physiology of Industrial Fungi., Blackwell Sci. Pub. Oxford, pp. 161-183. 16. Berry, DR 1988, ‘Products of primary metabolic pathways’, Physiology of Industrial Fungi., Blackwell Sci. Pub. Oxford, pp. 130- 160. 17. Bhaskara V Chikkaveeraiah, Ashwinkumar Bhirde, Nicole Y Morgan, Henry S Eden & Xiaoyuan Chen 2012, ‘Electrochemical Immunosensors for Detection of Cancer Protein Biomarkers, ACS Nano., vol. 6, no. 8, pp. 6546–6561. 18. Borja Sanchez, Maria C Urdaci & Abelardo Margolles 2010, ‘Extracellular proteins secreted by probiotic bacteria as mediators of effects that promote mucosa–bacteria interactions’, Microbiology, vol. 156, pp. 3232–3242. 19. Braine, T 2011, ‘Race against time to develop new antibiotics’, Bulletin of the World Health Organization., vol. 89, no. 2, pp. 88-90.
  • 165.
    135 20. Brandon JUmber, Hye-Won Shin, Simone Meinardi, Szu-Yun Leu, Frank Zaldivar, Dan M Cooper & Donald R Blake 2013, ‘Gas signatures from Escherichia coli and Escherichia coli-inoculated human whole blood’, Clin Transl Med., vol. 2, pp. 13. 21. Brian P Mooney, Michael T Henzl, Jan A Miernyk & Douglas D Randall 2000, ‘The dihydrolipoyl acyltransferase (BCE 2) subunit of the plant branched-chain a-ketoacid dehydrogenase complex forms a 24-mer core with octagonal symmetry’, Protein Science, vol. 9, pp. 1334–1339. 22. Butler, KH, Reed, C & Bosker, G 2001, ‘New diagnostic modalities, alteration of drug resistance patterns and current antimicrobial treatment guidelines for the hospitals and outpatient settings In: Clinical Consensus Report’, Urinary Tract Infection. 23. Caroline Mohr O'Hara, Frances W Brenner & Michael Miller, J 2000, ‘Classification, Identification, and Clinical Significance of Proteus, Providencia, and Morganella’, Clin Microbiol Rev., vol. 13, no. 4, pp. 534–546. 24. Chen Zhang & Kenneth S Suslick 2005, ‘Colorimetric Sensor Array for Organics in Water’, J. Am. Chem. Soc., vol. 127, pp. 11548-11549. 25. Chidananda Nagamangala Kanchiswamy, Mickael Malnoy & Massimo E Maffei 2015, ‘Chemical diversity of microbial volatiles and their potential for plant growth and productivity’, Front. Plant Sci. vol. 6, article 151, pp. 1-23. 26. Christopher Coker, Carrie A Poore, Xin Li & Harry LT Mobley 2000, ‘Pathogenesis of Proteus mirabilis urinary tract infection’, Microbes and Infection, vol. 2, no. 12, pp. 1497–1505. 27. Christopher J Musto & Kenneth S Suslick 2010, ‘Differential sensing of sugars by colorimetric arrays’, Current Opinion in Chemical Biology., vol. 14, no. 6, pp. 758–766. 28. David, JR 2005, ‘Chemistry and Technology of Flavour and Fragrance’, Blackwell, UK. 29. Dennise D Dalma-Weiszhausz, Marina E Chicurel & Thomas R Gingeras 2002, ‘Microarrays and genetic epidemiology: a multipurpose tool for a multifaceted field’, Genet. Epidemiol., Genet Epidemiol., vol. 23, no. 1, pp. 4-20.
  • 166.
    136 30. Disease burdenin India: estimations and causal analysis. In: 14. NCMH background papers - burden of disease in India. New Delhi: National Commission on Macroeconomics and Health & Family Welfare, Ministry of Health, Government of India, 2005. 31. Elgaali, H & Hamilton-Kemp, TR 2002, ‘Comparison of long-chain alcohols and Other volatile compounds emitted from food-borne and related Gram positive and Gram negative bacteria’, J Basic Microbiol., vol. 42, no. 6, pp. 373-80. 32. Emily, RM, Sydnor & Trish M Perl 2011, ‘Hospital Epidemiology and Infection Control in Acute-Care Settings’, Clin Microbiol Rev., vol. 24, no. 1, pp. 141–173. 33. Erika Lea Flannery 2011, ‘Contribution of Horizontal Gene Transfer to Virulence and Antibiotic Resistance in Pathogens Transmitted in Healthcare Facilities’, PhD dissertation in Epidemiological Science, University of Michigan. 34. Ezeonu, IM, Price, DL, Simmons, RB, Crow, SA & Ahearn, DG 1994, ‘Fungal production of volatiles during growth on fiberglass’, Applied and Environmental Microbiology., vol. 60, pp. 4172-4173. 35. Fauci, AS 2001, ‘Infectious diseases: considerations for the 21st 2. Century’, Clin Infect Dis., vol. 32, pp. 675-685. 36. Frank, W 2008, ‘Cell-Based Assays for High-Throughput Screening: Methods and Protocols’, Methods in Molecular Biology., vol. 486, pp. 97-107. 37. Frederick Adzitey, Nurul Huda & Gulam Rusul Rahmat Ali 2012, ‘Molecular techniques for detecting and typing of bacteria, advantages and application to foodborne pathogens isolated from ducks’, Biotech., vol. 3, no. 2, pp. 97–107. 38. Garner, CE & Smith, S 2007, ‘Volatile organic compounds from feces and their potential for diagnosis of gastrointestinal disease’, FASEB Journal., vol. 21, no.8, pp. 1675-1688. 39. Georg Mitterer, Martin Huber, Ernst Leidinger, Claudia Kirisits, Werner Lubitz, Manfred W Mueller & Wolfgang M Schmidt 2004, ‘Microarray-Based Identification of Bacteria in Clinical Samples by Solid-Phase PCR Amplification of 23S Ribosomal DNA Sequences’, J. Clin. Microbiol., vol. 42, no. 3, pp. 1048-1057.
  • 167.
    137 40. Ginawi, I,Mohd Saleem, Mastan Sigh, AK, Vaish, I, Ahmad, VK, Srivastava, Fahad, A & Abdullah, M 2014, ‘Hospital Acquired Infections Among Patients Admitted in the Medical and Surgical Wards of a Non-Teaching Secondary Care Hospital in Northern India’, J Clin Diagn Res., vol. 8, no. 2, pp. 81–83. 41. Giske, CG, Dominique, L, Cars, MO & Carmeli, Y 2008, ‘Clinical and Economic Impact of Common Multidrug-Resistant Gram-Negative Bacilli’, Antimicrob. Agents Chemother., vol. 52, pp. 813-821. 42. Griffith, DP, Musher, DM & Itin, C 1976, ‘Urease: the primary cause of infection-induced urinary stones’, Invest. Urol., vol. 13, pp. 346–350. 43. Guentzel, MN 1996, Escherichia, Klebsiella, Enterobacter, Serratia, Citrobacter, and Proteus. In: Barron's Medical Microbiology (Barron S et al., eds.) (4th ed.). Univ of Texas Medical Branch. ISBN 0-9631172-1-1. (via NCBI Bookshelf) 44. Gus Gonzalez & Michael Stuart Bronze 2014, Proteus Infections Medication, http://emedicine.medscape.com/article/226434-medication). 45. Hancock, R 1998, ‘Resistance mechanisms in Pseudomonas aeruginosa and other nonfermentative gram- negative bacteria’, Clin Infect Dis., vol. 27, pp. 93-99. 46. Holt, JG, Krieg, NR, Sneath, PHA, Staley, JT, Williams, ST & Hensyl, WR 1994, ‘Bergey’s Manual of Determinative Bacteriology’, 9th Edition, Williams and Wilkins, Baltimore, MD, USA, pp. 184–185. 47. http://emedicine.medscape.com/article/226434-overview 48. http://www.fda.gov/Food/FoodborneIllnessContaminants/FoodborneIll nessesNeedToKnow/default.htm 49. https://mikesnexus.files.wordpress.com/2015/02/causeofdeathdevelopi ngcountries.jpg?w=676. 50. Hughes, DT & Sperandio, V 2008, ‘Inter-kingdom signalling: communication between bacteria and their hosts’, Nat Rev Microbiol., vol. 6, pp. 111–120.
  • 168.
    138 51. Ian Humphery-Smith2014, ‘Importance of Bacteriophage in Combating Hospital-Acquired Infection (HAI)’, Pharmacology & Pharmacy., vol. 5, pp. 1192-1201. 52. Ida A Casalinuovo, Donato Di Pierro, Massimiliano Coletta & Paolo Di Francesco 2006, ‘Application of Electronic Noses for Disease Diagnosis and Food Spoilage Detection’, Sensors., vol. 6, pp.1428- 1439. 53. Infectious Disease Treatments: Global Markets BCC research market forecasting 2010, (http://www.bccresearch.com/market-research/ pharmaceuticals/infectious-disease-treatments-phm061b.html, Global markets for infectious disease treatment) 54. Jan E Szulejko & Ki-Hyun Kim 2015, ‘Derivatization techniques for determination of carbonyls in air’, Trends in Analytical Chemistry., vol. 64, pp. 29–41. 55. Jason Herrington, A, Lin Zhang, B, Donald Whitaker, C, Linda Sheldonc, Junfeng & Zhangbd J 2005, ‘Optimizing a dansylhydrazine (DNSH) based method for measuring airborne acrolein and other unsaturated carbonyls’, J Environ. Monit., vol. 7, no. 10, pp. 969-976. 56. Jiangjiang Zhu, Heather D Bean, Yin-Ming Kuo & Jane E Hill 2010, ‘Fast Detection of Volatile Organic Compounds from Bacterial Cultures by Secondary Electrospray Ionization-Mass Spectrometry’, Journal of Clinical Microbiology., vol. 48, no. 12, pp. 4426–4431. 57. John CD Auria, Eran Pichersky, Andrea Schaub, Armin Hansel & Jonathan Gershenzon 2007, ‘Characterization of a BAHD acyltransferase responsible for producing the green leaf volatile (Z)-3-hexen-1-yl acetate in Arabidopsis thaliana’, Plant Journal., vol. 49, no. 2, pp. 194–207. 58. Judith AP Bons, Marja van Dieijen-Visser & Will Wodzig 2007, ‘Clinical proteomics in chronic inflammatory diseases: A review’, Proteomics. Clinical applications., vol. 1, no. 9, pp. 1123-1133. 59. Jyoti Tanwar, Shrayanee Das, Zeeshan Fatima & Saif Hameed 2014, ‘Multidrug Resistance: An Emerging Crisis’, Interdisciplinary Perspectives on Infectious Diseases., vol. 2014, pp. 1-7.
  • 169.
    139 60. Kai, M,Haustein, M, Molina, F, Petri, A, Scholz, B, Piechulla, B 2009, ‘Bacterial volatiles and their action potential’, Appl Microbiol Biot., vol. 81, no. 6, pp. 1001–1012. 61. Kamila Schmidt & Ian Podmore 2015, ‘Current Challenges in Volatile Organic Compounds Analysis as Potential Biomarkers of Cancer’, Journal of Biomarkers., vol. 2015, pp. 16. 62. Karen Abella Santo-Pietro 2006, Microbial Volatile Organic Compounds (MVOC's)’, The Environmental Reporter, vol. 4, no. 4. 63. Kell, DB, Kaprelyants, AS, Weichart, DH, Harwood, CR & Barer, MR 1998, ‘Viability and activity in readily culturable bacteria: a review and discussion of the practical issues’, Antonie Van Leeuwenhoek., vol. 73, no. 2, pp. 169-187. 64. Korpi, A 2001, Fungal volatile metabolites and biological responses to fungal exposure Ph. D Thesis: University of Kuopio, Finland 65. Krikler, MS 1953, ‘The serology of Proteus vulgaris’, Ph.D. Thesis. University of London, pp. 37. 66. Lashley, FR 2003, ‘The factors which contribute to the occurrence of emerging infectious diseases’, Biol Res Nurs., vol. 4, no. 4, pp. 258- 267. 67. Laurent, M, Amupuero, S, Zesiger, TMG & Casey 2004, ‘Screening of aroma-producing lactic acid bacteria with electronic nose’, Int Dairy J, vol. 14, pp. 846–849. 68. Leclercq, R & Courvalin, P 1991, ‘Intrinsic and unusual resistance to macrolide, lincosamide, and streptogramin antibiotics in bacteria’, Antimicrob Agents Chemother., vol. 35, pp. 1273-1276. 69. Li, X, Zhao, H, Lockatell, CV, Drachenberg, CB, Johnson, DE & Mobley, HL 2002, ‘Visualization of Proteus mirabilis within the Matrix of Urease-Induced Bladder Stones during Experimental Urinary Tract Infection’, Infect. Immun., vol. 70, pp. 389-394. 70. Lieuwe DJ Bos, Peter J Sterk & Marcus J Schultz 2013, ‘Volatile Metabolites of Pathogens: A Systematic Review’, PLoS Pathog., vol. 9, no. 5.
  • 170.
    140 71. Malik, VS1979, ‘Genetics of applied microbiology’, Advances in Genetics., vol. 20, pp. 37-126. 72. Maria Cristiana Papaleo, Riccardo Romoli, Gianluca Bartolucci, Isabel Maida, Elena Perrin, Marco Fondi, Valerio Orlandini, Alessio Mengoni, Giovanni Emiliani, Maria Luisa Tutino, Ermenegilda Parrilli, Donatella de Pascale, Luigi Michaud, Angelina Lo Giudice & Renato Fani 2013, ‘Bioactive volatile organic compounds from Antarctic (sponges) bacteria’, New Biotechnology, vol. 30, no. 6, pp. 824–838. 73. Mark A Valasek & Joyce J Repa 2005, ‘The power of real-time PCR’, Adv Physiol Educ., vol. 29, no. 3, pp. 151-159. 74. Martin, V, Andrea, B & Uwe, K 2000, ‘Hydrazine reagents as derivatizing agents in environmental analysis – a critical review’, Fresenius J Anal Chem., vol. 366, pp. 781–791. 75. Matsuyama, T, Takagi, Y, Nakagawa, Y, Itoh, H, Wakita, J & Matsushita, M 2000, ‘Dynamic aspects of the structured cell population in a swarming colony of Proteus mirabilis’, J. Bacteriol., vol. 182, no. 2, pp. 385–93. 76. Max Wynn, R, James R Davie, Jacinta L Chuang, Cynthia D Cote & David T Chuang 1998, ‘Impaired Assembly of E1 Decarboxylase of the Branched-chain -Ketoacid Dehydrogenase Complex in Type IA Maple Syrup Urine Disease’, The Journal of Biological Chemistry., vol. 273, no. 21, pp. 13110–13118. 77. Mayon-White, RT 1988, ‘An international survey of the prevalence of hospital-acquired infection’, J Hosp Infect., pp. 43–48. 78. Meenakshi Gijare 2012, ‘Effectiveness of teaching on infection control practices among health care professionals’, Sinhgad e Journal of Nursing, vol. 2, no. 2, pp. 5-9. 79. Melanie Junger, Wolfgang Vautz, Martin Kuhns, Lena Hofmann, Siobhan Ulbricht, Jorg Ingo Baumbach, Michael Quintel & Thorsten Perl 2012, ‘Ion mobility spectrometry for microbial volatile organic compounds: a new identification tool for human pathogenic bacteria’, Appl Microbiol Biotechnol., vol. 93, no. 6, pp. 2603–2614.
  • 171.
    141 80. Michael CJanzen, Jennifer B Ponder, Daniel P Bailey, Crystal K Ingison & Kenneth S Suslick 2006, ‘Colorimetric Sensor Arrays for Volatile Organic Compounds’, Anal. Chem., vol. 78, pp. 3591-3600. 81. Mireille Yvon & Liesbeth Rijnen 2001, ‘Cheese flavor formation by aminoacid catabolism’, International Dairy Journal., vol. 11, pp. 185–201. 82. Mobley, HL & Warren, JW 1987, ‘Urease-positive bacteriuria and obstruction of long-term urinary catheters’, J. Clin. Microbiol., vol. 25, pp. 2216–2217. 83. Mohsen Sohrabi, Li Zhang, Kai Zhang, Adnan Ahmetagic & Ming Q Wei 2014, ‘Volatile Organic Compounds as Novel Markers for the Detection of Bacterial Infections’, Clin Microbial., vol. 3, no. 3. 84. Muna Ahmed Mohamed El Hadi, Feng-Jie Zhang, Fei-Fei Wu, Chun-Hua Zhou & Jun Tao 2013, ‘Advances in Fruit Aroma Volatile Research’, Molecules., vol. 18, no.7, pp. 8200-8229. 85. Nicholson, JK & Lindon, JC 2008, ‘Systems biology: metabonomics’, Nature, vol. 455, pp. 1054–1056. 86. Obi, RK, Orji, NM, Nwanebu, FC, Okangba, CC & Ndubuisi, UU 2010, ‘Emerging and Re-Emerging Infectious Diseases: The Perpetual Menace’, Asian J. Exp. Biol. Sci., vol. 1, no. 2, pp. 271-282. 87. Ochman, H, Lawrence, J & Groisman, E 2000, ‘Lateral gene transfer and the nature of bacterial innovation’, Nature., vol. 405, pp. 299-304. 88. Olivier Lazcka, F, Javier Del Campo, F & Xavier Mu Noz 2007, ‘Pathogen detection: A perspective of traditional methods and biosensors’, Biosensors and Bioelectronics., vol. 22, pp. 1205–1217. 89. Pavlou, AK & Turner, AP 2000, ‘Sniffing out the truth: clinical diagnosis using the electronic nose’, Clin Chem Lab Med., vol. 38, no. 2, pp. 99-112. 90. Petr Verner 1984, ‘Photoionization detection and its application in gas chromatography’, Journal of Chromatography A, vol. 300, pp. 249–264.
  • 172.
    142 91. Pilar Fernandezde Palencia, Marta de la Plaza, M, Luz Mohedano, M, Carmen Martınez-Cuesta, Teresa Requena, Paloma LoPez & Carmen Pelaez 2004, ‘Enhancement of 2-methylbutanal formation in cheese by using a fluorescently tagged Lacticin 3147 producing Lactococcus lactis strain’, International Journal of Food Microbiology., vol. 93, pp. 335–347. 92. Ponce-de-Leon, S 1991, ‘The needs of developing countries and the resources required’, J Hosp Infect., vol. 18, pp. 376–381. 93. Pothur R Srinivas, Mukesh Verma, Yinming Zhao & Sudhir Srivastava 2002, ‘Proteomics for Cancer Biomarker Discovery’, Clinical Chemistry., vol. 48, no. 8, pp. 1160 –1169. 94. Pradeep Sahu, Neha Pinkalwar, Ravindra Dhar Dubey, Shweta Paroha, Shilpi Chatterjee & Tanushree Chatterjee 2011, ‘Biomarkers: An Emering Tool for Diagnosis of a Disease and Drug Development’, Asian J. Res. Pharma. Sci., vol. 1, no. 1, pp. 09-16. 95. Prevention of hospital-acquired infections: A practical guide. 2nd edition WHO/CDS/CSR/EPH/2002.12. 96. Quigley, MA 2006, ‘Shifting burden of disease-epidemiological transition in India’, Int J Epidemiol., vol. 35, pp. 1530-1531. 97. Rachel T Noble & Stephen B Weisberg 2005, ‘A review of technologies for rapid detection of bacteria in recreational waters’, J Water Health., vol. 3, no. 4, pp. 381-92. 98. Rauprich, O, Matsushita, M, Weijer, CJ, Siegert, F, Esipov, SE & Shapiro, JA 1996, ‘Periodic phenomena in Proteus mirabilis swarm colony development’, J. Bacteriol., vol. 178, no. 22, pp. 6525–38. 99. Reineccius, G 2006, ‘Flavor Chemistry and Technology’, 2nd ed.; CRC Press: Boca Raton, FL, USA. 100. Ryan, KJ & Ray, CG 2004, Sherris Medical Microbiology (4th ed.). McGraw Hill. ISBN 0-8385-8529-9. 101. Saranraj, P & Stella, D 2011, ‘Antibiogram of Nosocomial Infections and Its Antimicrobial Drug Resistance’, International Journal of Pharmaceutical & Biological Archives., vol. 2, no. 6, pp. 1598-1610.
  • 173.
    143 102. Schmied, Przewosnik,& Bachmann 1989, ‘Determination of traces of aldehydes and ketones in the troposphere via solid phase derivatisation with DNSH, Fresenius Z Anal Chem., vol. 335, pp. 464-468. 103. Senka Dzidic & Vladimir Bedekovic 2003, ‘Horizontal gene transfer- emerging multidrug resistance in hospital bacteria’, Acta Pharmacol Sin., vol. 24, no. 6, pp. 519-26. 104. Sheela Devi, A & Johanna Rajkumar 2013, ‘A study on antibiotic susceptibility and resistance profiles of bacterial strains isolated from patients with Urinary Tract Infection (UTI) At Kanchipuram District, Tamilnadu, India’, International Journal of Pharmacy and Pharmaceutical Sciences., vol. 5, no. 3, pp. 817-820. 105. Shneh Sethi, Ranjan Nanda & Trinad Chakraborty 2013, ‘Clinical Application of Volatile Organic Compound Analysis for Detecting Infectious Diseases’, Clin Microbiol Rev., vol. 26, no. 3, pp. 462–475. 106. Sichu Li 2014, ‘Recent Developments in Human Odor Detection Technologies’, Journal of Forensic Science & Criminology., vol. 1, no. 1, pp. 1-12. 107. Sichu, L 2009, ‘Overview of Odor Detection Instrumentation and the Potential for Human Odor Detection in Air Matrices’, Project No. 07MSR216 and 1509532.http://www.mitre.org/work/tech_papers/tech _papers_09/09_4536/09_4536.pdf. 108. Siddhesh B Shinde, Clara B Fernandes & Vandana B Patravale 2012, ‘Recent trends in in-vitro nanodiagnostics for detection of pathogens’, Journal of Controlled Release., vol. 159, no. 2, pp. 164–180. 109. Simeng Chen, Yuchao Wang & Seokheun Choi 2013, ‘Applications and Technology of Electronic Nose for Clinical Diagnosis’, Open Journal of Applied Biosensor., vol. 2, pp. 39-50. 110. Singh, TK, Drake, MA & Cadwallader, KR 2003, ‘Flavor of Cheddar Cheese: A Chemical and Sensory Perspective’, Comprehensive Reviews In Food Science And Food Safety., vol. 2, pp. 166-189. 111. Stefan Schulz & Jeroen S Dickschat 2007, ‘Bacterial volatiles: the smell of small organisms’, Nat. Prod. Rep., vol. 24, pp. 814–842.
  • 174.
    144 112. Steven PDjordjevic, Harold W Stokes & Piklu Roy Chowdhury 2013, ‘Mobile elements, zoonotic pathogens and commensal bacteria: conduits for the delivery of resistance genes in to humans, production animals and soil microbiota’, Frontire’s in microbiology., vol. 4, no. 86, pp. 1-12. 113. Storer, MK, Hibbard-Melles, K, Davis, B & Scotter, J 2011, ‘Detection of volatile Compounds produced by microbial growth in urine by selected ion flow tube mass Spectrometry (SIFT-MS)’, J Microbiol Methods., vol. 87, no. 1, pp. 111-113. 114. Sung H Lim, Jonathan W Kemling, Liang Feng & Kenneth S Suslick 2009, ‘A colorimetric sensor array of porous pigments’, Analyst., vol. 134, no.12, pp. 2453–2457. 115. Tavaria, FK, Dahl, S, Carballo, FJ & Malcata, FX 2002, ‘Amino acid catabolism and generation of volatiles by lactic acid bacteria’, J. Dairy Sci., vol. 85, pp. 2462–2470. 116. Taylor, LH, Latham, SM & Woolhouse, ME 2001, ‘Risk factors for human disease emergence’, Philos Trans R Soc Lond B Biol Sci., vol. 356, no. 1411, pp. 983-989. 117. Thorn, RM, Reynolds, DM & Greenman, J 2011, ‘Multivariate analysis of bacterial volatile compound profiles for discrimination between selected species and strains in vitro’, J Microbiol Meth., vol. 84, pp. 258-264. 118. Tikhomirov, E 1987, ‘WHO Programme for the Control of Hospital Infections’, Chemiotherapia., vol. 3, pp. 148–151. 119. Turner, N, Jones, M, Grice, K, Dawson, D Ioppolo-Armanios, M, & Fisher, S 2006, ‘δ13C of volatile organic compounds (VOC’s) in airborne samples by thermal desorption (TD-GC-IR-MS)’, Atmos. Environ., vol. 40, pp. 3381-3388. 120. Valerie Tanchou 2014, ‘Review of methods for the rapid identification of pathogens in water samples’, ERNCIP thematic area Chemical & Biological Risks in the Water Sector, Task 7, deliverable. 1, pp. 1-38.
  • 175.
    145 121. Vijayata Singh,Mohit Kamthania, Rajendra Pavan, Swati Singh & Nitin Kumar 2014, ‘Biosensor Developments: Application in crime detection’, International Journal of Engineering and Technical Research., pp. 163-166. 122. Vining, LC 1990, ‘Functions of secondary metabolites’, Annual Reviews of Microbiology., vol. 44, pp. 395-427. 123. Weise, T, Kai, M, Gummesson, A, Troeger, A, Von Reu, S, Piepenborn, S, Kosterka, F, Sklorz, M, Zimmermann, R, Francke, W & Piechulla, B 2012, ‘Volatile organic compounds produced by the phytopathogenic bacterium Xanthomonas campestris pv. vesicatoria 85-10’, Beilstein J Org Chem., vol. 8, pp. 579-96. 124. WHO report 2012, Prevention of hospital-acquired Infections, A practical guide, 2nd edition. 125. William, H & Stone, K 1958, ‘Reaction of Hydrazine with Acetic Acid at 25 degrees’, J Org Chem., vol. 23, pp. 2032–2034. 126. Wojciech Filipiak, Andreas Sponring, Maria Magdalena Baur, Anna Filipiak, Clemens Ager, Helmut Wiesenhofer, Markus Nagl, Jakob Troppmair & Anton Amann 2012, ‘Molecular analysis of volatile metabolites released specifically by Staphylococcus aureus and Pseudomonas aeroginosa’, BMC Microbiology., vol. 12, no. 113, pp. 1-16. 127. World Health Organization retrieves from http://www.who.int/csr/ sars/country/en (last assessed on 16th Jan 2012). 128. Yuguang Chi, Yanli Feng, Sheng Wen, Huixiong Lu, Zhiqiang Yu, Wenbing Zhang, Guoying Sheng, Jiamo Fua & Chi, Y 2007, ‘Determination of carbonyl compounds in the atmosphere by DNPH derivatization and LC–ESI-MS/MS detection’, Talanta., vol. 72, no.2, pp. 539–545.
  • 176.
    146 LIST OF PUBLICATIONS 1.Raju Aarthi, Raju Saranya & Krishnan Sankaran 2014, ‘2-methylbutanal, a volatile biomarker, for non-invasive surveillance of Proteus’, Appl Microbiol. Biotechnology, vol. 98, no.1, pp.445-454. 2. Raju Saranya, Raju Aarthi & Krishnan Sankaran 2015, ‘Simple and specific colorimetric detection of Staphylococcus using its volatile 2-[3-acetoxy-4,4,14-trimethylandrost-8-en-17-yl] propanoic acid in the liquid phase and head space of cultures’, Appl Microbiol Biotechnology, vol. 99, no. 10, pp. 4423-33.