This study investigates the mutagenic and genotoxic effects of the atrazine-based herbicide 'rasayanzine' on freshwater fish Channa punctatus using micronucleus and single cell gel electrophoresis assays. Fish were exposed to three sub-lethal concentrations of atrazine, revealing significant induction of micronuclei and DNA damage primarily observed on specific days of exposure. The findings highlight the utility of these assays in evaluating the genotoxic impacts of agricultural pollutants on aquatic organisms.
![environmental toxicology and pharmacology 3 1 ( 2 0 1 1 ) 314–322
available at www.sciencedirect.com
journal homepage: www.elsevier.com/locate/etap
Mutagenic and genotoxic assessment of atrazine-based
herbicide to freshwater fish Channa punctatus (Bloch) using
micronucleus test and single cell gel electrophoresis
C.D. Nwania,1
, N.S. Nagpureb
, Ravindra Kumarb,∗
, Basdeo Kushwahab
,
Pavan Kumarb
, W.S. Lakrab
a Department of Applied Biology, Ebonyi State University, PMB 053, Abakaliki, Ebonyi State, Nigeria
b National Bureau of Fish Genetic Resources (Indian council of Agricultural Research), Canal Ring Road, PO- Dilkusha, Lucknow 226 002,
UP, India
a r t i c l e i n f o
Article history:
Received 20 May 2010
Received in revised form
8 December 2010
Accepted 10 December 2010
Available online 17 December 2010
Keywords:
Atrazine
Channa punctatus
DNA damage
Genotoxicity
Micronucleus assay
Single cell gel electrophoresis
a b s t r a c t
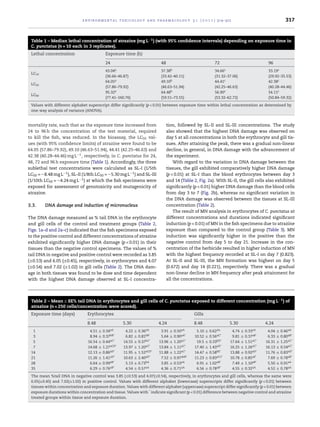
The mutagenic and genotoxic effect of ‘Rasayanzine’, an atrazine herbicide, was carried out
in fish Channa punctatus using micronucleus and single cell gel electrophoresis (SCGE) assays.
Three sub-lethal concentrations of the test material viz., SL-I (1/5th LC50 = ∼8.48 mg L−1
), SL-
II (1/8th LC50 = ∼5.30 mg L−1
) and SL-III (1/10th LC50 = ∼4.24 mg L−1
) were calculated using
LC50 value and the fish specimens were exposed to these concentrations. Erythrocyte and
gill cells were sampled on day 0, 1, 3, 5, 7, 14, 21, 28 and 35 of exposure for assessment
of micronuclei induction in blood erythrocytes and DNA damage using SCGE assay in both
blood erythrocytes and gill cells. Significant effects (p < 0.01) for both concentration and time
of exposure were observed in treated fish. Micronuclei induction in erythrocytes was highest
(8.4 mg L−1
) on day 7 of exposure. The highest level of DNA damage in the SCGE was observed
in both tissues on day 5 at all concentrations followed by gradual non-linear decline. This
study further confirmed that the micronucleus and SCGE assays are useful in determining
potential genotoxicity of water pollutants and might be appropriate as part of monitoring
program.
© 2011 Elsevier B.V. All rights reserved.
1. Introduction
The use of herbicides to control weed has been recognized
as a part of agricultural practices throughout the world.
Unfortunately, the indiscriminate use of these herbicides to
improve agricultural production and yield may have impacts
on non-target organisms especially aquatic lives and their
environment. Atrazine [6-chloro-N-ethyl-N -(1-methylethyl)-
triazine-2, 4-diamine] is one of the most commonly used
herbicides found in the rural environments though its use
∗
Corresponding author. Tel.: +91 522 2442440; fax: +91 522 2442403.
E-mail address: Ravindra.Scientist@gmail.com (R. Kumar).
1
Worked as a Post Doctoral Fellow at National Bureau of Fish Genetic Resources, Lucknow.
has been controversial (currently banned in the EU but not
in US and other countries). It is widely used in corn, sorghum,
sugarcane, pineapple crops and to some extent in landscape
vegetation. It has relatively high water solubility (32 mg L−1),
which aids in its infiltration into ground water (Orme and
Kegley, 2004). Rated as moderately toxic to aquatic species,
atrazine is mobile in the environment and is among the most
detected pesticides in streams, rivers, ponds, reservoirs and
ground water (Battaglin et al., 2003, 2009; Scrubner et al.,
2005). Atrazine concentrations of 20 g L−1 have been com-
monly detected in surface water runoff, while concentrations
1382-6689/$ – see front matter © 2011 Elsevier B.V. All rights reserved.
doi:10.1016/j.etap.2010.12.001](https://image.slidesharecdn.com/order-z-1400311363-3580-140723054549-phpapp02/85/Mutagenic-and-genotoxic-assessment-of-atrazine-based-herbicide-to-freshwater-fishChanna-punctatus-Bloch-1-320.jpg)
![environmental toxicology and pharmacology 3 1 ( 2 0 1 1 ) 314–322
available at www.sciencedirect.com
journal homepage: www.elsevier.com/locate/etap
Mutagenic and genotoxic assessment of atrazine-based
herbicide to freshwater fish Channa punctatus (Bloch) using
micronucleus test and single cell gel electrophoresis
C.D. Nwania,1
, N.S. Nagpureb
, Ravindra Kumarb,∗
, Basdeo Kushwahab
,
Pavan Kumarb
, W.S. Lakrab
a Department of Applied Biology, Ebonyi State University, PMB 053, Abakaliki, Ebonyi State, Nigeria
b National Bureau of Fish Genetic Resources (Indian council of Agricultural Research), Canal Ring Road, PO- Dilkusha, Lucknow 226 002,
UP, India
a r t i c l e i n f o
Article history:
Received 20 May 2010
Received in revised form
8 December 2010
Accepted 10 December 2010
Available online 17 December 2010
Keywords:
Atrazine
Channa punctatus
DNA damage
Genotoxicity
Micronucleus assay
Single cell gel electrophoresis
a b s t r a c t
The mutagenic and genotoxic effect of ‘Rasayanzine’, an atrazine herbicide, was carried out
in fish Channa punctatus using micronucleus and single cell gel electrophoresis (SCGE) assays.
Three sub-lethal concentrations of the test material viz., SL-I (1/5th LC50 = ∼8.48 mg L−1
), SL-
II (1/8th LC50 = ∼5.30 mg L−1
) and SL-III (1/10th LC50 = ∼4.24 mg L−1
) were calculated using
LC50 value and the fish specimens were exposed to these concentrations. Erythrocyte and
gill cells were sampled on day 0, 1, 3, 5, 7, 14, 21, 28 and 35 of exposure for assessment
of micronuclei induction in blood erythrocytes and DNA damage using SCGE assay in both
blood erythrocytes and gill cells. Significant effects (p < 0.01) for both concentration and time
of exposure were observed in treated fish. Micronuclei induction in erythrocytes was highest
(8.4 mg L−1
) on day 7 of exposure. The highest level of DNA damage in the SCGE was observed
in both tissues on day 5 at all concentrations followed by gradual non-linear decline. This
study further confirmed that the micronucleus and SCGE assays are useful in determining
potential genotoxicity of water pollutants and might be appropriate as part of monitoring
program.
© 2011 Elsevier B.V. All rights reserved.
1. Introduction
The use of herbicides to control weed has been recognized
as a part of agricultural practices throughout the world.
Unfortunately, the indiscriminate use of these herbicides to
improve agricultural production and yield may have impacts
on non-target organisms especially aquatic lives and their
environment. Atrazine [6-chloro-N-ethyl-N -(1-methylethyl)-
triazine-2, 4-diamine] is one of the most commonly used
herbicides found in the rural environments though its use
∗
Corresponding author. Tel.: +91 522 2442440; fax: +91 522 2442403.
E-mail address: Ravindra.Scientist@gmail.com (R. Kumar).
1
Worked as a Post Doctoral Fellow at National Bureau of Fish Genetic Resources, Lucknow.
has been controversial (currently banned in the EU but not
in US and other countries). It is widely used in corn, sorghum,
sugarcane, pineapple crops and to some extent in landscape
vegetation. It has relatively high water solubility (32 mg L−1),
which aids in its infiltration into ground water (Orme and
Kegley, 2004). Rated as moderately toxic to aquatic species,
atrazine is mobile in the environment and is among the most
detected pesticides in streams, rivers, ponds, reservoirs and
ground water (Battaglin et al., 2003, 2009; Scrubner et al.,
2005). Atrazine concentrations of 20 g L−1 have been com-
monly detected in surface water runoff, while concentrations
1382-6689/$ – see front matter © 2011 Elsevier B.V. All rights reserved.
doi:10.1016/j.etap.2010.12.001](https://image.slidesharecdn.com/order-z-1400311363-3580-140723054549-phpapp02/75/Mutagenic-and-genotoxic-assessment-of-atrazine-based-herbicide-to-freshwater-fishChanna-punctatus-Bloch-1-2048.jpg)
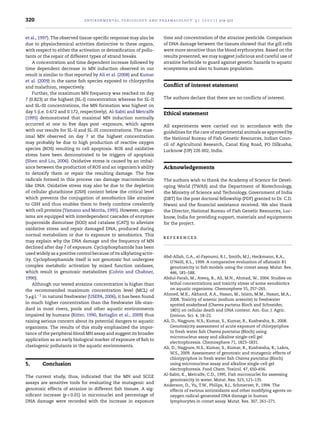
![316 environmental toxicology and pharmacology 3 1 ( 2 0 1 1 ) 314–322
test to determine the concentration of the test solution. For the
test, the atrazine was dissolved in distilled water, filtered and
added to the aquarium following the method of Pluta (1989).
The test water with herbicide was changed after every 48 h by
replacing with the fresh atrazine solution in order to coun-
terbalance decreasing herbicide concentrations because of its
hydrolysis in water. Hydrolysis of atrazine is rapid under acidic
or basic conditions but slower at neutral pH. In the defini-
tive test, a set of 10 fish specimens were randomly exposed to
each of the atrazine concentrations (viz. 25, 32, 39, 46, 53 and
60 mg L−1) and the experiment was set in triplicate to obtain
the LC50 value of the herbicide for the species. The LC50 value
of test chemical in C. punctatus was determined by probit anal-
ysis method (Finney, 1971) for 24, 48, 72 and 96 h. Based on the
96 h LC50 value, three sublethal test concentrations of atrazine
were determined and the fish specimens were exposed to
these concentrations for the assessment of its mutagenicity
and genotoxicity.
2.3. In vivo exposure experiment
The fish specimens were exposed to the three sublethal con-
centrations of test chemical in a semi-static system with the
change of test solution after every 48 h of exposure. The expo-
sure was continued up to 35 days and the tissue sampling was
done at intervals of 1, 3, 5, 7, 14, 28 and 35 days at the rate of five
specimens per sampling interval for MN and SCGE assays. The
specimens maintained in tap water separately were consid-
ered as negative control. An additional set of specimens was
separately exposed to cyclophosphamide (4 mg L−1) for pos-
itive control (Cavas and Ergene-Gözükara, 2005) in MN assay.
However, for SCGE assay, the erythrocyte and gill cells sampled
from C. punctatus on day 1 were treated ex vivo with 100 M
H2O2 for 10 min at 4 ◦C and the average value of DNA dam-
age in five specimens was used as positive control. Similarly,
the value of negative control was also based on average DNA
damage in five specimens on day 1.
On each sampling interval, ten specimens (five each for MN
and SCGE) were sampled from each atrazine treated group.
MN test was only performed on blood erythrocytes while both
blood erythrocytes and gill cells were processed for SCGE. The
blood was collected from the caudal vein of fish by puncture
technique using heparinized syringe. Sampling of the nega-
tive and positive control was also done for comparison. The
physicochemical properties of test water, namely tempera-
ture, pH, conductivity, dissolved oxygen, and total hardness
were analyzed at the beginning of experiment and on each
sampling day using standard methods (APHA, AWWA, WPCE,
2005).
2.4. Micronucleus assay
Peripheral blood samples obtained from the caudal vein were
smeared on clean, grease free, one end frosted glass slides.
Slides were fixed in methanol for 10 min and left to air-dry
at room temperature and finally stained with 6% Giemsa in
Sorenson buffer (pH 6.9) for 20 min. After dehydration through
graded alcohol and clearing in xylene, slides were mounted
in DPX (distyrene, plasticizer and xylene). From each slide,
1500 erythrocyte cells were scored under light microscope
(Leitz Wetzlar Germany, Type 307 – 083.103, oil immersion
lens, 100/1.25). The criteria used for the identification of MN
were their size smaller than one-third of the main nucleus, no
attachment with the main nucleus, and same color and inten-
sity as the main nucleus. The MN frequency was calculated as
% MN =
Number of cells containing micronuclei
Total number of cells counted
× 100
2.5. Single cell gel electrophoresis
The alkaline single cell gel electrophoresis or comet assay (CA)
was performed as a three-layer procedure (Singh et al., 1988)
with slight modifications (Klaude et al., 1996). The gill tis-
sue was removed with the help of scissor and homogenized
in ice-cold homogenization buffer [1X Hanks’ balanced salt
solution (HBSS), 20 mM EDTA, 10% dimethyl sulfoxide (DMSO),
pH 7.0–7.5] followed by centrifugation at 3000 rpm at 4 ◦C for
5 min. The cell pellet was then suspended in chilled phosphate
buffered saline (PBS). Viability of both the erythrocytes and gill
cells was evaluated by the trypan blue exclusion test method
(Anderson et al., 1994) and the cell suspensions showing via-
bility >84% were further processed for SCGE according to the
method described by Ali et al. (2008).
Two slides per specimen were prepared and 25 cells per
slide (250 cells per concentration) were scored randomly and
analyzed using an image analysis system (Komet-5.5 Kinetic
Imaging, UK) attached to a fluorescent microscope (Leica)
equipped with appropriate filters. The parameter selected for
quantification of DNA damage was percent tail DNA (% tail
DNA = 100 – % Head DNA), as determined by the software.
2.6. Statistical analysis
The percentage of MN frequency among different expo-
sure times and concentrations were compared using the
Mann–Whitney test. One-way analysis of variance (ANOVA)
was employed using SPSS software (Standard Version 11.5
SPSS Inc.) to compare the mean differences in % tail DNA, esti-
mated by SCGE assay, among different tissues, concentrations,
and exposure intervals. A p value less than 0.01 was considered
statistically significant.
3. Results
3.1. Physicochemical properties of the test water
The test water temperature varied from 24.3 to 25.5 ◦C, the
pH values ranged from 7.3 to 8.0 while the dissolved oxygen
concentration varied from 6.6 to 7.9 mg L−1 during the experi-
mental period. The conductivity of the water ranged from 260
to 300 M cm−1 while the total hardness and total alkalinity
ranged from 200 to 230 mg L−1 and from 275 to 320 as CaCO3,
respectively.
3.2. Acute toxicity bioassay and sublethal
concentrations
In the acute toxicity bioassay, a concentration dependent
increase and time dependent decrease was observed in the](https://image.slidesharecdn.com/order-z-1400311363-3580-140723054549-phpapp02/85/Mutagenic-and-genotoxic-assessment-of-atrazine-based-herbicide-to-freshwater-fishChanna-punctatus-Bloch-3-320.jpg)