Download to read offline
![using standard referenced rRNA gene as controls. All these unresolved
issues are preventing applicability of present 16S rRNA assays in quan-
titative diagnostic protocols.
The novelty of 16S rRNA qPCR assay described herein covers changes
in a) assay design, b) assay validation, and c) assay applicability. Assay
design was adapted to satisfy the needs for shorter qPCR (Liu et al.,
2012). These “direct” PCR assays (no nucleic acid isolation) are saving
significant turnaround time, obtaining final laboratory results faster.
Assay validation was done using well-documented conserved 16S
rRNA gene segments, surrounding V3 region of 16S rRNA gene
(Clifford et al., 2012). Primer candidates, listed in Supplementary
Table 2, are tested to satisfy 2 criteria: a) no presence of signal in the
negative control and b) preservation of same limits of detection
(LoDs), as previously reported by equivalent assays (Clifford et al.,
2012; Liu et al., 2012; Nadkarni et al., 2002). As a result, a new reverse
primer was discovered, completely eliminating “previously reported
contamination-like priming” in the absence of unintended targets
(Clifford et al., 2012; Huys et al., 2008; Liu et al., 2012; Mori et al.,
2014; Nadkarni et al., 2002). The novel hybridization probe was suc-
cessfully added for the first time, thus allowing assay compatibility
with hybridization-based diagnostic qPCR chemistry (TaqMan like).
This chemistry is presented in the majority of molecular in vitro diag-
nostic (IVD) clinical assays today. Overall, these changes are allowing
new applicability: semiquantitative estimations of total bacterial load
present in complex bacterial flora could be recorded and reported on a
routine basis, for the first time.
2. Materials and methods
The performance of new assay was tested on 500 liquid and 50
solid stool specimens, using crude “stool lysate” (glass beads lysis proto-
col, see below). For precise analytical quantification, a subset of stool
samples (n = 50) was chosen, and total nucleic acid was isolated.
Both crude lysate and nucleic acid isolation protocols were done
in parallel. Comparative evaluation with Nadkarni's assay (Zemanick
et al., 2010) was done on a subset of samples (n = 20). Correlation
analysis between quantification of total anaerobic bacteria by classical
serial dilution–plating count methods versus a 16S rRNA qPCR assay
was performed.
2.1. Stool samples
Our sample study group was represented by 500 liquid submitted
for detection of Clostridium difficile and 50 formed stools used for quan-
titative stool culture, collected from January 2014 to October 2014. For
measurements of wet stool mass used in the PCR assay, 49 stool samples
(from the collection of 550) were chosen by simple random sampling
method and processed as described below.
2.2. Stool swabbing and wet mass measurements
BBL Culture Swabs (BD, Franklin Lakes, New Jersey, USA) for collec-
tion and transport system, LQ Stuart (n = 49), were uniquely labelled
and measured before use, with an analytical precision of b1 mg. After
stool swabbing (full protocol presented in GeneOhm™ Cdiff Assay Man-
ual (Anon, 2014a) and in sample processing segment of methods),
swabs were closed and remeasured. The difference in mass, before
and after swabbing, was recorded for each sample.
2.3. Sample processing
Swabs were transferred into 1 mL of TE buffer (Tris-EDTA, 100X So-
lution [Molecular Biology], Fisher BioReagents) and mixed by vortexing.
For quantitative anaerobic culture, the resulting solutions were serially
diluted 100- to 10,000-fold. Fifty microliters of each dilution was plated
on Columbia blood agar and incubated 2 days under anaerobic
conditions at 37 °C, submitted to colony counts. For crude lysate direct
qPCR, the working protocol was as described in BD GeneOhm™ Cdiff
Assay Manual (Anon, 2014a). Briefly, approximately 15 mg of stool ma-
terial was diluted in 1 mL of TE buffer and vortexed for 5 min. Twenty
microliters of material was transferred into 100 μL of TE buffer contain-
ing 50-μL volume of glass beads (0.1 mm, Cell Disruption media; Scien-
tific Industries, New York, NY, USA). After vortexing for 5 min and
heating at 95 °C for 5 min, the tube was cooled down, and 3 μL was
added directly into the PCR assay. For isolation of nucleic acids from
stool, the same material equivalent was submitted to EazyMag
(Biomerieux, Saint-Laurent, Quebec, Canada) (Anon, 2014b), following
stool isolation protocol (100 μL input, 100 μL elute output). Ten-fold se-
rial dilutions of nucleic acid elute were used to illustrate qPCR efficacy
performance of different primer sets.
2.4. Primers and probes for qPCR
Nadkarni's 16S universal assay was performed (Nadkarni et al.,
2002), using subsequent published modifications (Liu et al., 2012;
Wang and Qian, 2009), based on compilation of new sequence data:
Forward variant 2: CCTAYGGGRBGCASCAG;
Forward variant 3: CCTACGGGDGGCWGCA;
Reverse variant 2; GGACTACHVGGGTWTCTAAT;
Reverse variant 3: GGACTACHVGGGTMTCTAAATC;
and (516 probe) TGCCAGCAGCCGCGGTAATAC.
Our 16S qPCR assay originated from work described by Clifford et al.
(2012). The new components of our assay are a) new hybridization
probe; b) new reverse primer; and c) new PCR conditions, thus allowing
TaqMan-like chemistry and preventing self-priming/mispriming
events, even at low PCR annealing temperatures. The details of the
primer/probe sequence motifs are summarised on Fig. 3. The amplicon
spans 330–528 bp region of rRNA gene, with the reverse primer over-
lapping with the hybridization probe region of Nadkarni's assay. Clifford
assay was originally designed to work with fluorescent intercalating dye
but produced significant product in assays lacking template (Clifford
et al., 2012). Whilst exploring in silico primer coverage in this region,
we realised that nonstringent search criteria including 3–4 permissive
mismatches in primer binding region, with 3–4 nucleotides long region
at 3′ end, characterised by 100% sequence identity, might generate a
functional/applicable assay. Therefore, we gradually modified the
primers (by systematic trimming the 3′ region) until negative controls
produced no detectable PCR product even at 50 °C PCR annealing tem-
peratures, whilst still preserving similar LoDs compared with previous
assays. In addition, the probe was adjusted, resulting in the shortest
16S universal rRNA PCR assay reported so far. Controls for qPCR inhibi-
tion were performed in all reactions, as previously described (Brukner et al.,
2013). An AT clamp/tag was added at the 5′ end of forward and reverse
primers to increase relative fluorescence unit (RFU) signal (Afonina et al.,
2007). The exact sequence of our primers and probes is presented herein,
whilst relative positions versus E. coli referenced genome are presented in
Fig. 3: Forward P: 5-AATAAATCATAAACTCCTACGGGAGGCAGCAGT-3; re-
verse P: 5-AATAAATCATAACCTAGCTATTACCGCGGCTGCT-3; and probe:
5-/56-FAM/CGGCTAACTMCGTGCCAG/3IABkFQ/-3.
2.5. PCR assay and cycling conditions
Three microliters of nucleic acid elute or crude lysis material was
added into 17 μL of total volume mix (QuantiNova Probe PCR master;
Qiagen, Toronto, Ontario, Canada), following concentration of primer/
probe and cycling condition recommendations from the manufacturer
(Anon, 2014c), except that annealing temperature was significantly
lower at 50 °C. The Cp values were calculated using default parameters
of software provided by the real-time PCR instrument manufacturers
(LC 480 II; Roche). Results were available at 2.5 hours after assembly
of the PCR.
2 I. Brukner et al. / Diagnostic Microbiology and Infectious Disease xxx (2015) xxx–xxx
Please cite this article as: Brukner I, et al, Assay for estimating total bacterial load: relative qPCR normalisation of bacterial load with associated
clinical implications, Diagn Microbiol Infect Dis (2015), http://dx.doi.org/10.1016/j.diagmicrobio.2015.04.005](https://image.slidesharecdn.com/2c37c418-5cf4-4f59-81c7-a2bb2f99974c-160926004136/85/Assay-for-estimating-total-bacterial-load-relative-qPCR-normalisation-of-bacterial-load-with-associated-clinical-implications_2015_Diagnostic-Microbio-1-2-320.jpg)
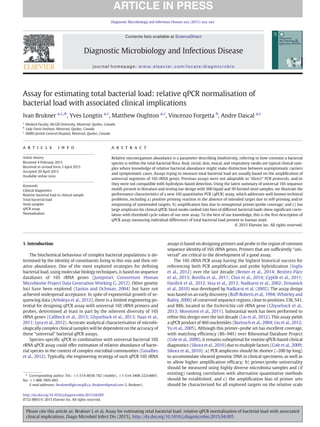
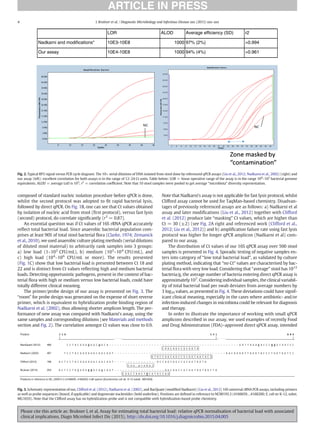
![3. Results
The quantity of stool material attached to the swab during “typical”
swabbing process had an average value and SD of 16.5 (±9.6) mg
(Table 1). The values present on Table 1 inherently reflect variability
in swabbing techniques, superimposed over variations of the stool con-
sistency and/or water content.
Using average stool mass associated with swabbing (Table 1) and
factor of sample dilutions (GeneOhm™ C. diff Assay Manual), we calcu-
lated that approximately 10 μg of faecal material was entering into a sin-
gle qPCR. Mass variability between samples is presented on Fig. 1A on
x-axis, whilst the total bacterial load, as measured by our assay, is pre-
sented using Ct values on y-axis. The 2 variables produced linear corre-
lation coefficient of R2
= −0.04, P = 0.59, indicating that there is no
discernable relationship between fluctuations of these variables. Obvi-
ously, variations in total bacterial load are superimposed on mass varia-
tions and are influenced by multiple additional factors not accounted for
in our analysis; for instance, effects of antibiotics and other medications
and concurrent infections are amongst the strongest determinants of
gastrointestinal flora (Song et al., 2013).
The results of the qPCR assay could be affected by differences in sam-
ple preparation or processing. The first protocol tested by us was
Fig. 1. Comparison of bacterial load measurement techniques. (A) Small variation of input in stool sample mass during regular swabbing is presented on x-axis (variable mass of
stool entering sample buffer), and corresponding Ct values of our 16S rRNA universal qPCR assay, presented on y-axis (R2
= −0.04, P = 0.59, from linear regression [blue line]; grey
area reflects 95% confidence interval of the smooth). Data do not show any detectable correlation. (B) Ct values from quick lysis of stool (using glass beads, vortexing, and heating at
95 °C for 5 min) presented on x-axis versus Ct values after DNA was isolated from the same mass equivalent of input material, using EazyMag (Biomerieux) total nucleic acid isolation
procedure, presented on y-axis (R2
= 0.80, P = 6.4e-8, from linear regression [blue line]; grey area reflects 95% confidence interval of the smooth). (C) Boxplots of number of anaerobic
bacteria in liquid stool sample per mass equivalent of 10 μg of stool are presented as interindividual binned total bacterial counts, measured by bacterial counting plate method (bins on
x-axis) versus Ct values of our 16S rRNA PCR assay (same mass equivalent of 10 μg of stool) done with fast stool swab lysis protocol (for details, see Materials and methods section), on
y-axis (Ct values above 18 have low bacterial load and should be considered as samples with strongly reduced micro flora). Wilcoxon test showed the following P values for binned bac-
terial counts versus Ct values: 0–102
versus 102
–104
, P = 1.111e-05; 0–102
versus 104
–106
, P = 3.837e-05; and 102
–104
versus 104
–106
, P = 0.1467. Individual points are also plotted.
Each boxplot depicts the range of binned data where the internal line is the median value and the boundaries of the box are the first and third quartiles. Whisker extends from edge of box
to 1.5 times the interquartile range.
3I. Brukner et al. / Diagnostic Microbiology and Infectious Disease xxx (2015) xxx–xxx
Please cite this article as: Brukner I, et al, Assay for estimating total bacterial load: relative qPCR normalisation of bacterial load with associated
clinical implications, Diagn Microbiol Infect Dis (2015), http://dx.doi.org/10.1016/j.diagmicrobio.2015.04.005](https://image.slidesharecdn.com/2c37c418-5cf4-4f59-81c7-a2bb2f99974c-160926004136/85/Assay-for-estimating-total-bacterial-load-relative-qPCR-normalisation-of-bacterial-load-with-associated-clinical-implications_2015_Diagnostic-Microbio-1-3-320.jpg)
![do not illustrate amplification bias of primers (Liu et al., 2012) when
multiple similar targets are present in the same reaction tube.
Recently, new Qiagen qPCR C. difficile assays was FDA approved of-
fering absolute quantitative values of ToxB concentration. It remains
to be validated how absolute versus relative quantification will improve
clinical value of laboratory data. Some researchers (Dionne et al., 2013)
had found relation between clinical disease status and absolute quantity
of pathogen (Leslie et al., 2012), but the exact correlation between Ct
values and clinical disease severity is still unclear. Relative quantifica-
tion of bacteria from samples with diverse and complex flora is not
part of clinical laboratory routine, but current technological conditions
now permit the possibility to measure relative abundance of bacteria
and exploring its clinical impact.
Acknowledgments
This work evolved through constant intellectual challenge from
R&D team from Focus Diagnostics USA. The authors want to thank
McGill Commercialisation office (Nadia Nour) and Alain Dumont
for preserving continual applicability focus during developmental
phase of the project. We also thank our colleagues in the Department
of Diagnostic Medicine at the Jewish General Hospital (Dr Elizabeth
MacNamara, Stacy, Coleen, Dipika, and Kellee) for their valued organisa-
tion and technical assistance.
Appendix A. Supplementary data
Supplementary data to this article can be found online at http://dx.
doi.org/10.1016/j.diagmicrobio.2015.04.005.
References
Afonina I, Ankoudinova I, Mills A, Lokhov S, Huynh P, Mahoney W. Primers with 5′ flaps
improve real-time PCR. Biotechniques 2007;43(6). [p. 770, 772, 774].
. http://www.bd.com/resource.aspx?IDX=17953 BD GeneOhm™ Cdiff Assay; 2014a.
. http://www.biomerieux.ca NucliSENS® easyMAG®; 2014b.
. http://www.qiagen.com/ca/resources/ QuantiNova Probe PCR Handbook; 2014c.
. http://www.focusdx.com/pdfs/pi/US/MOL2975.pdf Simplexa™ C. difficile Universal Di-
rect; 2014d.
Arboleya S, et al. Deep 16S rRNA metagenomics and quantitative PCR analyses of the pre-
mature infant fecal microbiota. Anaerobe 2012;18(3):378–80.
Bartosch S, et al. Characterization of bacterial communities in feces from healthy elderly vol-
unteers and hospitalized elderly patients by usingreal-time PCR and effects of antibiotic
treatment on the fecal microbiota. Appl Environ Microbiol 2004;70(6):3575–81.
Bemer P, et al. Evaluation of 16S rRNA Gene PCR sensitivity and specificity for diagnosis of
prosthetic joint infection: a prospective multicenter cross-sectional study. J Clin
Microbiol 2014;52(10):3583–9.
Benítez-Páez A, Álvarez M, Belda-Ferre P, Rubido S, Mira A, Tomás I. Detection of transient
bacteraemia following dental extractions by 16S rDNA pyrosequencing: a pilot study.
PLoS One 2013;8(3):e57782.
Bergeron MG. Revolutionizing the practice of medicine through rapid (b1 h) DNA-based
diagnostics. Clin Invest Med 2008;31(5):E265–71.
Bonilla H, et al. Rapid diagnosis of septic arthritis using 16S rDNA PCR: a comparison of 3
methods. Diagn Microbiol Infect Dis 2011;69(4):390–5.
Brukner I, et al. Significantly improved performance of a multitarget assay over a com-
mercial SCCmec-based assay for methicillin-resistant Staphylococcus aureus screen-
ing: applicability for clinical laboratories. J Mol Diagn 2013;15(5):577–80.
Bustin SA, et al. The MIQE guidelines: minimum information for publication of quantita-
tive real-time PCR experiments. Clin Chem 2009;55(4):611–22.
Callbeck CM, et al. Improving PCR efficiency for accurate quantification of 16S rRNA
genes. J Microbiol Methods 2013;93(2):148–52.
Choi SH, et al. Usefulness of a direct 16S rRNA gene PCR assay of percutaneous biopsies or
aspirates for etiological diagnosis of vertebral osteomyelitis. Diagn Microbiol Infect
Dis 2014;78(1):75–8.
Clarke JS. Bacteriology of the gut and its clinical implications. West J Med 1974;121(5):
390–403.
Clifford RJ, Milillo M, Prestwood J, Quintero R, Zurawski DV, Kwak YI, et al. Detection of
bacterial 16S rRNA and identification of four clinically important bacteria by real-
time PCR. PLoS One 2012;7(11):e48558.
Cole JR, et al. The Ribosomal Database Project: improved alignments and new tools for
rRNA analysis. Nucleic Acids Res 2009;37(Database issue):D141–5.
Cyplik P, et al. Relative quantitative PCR to assess bacterial community dynamics during
biodegradation of diesel and biodiesel fuels under various aeration conditions.
Bioresour Technol 2011;102(6):4347–52.
Dionne LL, et al. Correlation between Clostridium difficile bacterial load, commercial real-
time PCR cycle thresholds, and results of diagnostic tests based on enzyme immuno-
assay and cell culture cytotoxicity assay. J Clin Microbiol 2013;51(11):3624–30.
Ghyselinck J, Pfeiffer S, Heylen K, Sessitsch A, De Vos P. The effect of primer choice and
short read sequences on the outcome of 16S rRNA gene based diversity studies.
PLoS One 2013;8(8):e71360.
Gosalbes MJ, et al. Metagenomics of human microbiome: beyond 16s rDNA. Clin
Microbiol Infect 2012;18(Suppl. 4):47–9.
Haas BJ, et al. Chimeric 16S rRNA sequence formation and detection in Sanger and 454-
pyrosequenced PCR amplicons. Genome Res 2011;21(3):494–504.
Hardick J, et al. Identification of bacterial pathogens in ascitic fluids from patients with
suspected spontaneous bacterial peritonitis by use of broad-range PCR (16S PCR)
coupled with high-resolution melt analysis. J Clin Microbiol 2012;50(7):2428–32.
Huys G, et al. Coamplification of eukaryotic DNA with 16S rRNA gene-based PCR primers:
possible consequences for population fingerprinting of complex microbial communi-
ties. Curr Microbiol 2008;56(6):553–7.
Inglis GD, et al. Molecular methods to measure intestinal bacteria: a review. J AOAC Int
2012;95(1):5–23.
Insa R, et al. Systematic use of universal 16S rRNA gene polymerase chain reaction (PCR)
and sequencing for processing pleural effusions improves conventional culture tech-
niques. Medicine (Baltimore) 2012;91(2):103–10.
Jumpstart Consortium Human Microbiome Project Data Generation Working, G. Evalua-
tion of 16S rDNA-based community profiling for human microbiome research. PLoS
One 2012;7(6):e39315.
Leslie JL, et al. Role of fecal Clostridium difficile load in discrepancies between toxin tests
and PCR: is quantitation the next step in C. difficile testing? Eur J Clin Microbiol Infect
Dis 2012;31(12):3295–9.
Liu CM, Aziz M, Kachur S, Hsueh P-R, Huang Y-T, Keim P, et al. BactQuant: an enhanced
broad-coverage bacterial quantitative real-time PCR assay. BMC Microbiol 2012;12:56.
Lyra A, et al. Comparison of bacterial quantities in left and right colon biopsies and faeces.
World J Gastroenterol 2012;18(32):4404–11.
Mori H, et al. Design and experimental application of a novel non-degenerate universal
primer set that amplifies prokaryotic 16S rRNA genes with a low possibility to ampli-
fy eukaryotic rRNA genes. DNA Res 2014;21(2):217–27.
Morotomi N, et al. Evaluation of intestinal microbiotas of healthy Japanese adults and ef-
fect of antibiotics using the 16S ribosomal RNA gene based clone library method. Biol
Pharm Bull 2011;34(7):1011–20.
Nadkarni MA, et al. Determination of bacterial load by real-time PCR using a broad-range
(universal) probe and primers set. Microbiology 2002;148(Pt 1):257–66.
Philipp S, et al. Obstacles of multiplex real-time PCR for bacterial 16S rDNA: primer
specifity and DNA decontamination of Taq polymerase. Transfus Med Hemother
2010;37(1):21–8.
Ruff-Roberts AL, Kuenen JG, Ward DM. Distribution of cultivated and uncultivated
cyanobacteria and Chloroflexus-like bacteria in hot spring microbial mats. Appl Envi-
ron Microbiol 1994;60(2):697–704.
Santos SR, Ochman H. Identification and phylogenetic sorting of bacterial lineages with
universally conserved genes and proteins. Environ Microbiol 2004;6(7):754–9.
Sikora A, et al. Detection of increased amounts of cell-free fetal DNA with short PCR
amplicons. Clin Chem 2010;56(1):136–8.
Song C, et al. Diversity analysis of biofilm bacteria on tracheal tubes removed from
intubated neonates. Zhonghua Er Ke Za Zhi 2013;51(8):602–6.
Vandesompele J, De Paepe A, Speleman F. Elimination of primer-dimer artifacts and geno-
mic coamplification using a two-step SYBR green I real-time RT-PCR. Anal Biochem
2002;303(1):95–8.
Wang Y, Qian PY. Conservative fragments in bacterial 16S rRNA genes and primer design
for 16S ribosomal DNA amplicons in metagenomic studies. PLoS One 2009;4(10):
e7401.
Whiteley AS, Bailey MJ. Bacterial community structure and physiological state within an
industrial phenol bioremediation system. Appl Environ Microbiol 2000;66(6):
2400–7.
Yu Y, et al. Group-specific primer and probe sets to detect methanogenic communities
using quantitative real-time polymerase chain reaction. Biotechnol Bioeng 2005;
89(6):670–9.
Zemanick ET, Wagner BD, Sagel SD, Stevens MJ, Accurso FJ, Harris JK. Reliability of quan-
titative real-time PCR for bacterial detection in cystic fibrosis airway specimens. PLoS
One 2010;5(11):e15101.
6 I. Brukner et al. / Diagnostic Microbiology and Infectious Disease xxx (2015) xxx–xxx
Please cite this article as: Brukner I, et al, Assay for estimating total bacterial load: relative qPCR normalisation of bacterial load with associated
clinical implications, Diagn Microbiol Infect Dis (2015), http://dx.doi.org/10.1016/j.diagmicrobio.2015.04.005](https://image.slidesharecdn.com/2c37c418-5cf4-4f59-81c7-a2bb2f99974c-160926004136/85/Assay-for-estimating-total-bacterial-load-relative-qPCR-normalisation-of-bacterial-load-with-associated-clinical-implications_2015_Diagnostic-Microbio-1-6-320.jpg)

This document describes the development and validation of a new quantitative PCR (qPCR) assay to estimate total bacterial load in stool samples. 1) The assay targets a conserved region of the 16S rRNA gene using new primers and a probe to generate a shorter amplicon compatible with clinical diagnostics. 2) Testing on 500 liquid and 50 solid stool samples showed the assay accurately measured total bacterial load compared to culture-based methods. 3) The new assay addresses previous issues with non-specific priming and amplification bias, and provides a standardized method for quantifying total bacteria in complex clinical samples.


