The document outlines the national conference titled 'Trends & Challenges of Civil Engineering in Today’s Transforming World' organized by the Civil Engineering Department of S. N. Patel Institute of Technology & Research Centre on March 29, 2014. It emphasizes the role of civil engineering in socio-economic development and aims to address sustainability challenges in the field. The conference brings together academicians, students, and professionals to collaborate and discuss advancements and solutions in civil engineering.


![ISBN: 978-81-929339-0-0
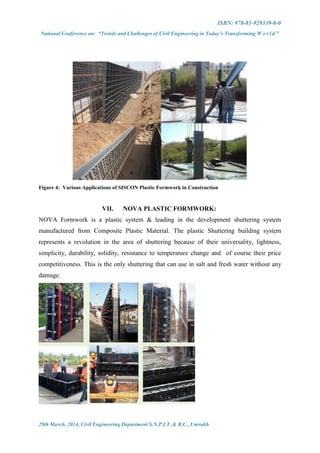
National Conference on: “Trends and Challenges of Civil Engineering in Today’s Transforming W o r l d ”
29th March, 2014, Civil Engineering Department S.N.P.I.T. & R.C., Umrakh
Source: - www.efcoform.com, A.P.C. Herington
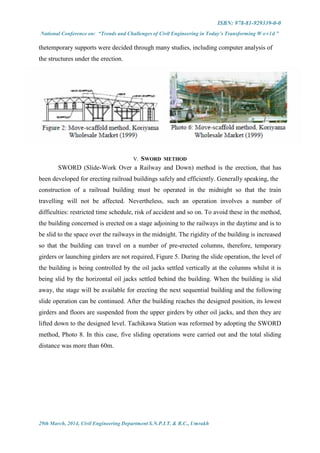
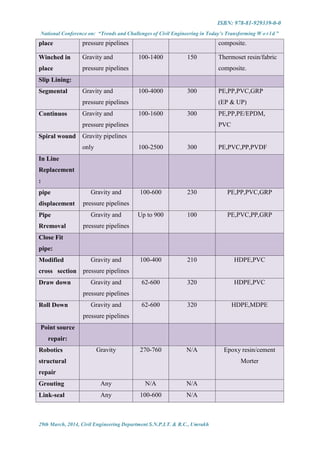
VII. CONCLUSION
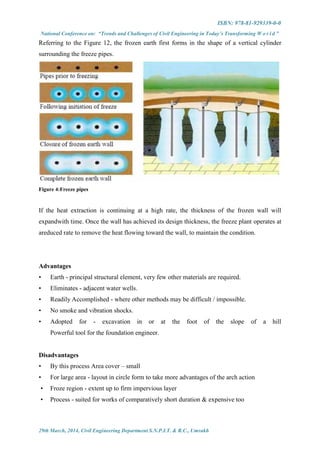
With the invention of slip forming technique and due to speedier completion of work by
the technique, there are substantial savings in cost in terms of wages and interest. This
technique has no comprises against quality control and Homogeneity of structure.
The cost saving will not appear automatically just because slip forming has been used.
This technique has a lot of scope for improvement. But it can be adapted for tall structure.
Thus a slip form system involves:-
ACKNOWLEDGMENT
The Authors thankfully acknowledge to Dr. C. L. Patel, Chairman, Charutar Vidya Mandal,
Er.V.M.Patel, Hon.Jt. Secretary, Charutar Vidya Mandal, Mr. Yatinbhai Desai, Jay Maharaj
construction, Dr. F.S.Umrigar, Principal, B.V.M. Engineering College, Dr. L.B.Zala, Head
and Professor, Civil Engineering Department, Dr. A. K. Verma, Head and Professor,
Structural Engineering Department, B.V.M. Engineering College, Vallabh Vidyanagar,
Gujarat, India for their motivations and infrastructural support to carry out this research.
REFERENCES
[1] Anon. 1978. “Key to courthouse puzzle.” Eng. News-Rec., 20021, 26–27.
[2] Betterham R. G. 1980. Slip-form concrete, Longman, New York.
[3] Halpin D. W. and Riggs L. S. 1992. Planning and analysis of construction operations, Wiley, New York
[4] Hanna, A. S. 1998. Concrete formwork systems, Marcel Dekker, New York.
[5] Peurifoy R. L., and Oberlander G. D. 1996. Formwork for concrete structures, 3rd Ed., McGraw-Hill, New
York
[6] Pruitt R., Oberlander G. 2000. Concrete construction, 1st
Ed., McGraw-Hill, April, 32(4):345-349.
[7] www.Slipforminternational.com
[8] www.rexon.com
[9] www.neruformwork.com
[10]www.dokaformwork.com
[11]www.l&tskilledformingsystem.co.in](https://image.slidesharecdn.com/fullpaperproceeding-140331060233-phpapp02/85/Full-paper-proceeding-34-320.jpg)
![ISBN: 978-81-929339-0-0
National Conference on: “Trends and Challenges of Civil Engineering in Today’s Transforming W o r l d ”
29th March, 2014, Civil Engineering Department S.N.P.I.T. & R.C., Umrakh
[12]www.masterbuilders.com
[13]www.google.co.in
[14]www.lagram.com
[15]www.Wikipedia.com](https://image.slidesharecdn.com/fullpaperproceeding-140331060233-phpapp02/85/Full-paper-proceeding-35-320.jpg)


![ISBN: 978-81-929339-0-0
National Conference on: “Trends and Challenges of Civil Engineering in Today’s Transforming W o r l d ”
29th March, 2014, Civil Engineering Department S.N.P.I.T. & R.C., Umrakh
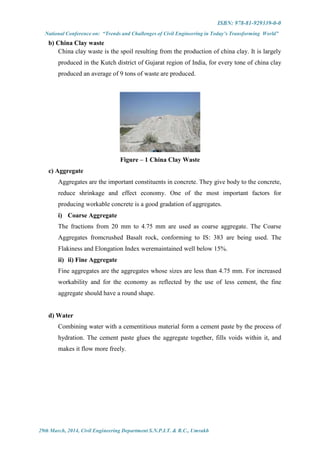
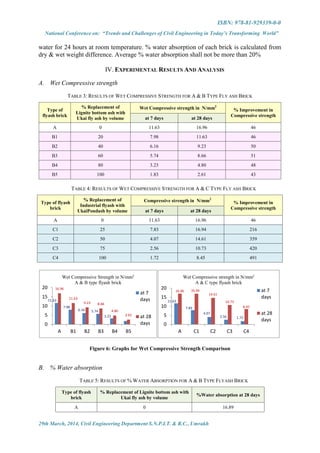
III. CASE STUDY:
Ribloc technology is used in many countries. In January 1994 Northridge earthquake severely
damaged the trunk sewer system of Santa Monica, USA. This resulted in one of this largest
sewer rehabilitation project in USA. Number of technologies including CIPP and Rib Loc
were tried. After the tremendous success of Ribloc in numerous projects, the city council of
Santa Monica decided award future projects to Ribloc on the basis of negotiations.
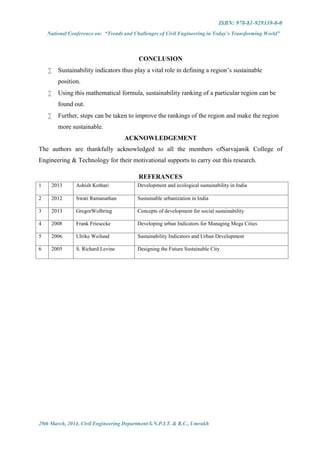
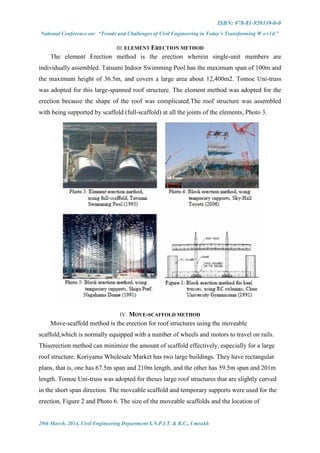
IV. CONCLUSIONS
Within a short span of 5 to 6 years, the awareness of Trenchless Technology in India is quite
significant. With conch progressive adoption of Trenchless technology in India, new
equipment and development of new materials will follow which will revolutionize the
construction industry and benefit the society. However, many planners, designers and
engineers are not yet accustomed to using them. Hence, there is a need for further
technological refinement , better information dissemination, and greater public awareness and
understanding regarding appropriate use of Trenchless technology and its contribution to
environmentally sustainable urban development. It is hoped that seminars on this newer
technology will be encouraged which will promote greater awareness in adoption of this new
technology for the development and management of the underground utilities.
ACKNOWLEDGMENT
The Authors thankfully acknowledge to Dr. C. L. Patel, Chairman, Charutar Vidya Mandal,
Er.V.M.Patel, Hon. Jt. Secretary, Charutar Vidya Mandal, Mr. Yatinbhai Desai, Jay Maharaj
construction, Dr. A. K. Verma, Head & Professor, Structural Engineering Department, Dr. B.
K. Shah, Associate Professor, Structural Engineering Department, B.V.M. Engineering
College, Vallabh Vidyanagar, Gujarat, India for their motivations and infrastructural support
to carry out this research.
REFERENCE
[1] Magazine of Civil engineering & construction review.
[2] Brig. D.K. Gunjal, (retd), consulting Engr, Banglore.
[3] T. Shivaraman, Chief Executive – Technology & D. Arivalagan, G.M –Technology, Shriram PPR
Technology Pvt. Ltd., Chennai.
[4] International seminar on “Underground Utility Infrastructure - Development and Management “ held
at Bangaloreaka, on February 10-11-2003, organized jointly by IndSTT, CIDC, BAI (Karnataka Centre) &
Karnataka state.](https://image.slidesharecdn.com/fullpaperproceeding-140331060233-phpapp02/85/Full-paper-proceeding-42-320.jpg)


![ISBN: 978-81-929339-0-0
National Conference on: “Trends and Challenges of Civil Engineering in Today’s Transforming W o r l d ”
29th March, 2014, Civil Engineering Department S.N.P.I.T. & R.C., Umrakh
ACKNOWLEDGMENT
The Authors thankfully acknowledge to Dr. C. L. Patel, Chairman, Charutar Vidya Mandal,
Er.V.M.Patel, Hon. Jt. Secretary, Charutar Vidya Mandal, Mr. Yatinbhai Desai, Jay Maharaj
construction, Dr. F.S.Umrigar, Principal, B.V.M. Engineering College, Dr. L.B.Zala, Head
and Professor, Civil Engineering Department, Dr. A. K. Verma, Head and Professor,
Structural Engineering Department, B.V.M. Engineering College, Vallabh Vidyanagar,
Gujarat, India for their motivations and infrastructural support to carry out this research.
REFERENCE
[1] Concrete Technology by M.S.Shetty
[2] Cement & Concrete Association of New Zealand Bulletin
[3] Cement Concrete & Aggregate Australia Bulletin
[4] www.concrete.net.au
[5] www.wikipedia.org
[6] www.google.co.in](https://image.slidesharecdn.com/fullpaperproceeding-140331060233-phpapp02/85/Full-paper-proceeding-52-320.jpg)


![ISBN: 978-81-929339-0-0
National Conference on: “Trends and Challenges of Civil Engineering in Today’s Transforming W o r l d ”
29th March, 2014, Civil Engineering Department S.N.P.I.T. & R.C., Umrakh
Horizontal casting of 100m3
slab using poker vibrator:
• Acceleration exposure 3.4m/s2
equaling a maximum exposure time of roughly 8
hours.
• No problem as the casting time was 7 hours and 46 minutes and 3-4 workers carried
the vibration load.
V. CONCLUSION
SCC with high workability, proper strength, and adequate durability can be produced
using locally available materials.
Attention must be paid to formwork, segregation, the air-void system, and shrinkage.
Self-Compacting Concrete is considered to be the most hopeful building material for
the expected innovative changes on the work site.
Alternative powders may be introduced without negative effect on concrete properties.
The reduction in number of un-healthy lifts is the most significant improvement to the
working environment from using SCC- The noise and vibration reduction is also nice.
ACKNOWLEDGMENT
The Authors thankfully acknowledge to Dr. C. L. Patel, Chairman, Charutar Vidya Mandal,
Er.V.M.Patel, Hon. Jt. Secretary, Charutar Vidya Mandal, Mr. Yatinbhai Desai, Jay Maharaj
construction, Dr. A. K. Verma, Head & Professor, Structural Engineering Department, Dr. B.
K. Shah, Associate Professor, Structural Engineering Department, B.V.M. Engineering
College, Vallabh Vidyanagar, Gujarat, India for their motivations and infrastructural support
to carry out this research.
REFERENCES
[1] Byen.wikipedia.org
[2] Hajime O. and Masahiro O. (2003) “Journal of Advanced Technology”
[3] M.S. SHETTY “Concrete Technology”, S. Chand and company ltd.
[4] www.google.com
[5] www.yotube.com
[6] www.wikipedia.com
[7] Seminasprojects.com/s/SCC-ppt](https://image.slidesharecdn.com/fullpaperproceeding-140331060233-phpapp02/85/Full-paper-proceeding-63-320.jpg)


![ISBN: 978-81-929339-0-0
National Conference on: “Trends and Challenges of Civil Engineering in Today’s Transforming W o r l d ”
29th March, 2014, Civil Engineering Department S.N.P.I.T. & R.C., Umrakh
CONCLUSIONS
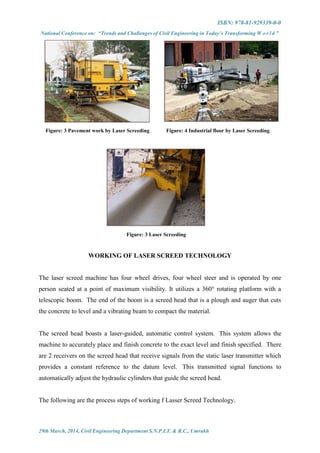
The following are the conclusion drawn from the study of Laser screed technology.Laser
Screeding consistently outperforms hand Screeding for precision and speed of flooring and
paving. Lower costs, reduced manpower, increased mobility and greater accuracy guarantee
the skilled teams will be 'on' and 'off' site with exceptional efficiency - allowing early access
for following trade and delivering improved customer satisfaction.The laser screed machines
have screed heads up to 3.6 m wide and the engine and hydraulic drive system, located in the
lower frame, significantly reduces noise and improves ease of maintenance.Moreover,
Simplified controls and an ergonomic design make the machines easy to operate, while a low
head height improves access in restricted areas.
ACKNOWLEDGEMENT
The Authors thankfully acknowledge to Dr. C. L. Patel, Chairman, Charutar Vidya Mandal,
Er.V.M.Patel, Hon. Jt. Secretary, Charutar Vidya Mandal, Mr. Yatinbhai Desai, Jay Maharaj
construction, Dr. F.S.Umrigar, Principal, B.V.M. Engineering College, Dr. L. B. Zala, Head
and Professor, Civil Engineering Department, Dr. A. K. Verma, Head and Professor,
Structural Engineering Department, B.V.M. Engineering College, Vallabh Vidyanagar,
Gujarat, India for their motivations and infrastructural support to carry out this research.
REFERENCES
[1] en.wikipedia.org
[2] GLENN A. SHEPHARD, 'LASER TECHNOLOGIES APPLICATION TO CONSTRUCTION'A Report
Presented to the Graduate Committee of the Department Civil Engineering in Partial Fulfillment of the
Requirements for the Degree of Master of Civil Engineering, University of Florida,Summer 1999
[3] pmallam.dns-systems.net
[4] Ravindra K Dhir, Peter C. Hewlett “Concrete in the Service of Mankind: Radical concrete technology,
Volume 4” E & FN SPON Publication, pp-535.
[5] techniconconstruction.com
[6] www.amanabuildings.com
[7] www.aquariustech.net
[8] www.cogriasia.com
[9] www.engineeringnews.co.za
[10]www.somero.com](https://image.slidesharecdn.com/fullpaperproceeding-140331060233-phpapp02/85/Full-paper-proceeding-73-320.jpg)


![ISBN: 978-81-929339-0-0
National Conference on: “Trends and Challenges of Civil Engineering in Today’s Transforming W o r l d ”
29th March, 2014, Civil Engineering Department S.N.P.I.T. & R.C., Umrakh
CONCLUSIONS
Ready Mix Concrete is a modern technique of production of concrete in massive quantities
away from the actual site of placing. It is very useful where demand of concrete is very high
and construction sites are in congested areas, where mixing on site is not possible due to lake
of storage place. RMC is ready to use material. It is widely adopted throughout the world. It
gives higher strength to the structure and it also provides higher Durability to the structure. It
reduces noise pollution as well as air pollution.The Supervisory and labour costs associated
with the production of RMC is less, and the quality of concrete is high. It is suitable for huge
industrial and residential projects where time plays a vital role.So ultimately it provides
economy in the construction and better finish to the structure. Hence the advantages of RMC
are realized by engineers and contractors in the construction industry.
ACKNOWLEDGMENT
The Authors thankfully acknowledge to Dr. C. L. Patel, Chairman, Charutar Vidya Mandal,
Er.V.M.Patel, Hon.Jt. Secretary, Charutar Vidya Mandal, Mr. Yatinbhai Desai, Jay Maharaj
construction, Dr. F. S. Umrigar, Principal, B.V.M. Engineering College, Dr. L. B. Zala, Head
and Professor, Civil Engineering Department, Dr. A. K. Verma, Head and Professor,
Structural Engineering Department, B.V.M. Engineering College, Vallabh Vidyanagar,
Gujarat, India for their motivations and infrastructural support to carry out this research.
REFERENCE
[1] “Concrete Batch Plant Modeling Guide”. Iowa Department of Natural Resources. Retrieved 3 October
2012.
[2] "Introduction of Concrete Mixing Plant". CONCRETE-MIXINGPLANT.COM.
[3] IS 4926:2003, “The Indian Standard Specification”
[4] www.janeoocn.com
[5] www.wekepedia.com
[6] www.google.com
[7] http://www.cashconcrete.com/about-us/
[8] R. S. Aggrawal , “Concrete Technology” Published by S. Chand
[9] http://www.rmcc.com/concrete-education-ready-mix-concrete.html
[10]http://www.boralcolorado.com/bcm-about-us
[11]http://www.grecoreadymix.com/ready/applications.html](https://image.slidesharecdn.com/fullpaperproceeding-140331060233-phpapp02/85/Full-paper-proceeding-83-320.jpg)


![ISBN: 978-81-929339-0-0
National Conference on: “Trends and Challenges of Civil Engineering in Today’s Transforming W o r l d ”
29th March, 2014, Civil Engineering Department S.N.P.I.T. & R.C., Umrakh
REFERENCES
[1] Conditions and Constraints in the Formwork Systems for Complex High-rise Building – with cases
from Hong Kong
[2] Moladiformwork.com
[3] Masterbuilder.co.in
[4] Novaformworksystem.com
[5] Sisconformwork.com
[6] Theconstrucor.org
[7] www.desireindia.in
[8] www.asiaric.com/aboutus.html](https://image.slidesharecdn.com/fullpaperproceeding-140331060233-phpapp02/85/Full-paper-proceeding-93-320.jpg)


![ISBN: 978-81-929339-0-0
National Conference on: “Trends and Challenges of Civil Engineering in Today’s Transforming W o r l d ”
29th March, 2014, Civil Engineering Department S.N.P.I.T. & R.C., Umrakh
(e) It avoids traffic jams.
(f) It makes the use of the line(track) of the old pipe possible.
(g) It saves underground space (pipe busting).
(h) It reduces the impact on the environment.
(i) It provides the hassle-free road surface.
(j) It is possible to lay service lines across the railway track, narrow lanes etc. When open
trenching is impossible.
VI. CONCLUSIONS
The Sewer Rehabilitation System provides a variety of benefits to the user. It combines
proven sewer lining technologies, state of the art materials and the advantage to retain
valuable size of sewer lines in ever-growing cities, a fact which is yet underestimated by the
majority of users.The time will soon come when the conventional method of open trench
digging will be selectively banned in India. To begin with, work should be undertaken for
crossings under roads, national highways, railways, canals etc. and all renovations of
sewerage systems in metropolitan cities. Enough know-how and technology are available to
make a beginning in the field.
ACKNOWLEDGMENT
The Authors thankfully acknowledge to Dr. C. L. Patel, Chairman, Charutar Vidya Mandal,
Er.V.M.Patel, Hon.Jt. Secretary, Charutar Vidya Mandal, Mr. Yatinbhai Desai, Jay Maharaj
construction, Dr. F.S.Umrigar, Principal, B.V.M. Engineering College, Dr. L.B.Zala, Head
and Professor, Civil Engineering Department, Dr. A. K. Verma, Head and Professor,
Structural Engineering Department, B.V.M. Engineering College, Vallabh Vidyanagar,
Gujarat, India for their motivations and infrastructural support to carry out this research.
REFERENCES
[1] Jagadish Chandra, “Trenchless Technology in India: Need of the New Millennium.” Civil Engineering and
Construction Review October 2000- page 48
[2] Maninder Singh, “Techniques of Trenchless Technology In Use In India.” Civil Engineering and
Construction Review October 200- page 43
[3] NeerajauganiSethi, “Pre- Requisites for Trenchless Technology.” Civil Engineering and Construction
Review October 2000- page 2](https://image.slidesharecdn.com/fullpaperproceeding-140331060233-phpapp02/85/Full-paper-proceeding-104-320.jpg)
![ISBN: 978-81-929339-0-0
National Conference on: “Trends and Challenges of Civil Engineering in Today’s Transforming W o r l d ”
29th March, 2014, Civil Engineering Department S.N.P.I.T. & R.C., Umrakh
[4] Sarkar A.K, “Trenchless Technology and INDSTT In India.” Civil Engineering and Construction Review
October 2000- page 13
[5] The Construction Journal of India November 2001- page21
[6] www.istt.com
[7] www.nodig.com
[8] www.piperehab.org
[9] www.nodigengineering.com
[10]www.ttmag.com
[11]www.directionaldrilling.com
[12]www.rehabshowcase.com
[13]www.rehabroadshow.com](https://image.slidesharecdn.com/fullpaperproceeding-140331060233-phpapp02/85/Full-paper-proceeding-105-320.jpg)


![ISBN: 978-81-929339-0-0
National Conference on: “Trends and Challenges of Civil Engineering in Today’s Transforming W o r l d ”
29th March, 2014, Civil Engineering Department S.N.P.I.T. & R.C., Umrakh
REFERENCES
[1] Building Construction by B.C. Punmia, Ashok Kumar Jain, Arun Kumar Jain, Luxmi Publication (P) LTD
[2] Lesson 7: Construction Dewatering and Ground Freezing, Temporary Structures, Winter Quarter 2007,
Professor Kamran M. Nemati, Department of Construction Management, University of Washington
[3] http://civil-engg-world.blogspot.in/2008/12/electrical-stabilization-of-soil.html
[4] http://www.fhwa.dot.gov/bridge/tunnel/pubs/nhi09010/12.cfm
[5] http://www.haywardbaker.com/WhatWeDo/Techniques/Grouting/ChemicalGrouting/default.aspx
[6] http://www.ecopolychem.com/home/
[7] http://www.aquatechdewatering.com/gallery.php
[8] www.weirminerals.compdfBrochure%20dewatering%20systems.pdf
[9] www.google.com](https://image.slidesharecdn.com/fullpaperproceeding-140331060233-phpapp02/85/Full-paper-proceeding-114-320.jpg)


![ISBN: 978-81-929339-0-0
National Conference on: “Trends and Challenges of Civil Engineering in Today’s Transforming W o r l d ”
29th March, 2014, Civil Engineering Department S.N.P.I.T. & R.C., Umrakh
REFERENCE
[1] R.P.Rethaliya Books on “Concrete Technology”
[2] R.Santhakumaran, Books on “Concrete Technology”
[3] www.construction world.com
[4] www.construction chemicals.com
[5] www.chemical.gov.in
[6] Water reducing concrete admixture” Published in IS: 9103 ASTM C: 494
[7] Waterproofing Concrete and Mortar Admixture Published in IS: 2645 – 1975](https://image.slidesharecdn.com/fullpaperproceeding-140331060233-phpapp02/85/Full-paper-proceeding-129-320.jpg)


![ISBN: 978-81-929339-0-0
National Conference on: “Trends and Challenges of Civil Engineering in Today’s Transforming World”
29th March, 2014, Civil Engineering Department S.N.P.I.T. & R.C., Umrakh
VallabhVidyanagar, Gujarat, India for their motivations and infrastructural support to carry
out this research.
REFERENCE
[1] Bryan Kang, Mary Wang, Xia Xiao, Madeline Ziser, Amending the current levee breach response
protocol in the California delta.
[2] Frank Bacik, Aqua Dam: Another Scotia Success Story, The Scotia independent,april29, 2011,
VOLUME I, ISSUE II
[3] www.aquadam.net/RefMaterials/refmaterials.html
[4] www.welltech.com.au/dewatering/dwPortBunds.html
[5] www.hydrologicalsolutions.com/aqua-barrier
[6] www.water-dam.co.uk/
[7] www.aquadam.net/
[8] www.damitdams.com/](https://image.slidesharecdn.com/fullpaperproceeding-140331060233-phpapp02/85/Full-paper-proceeding-138-320.jpg)


![ISBN: 978-81-929339-0-0
National Conference on: “Trends and Challenges of Civil Engineering in Today’s Transforming World”
29th March, 2014, Civil Engineering Department S.N.P.I.T. & R.C., Umrakh
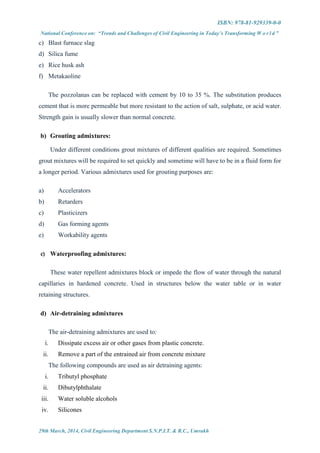
In support scaffolds, double layered scaffold is costly compared to the single layered
scaffold. While double layered scaffold can be used for several stories or large-scale
construction works.
In recent trends, metal scaffolds are widely used to compare to bamboo scaffolds due
to its durability and safety.
Various special scaffolding is beneficial for reducing accidents on large construction
sites. For safety and health point of view, standard codes should be preferred for
minimizing hazards.
So, various scaffoldings are very helpful, for small as well as large construction
projects which should be selected by considering financial level of project.
ACKNOWLEDGMENT
The Authors thankfully acknowledge to Dr. C. L. Patel, Chairman, Charutar Vidya Mandal,
Er.V.M.Patel, Hon.Jt. Secretary, Charutar Vidya Mandal, Mr. Yatinbhai Desai, Jay Maharaj
construction, Dr. F.S.Umrigar, Principal, B.V.M. Engineering College, Dr. L.B.Zala, Head
and Professor, Civil Engineering Department, Dr. A. K. Verma, Head and Professor,
Structural Engineering Department, B.V.M. Engineering College, Vallabh Vidyanagar,
Gujarat, India for their motivations and infrastructural support to carry out this research.
REFERENCES
[1] Building Construction by Dr. B. C. Punamia
[2] Dominic Mak Hung-kae Legislative Control Regime for Ensuring Safe Use of Scaffolding, Symposium on
Bamboo and Metal Scaffolding 1998.
[3] Francis K.W. Wong, Bamboo Scaffolding-Safety Management for the Building Industry in Hong Kong,
April 1998,Hong Kong Polytechnic University
[4] Wong Che Keung, Identification of the Key Factors Involved in Bamboo-scaffolding-Related Accidents on
Construction Sites in Hong Kong A report submitted as partial fulfillment of the requirements for master of
applied science (safety management) 1998.
[5] http://www.wti-scaffold.com/2010/05/24/the-benefit-of-suspended-scaffolding
[6] www.osho.com/scaffoldingtypes
[7] www.wikipedia.com/scaffolding
[8] www.scaffoldindia.com
[9] www.scaffoldscaffolding.com](https://image.slidesharecdn.com/fullpaperproceeding-140331060233-phpapp02/85/Full-paper-proceeding-151-320.jpg)


![ISBN: 978-81-929339-0-0
National Conference on: “Trends and Challenges of Civil Engineering in Today’s Transforming World”
29th March, 2014, Civil Engineering Department S.N.P.I.T. & R.C., Umrakh
Head & Professor, Structural Engineering Department, Dr.B.K.Shah, Associate Professor,
Structural Engineering Department, B.V.M. Engineering College, Vallabh Vidyanagar,
Gujarat, India for their motivations and infrastructural support to carry out this research.
REFERENCE
[1] Centre for Advancement of Trenchless Technologies (CATT), University of Waterloo, Ontario, Canada
(Link: www.civil.uwaterloo.ca/catt).
[2] Indian Society for Trenchless Technology (IndSTT), (Link: http://www.indstt.org).
[3] IETC Urban Environment Series, “Trenchless Technology Systems: An Environmentally Sound
Technology for the Installation, Maintenance and Repair of Underground Utility Services”, UNEP-DTIE-
IETC/ISTT.
[4] International Society for Trenchless Technology (ISTT), London, UK,
(Link: www.istt.com).
[5] Jagadish Chandra, “Trenchless Technology in India: Need of the new millennium.” Civil Engineering and
Construction Review October 2000- page 48.
[6] Maninder Singh, “Techniques of Trenchless Technology in Use in India.” Civil Engineering and
Construction Review October 2004- page 43.
[7] Neeraja Lugani Sethi, “Pre- Requisites for Trenchless Technology”, Civil Engineering and Construction
Review October 2000- page 21.
[8] Najaf, Mohammad. 2005. Trenchless Technology, McGraw-Hill Professional.
[9] Sarkar A.K, “Trenchless Technology and INDSTT in India.” Civil Engineering and Construction Review
October 2000- page 13.
[10]Steve Orchad, “Directional Drilling and Associated Technologies”, No-Dig International Journal,
November 2008.
[11]United States Department of Agriculture Forest Service Technology & Development Program , “Summary
of Trenchless Technology for Use With USDA Forest Service Culverts”, 7700–Transportation
Management September 2005 0577 1201—SDTDC.
Table: 1
Open Cut Excavation V/S Trenchless Technology
Construction Operations Open Cut
Excavation
Trenchless
Technology
Route surveying Yes Yes
Lard and easement acquisitions Yes Yes
Mobilizing Equipment and Personnel Yes Yes
Preparing the right-of-way (ROW) (cleaning and grubbing) Yes May be](https://image.slidesharecdn.com/fullpaperproceeding-140331060233-phpapp02/85/Full-paper-proceeding-164-320.jpg)


![ISBN: 978-81-929339-0-0
National Conference on: “Trends and Challenges of Civil Engineering in Today’s Transforming World”
29th March, 2014, Civil Engineering Department S.N.P.I.T. & R.C., Umrakh
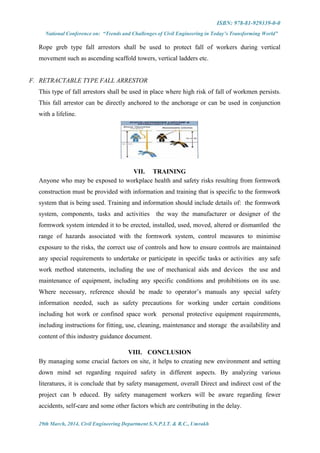
Fig. 10 and Fig. 11 shows comparison of idealized section with surveyed sections in the
present study reach which indicates very good agreement in the upper portion, indicating
stability, but poor agreement in the enlarged cutoff reach downstream, which indicates that
this lower enlarged reach will be aggrading over time.
ACKNOWLEDGMENT
The authors are thankful to Mr. B. M. Vadher, Principal, Dr. S. & S. S. Ghandhy Government
Engineering College, Surat and Director, Sardar Vallabhbhai Institute of Technology for their
motivational & infrastructural supports to carry out this research.
REFERENCES
[1] Agnihotri P. G and Patel J. N. 2011. Modification of channel of Surat city over Tapi river using HEC- RAS
software. International Journal of Advanced Engineering Technology. Vol. 2, pp. 231-238.
[2] Anthony L. Firenzi, Chester C. Watson, and Brian P. Bledsoe. 2000. Stable Channel Design for Mobile
Gravel Bed Rivers, Journal of Water Resource and Protection. Vol. 10, pp. 1-9.
[3] Timbadiya P. V., Patel P L., Porey P. D.2001,Calibration of HEC-RAS model on Prediction of Flood for
lower Tapi river India, Journal of Water Resource and Protection. Vol. 3, pp. 805-811
[4] Garde R. J, Raju Ranga K. G. 2000. Mechanics of Sediment Transportation and alluvial stream’s problems,
New Age International publishers (P) Ltd., New Delhi, India.
[5] IL Hong, Joongu Kang, Hongkoo Yeo, Yonguk Ryu.2011. Channel Response Prediction for Abandoned
Channel Restoration and Applicability Analysis, Journal of Engineering, Vol. 3, pp. 461-469.
[6] John Shelly and Parr David A.2009.Hydraulic design functions for Geomorphic channel design and analysis
using HEC-RAS, Journal of World Environmental and Water Resources Congress. Vol. 2, pp. 41-50.
[7] Neary Vincent S. Neary and Nic Korte.2001. Preliminary channel design of Blue River reach enhancement
in Kansas City, American society of Civil Engineering. Vol. 1, pp. 31-42.
[8] www.google.com
Figure 10: Comparison of computed water level using 2006
discharge and level of bank
0
2
4
6
8
10
12
14
CS-1
CS-6
CS-11
CS-16
CS-21
CS-26
CS-31
CS-36
CS-41
CS-46
Existing Levels
Computed R.L
0
2
4
6
8
10
12
14
CS-1
CS-6
CS-11
CS-16
CS-21
CS-26
CS-31
CS-36
CS-41
CS-46
Existing Levels
Computed R.L
0
2
4
6
8
10
12
14
CS-1
CS-6
CS-11
CS-16
CS-21
CS-26
CS-31
CS-36
CS-41
CS-46
Existing Levels
Computed R.L
Figure 11: Comparison of computed water level using 1944
discharge and bank level
0
2
4
6
8
10
12
14
CS-1
CS-4
CS-7
CS-10
CS-13
CS-16
CS-19
CS-22
EXISTING R.L
COMPUTED R.L](https://image.slidesharecdn.com/fullpaperproceeding-140331060233-phpapp02/85/Full-paper-proceeding-173-320.jpg)
![ISBN: 978-81-929339-0-0
National Conference on: “Trends and Challenges of Civil Engineering in Today’s Transforming World”
29th March, 2014, Civil Engineering Department S.N.P.I.T. & R.C., Umrakh
[9] www.wikipedia.com
[10] www.suratmunicipal.gov.in](https://image.slidesharecdn.com/fullpaperproceeding-140331060233-phpapp02/85/Full-paper-proceeding-174-320.jpg)


![ISBN: 978-81-929339-0-0
National Conference on: “Trends and Challenges of Civil Engineering in Today’s Transforming World”
29th March, 2014, Civil Engineering Department S.N.P.I.T. & R.C., Umrakh
XI.CASE STUDIES OF INTELLIGENT BUILDING
A. Case Study – 1 [Forum Mall, Bengaluru]
[a]
[b]
Figure 3: Forum Mall, Bangalore
Source:http://www.constructionworld.in/News.aspx?nId=JjDft4lL3daEe1VT5gZ7Tg==
1) Forum Mall Intelligent Building Details:
Floor Area: 3, 50, 000 Sq. ft. (plus 3, 00, 000 Sq. ft. parking)
Developer: Prestige Group
Intelligence Provided: Building Management System (BMS)
BMS Provider: Trend Control Systems, Honeywell](https://image.slidesharecdn.com/fullpaperproceeding-140331060233-phpapp02/85/Full-paper-proceeding-184-320.jpg)

![ISBN: 978-81-929339-0-0
National Conference on: “Trends and Challenges of Civil Engineering in Today’s Transforming World”
29th March, 2014, Civil Engineering Department S.N.P.I.T. & R.C., Umrakh
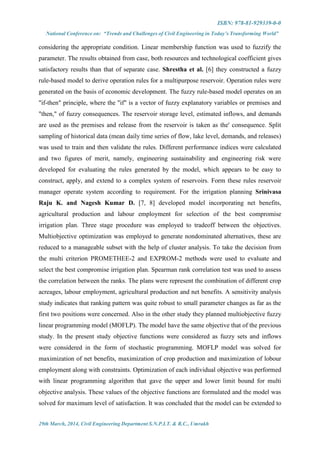
B. Case Study – 2 [Ebene Cyber Tower One, Mauritius]
Figure 4: Ebene Cyber Tower One, Mauritius
Source:http://www.constructionworld.in/News.aspx?nId=JjDft4lL3daEe1VT5gZ7Tg==
1) Management Committee:
Architect: C R Narayana Rao (CRN)
Intelligence Provided: Integrated Building Management System
Provider: Race Technologies
Cost of System: 1.75 to 2 Crore for the Building Management Systems (BMS)
2) System Details
Ebene Cyber City, Mauritius was awarded the Intelligent Building of the year by the
Intelligent Community Forum, USA in 2005. It uses an Integrated Management System
conceived and designed by C. R. Narayana Rao (CRN) and implemented by Race
technologies.](https://image.slidesharecdn.com/fullpaperproceeding-140331060233-phpapp02/85/Full-paper-proceeding-186-320.jpg)

![ISBN: 978-81-929339-0-0
National Conference on: “Trends and Challenges of Civil Engineering in Today’s Transforming World”
29th March, 2014, Civil Engineering Department S.N.P.I.T. & R.C., Umrakh
occupants. And it can also exhibits key attributes of environmental sustainability to
benefit present and future generations.
Though intelligent buildings have a positive impact on the environment, people and
economy, there can be still a wide scope for enhancement. Owing to the continuous,
evolving technological progress that intelligent buildings can be a part of demands
further exploration.
REFERENCES
[1] Atkin, B., 1988. Progress towards Intelligent Building in Atkin, B. (ed.) Intelligent Buildings- Applications
of IT and Building Automation to High Technology Construction Projects. London: Unicom Seminars
limited.
[2] Akkermans H., Ygge F., and Gustavsson R., “HOMEBOTS: Intelligent Decentralized.
[3] Bann J. J., Irisarri, G. D., Mokhtari S., Kirschen D.S. and Mille, B. N., "Integrating Applications in an
Energy Management System", IEEE Expert 12(6), pp. 53-59, 1997.
[4] Chappells, H., 2010. Comfort, well-being and the socio-technical dynamics of everyday life Intelligent
Buildings International, 2(4), pp.286-298.
[5] Chen, J., Ma, Y., Jeng, T. and Chang, C., 2010. An assessment of user needs for intelligent living space.
Intelligent Buildings International, 2(1), pp.20-40.
[6] Clements-Croome, D., 1997. What do we mean by intelligent buildings? Automation in Construction.
[7] Clements-Croome, D. (ed.) 2004. Intelligent Buildings: Design, Management and Operation. London:
Thomas Telford.
[8] “Evolution of the office building in the course of the 20th century: Towards an intelligent building”
Elz˙bieta Niezabitowska* and Dorota Winnicka-Jasłowska Faculty of Architecture, Silesian University of
Technology, Gliwice, Poland
[9] Frost and Sullivan, 2009. The Bright Green Buildings - Convergence of Green and Intelligent Buildings
Continental Automated Buildings Association (CABA).
[10]Gray, A., 2006. How smart are Intelligent Buildings?
[11] “Green Building” Sustainability Shapes the Future of Building, MGS Architecture September - October
2012
[12]Harrison, A., Loe, E. and Read, J., 1998. Intelligent Buildings in South East Asia. London: Taylor &
Francis Routledge.
[13]Himanen, M., 2003. The Intelligence of Intelligent Buildings: The Feasibility of the Intelligent Building
Concept in Office Buildings. Doctor of Science in Technology Thesis, Helsinki University of Technology.
[14]Mazza, P., 2008. Making green buildings intelligent: how to link green buildings and the Smart Grid
[online].
[15]Moore, C.A., 2009b. Intelligent Buildings Are Green [online].
[16]Matsunawa, K. and Nohara, F., 1994. Intelligent building saves energy. ASHRAE Journal January, pp.38-
40.
[17]Matthew, P., Mukherjee, M. and Gupta, V., 2009. The Performance of Intelligent Buildings in India. The
Institution of Engineers (India) Journal, 90(April).](https://image.slidesharecdn.com/fullpaperproceeding-140331060233-phpapp02/85/Full-paper-proceeding-188-320.jpg)
![ISBN: 978-81-929339-0-0
National Conference on: “Trends and Challenges of Civil Engineering in Today’s Transforming World”
29th March, 2014, Civil Engineering Department S.N.P.I.T. & R.C., Umrakh
[18]Sharples, S., Callaghan, V. and Clarke, G., 1999. A Multi-Agent Architecture for Intelligent building
sensing and control. Sensor Review, 19(2), pp.135-140.
[19]Services for Energy Management”, Fourth International Symposium on the Managementof Industrial and
Corporate Knowledge (ISMICK’96), 1996.
[20]http://propertybytes.indiaproperty.com/index.php/architecture-interiors/intelligent-buildings
[21]http://iopscience.iop.org/journals
[22]http://nreionline.com/technology/smart_buildings/
[23]http://en.wikipedia.org/wiki/Intelligent_home#Natural_lighting
[24]http://www.tefma.com/infoservices/papers/2001/Dearlove.ppt
[25]https://www.google.co.in/?gws_rd=cr&ei=SCnzUu_-I4WVrAfmw4Eg#q=intelligent+building+images
[26]http://www.constructionworld.in/News.aspx?nId=JjDft4lL3daEe1VT5gZ7Tg==](https://image.slidesharecdn.com/fullpaperproceeding-140331060233-phpapp02/85/Full-paper-proceeding-189-320.jpg)


![ISBN: 978-81-929339-0-0
National Conference on: “Trends and Challenges of Civil Engineering in Today’s Transforming World”
29th March, 2014, Civil Engineering Department S.N.P.I.T. & R.C., Umrakh
2. It isadvisable to inform adjoining neighbours prior to the demolition so that they may close
windows or take othermeasures.
3. Before demolition is commenced, and also during the progress of such work, all electrical
cables or apparatuswhichis liable to be a source of danger, other than a cable or apparatus
used for the demolition works shall bedisconnected.
4. During the progress of demolition, the work shall be under the continuous supervision of
the demolisher or ofan experienced foreman.
5. Unless otherwise expressly approved, demolition shall be executed storey by storey
commencing at the roofand working downward.
6. When the demolition site adjoins a street or public walkway, a 2.4 meter high solid
hoarding shall be erected.
7. The demolished material shall not be allowed to remain on any floor or structure if the
weight of the materialexceeds the safe carrying capacity of the floor or structure.
8. Dust creating material, unless thoroughly dampened shall not be thrown or dropped from
the building, butshallbe lowered by hoisting apparatus or removed by material chutes.
9. Chutes shall be completely enclosed and a danger sign shall be placed at the discharge end
of every chute.
IX.CONCLUSION
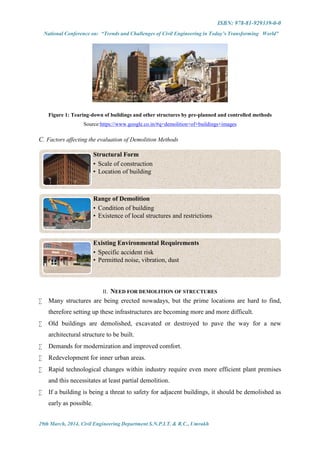
Type of demolition method can depend upon various factors such as site condition, type of
structures, age of building, height of the building and the economy.
Explosive demolition can be preferred method for safely and efficiently demolishing the
larger structures.
For small buildings, that are only two or three stories high, demolition canbea simple
process.
While demolition by any method, the safety measures as precautions should be taken.
REFERENCES
[1] Carlo De Pauw, Erik K.Lauritzen, “Disaster Planning, Structural Assessment, Demolition and Recycling”,
First edition 1994, ISBN 0-203-62648-6 Master e-book ISBN, ISBN 0-203 63038-6 (Adobe eReader
Format), ISBN 0 419 19190 9 (Print Edition), © 1994 RILEM, Taylor & Francis, London.
[2] CBS Statline (2008a), Residential buildings by region. http://statline.cbs.nl
[3] CBS Statline (2008b), Changes in the dwelling stock. http://statline.cbs.nl
[4] Code of practice for Demolition of Buildings by Building Departments of Hong Kong in 2004.
[5] Erik K. Lauritzen, “Demolition and Reuse of Concrete and Masonry”, First edition 1994, ISBN 0-203-
62687-7 Master e-book ISBN, ISBN 0-203-63071-8 (Adobe e-Reader Format), ISBN 0 419 18400 7 (Print
Edition), E & EN SPON, Chapman & Hall, © 1994 RILEM, 24–27 October 1993, Odense, Denmark.
[6] Gruis, V. & N. Nieboer, (2004), “Asset Management in the Social Rented Sector”, Dordrecht (Kluwer).
[7] Itard L. & F. Meijer, 2009, “Towards a sustainable Northern European housing stock”, Amsterdam (IOS
Press).
[8] Jonge, T. de (2005), “Cost effectiveness of sustainable housing Investments”, Delft (DUP).](https://image.slidesharecdn.com/fullpaperproceeding-140331060233-phpapp02/85/Full-paper-proceeding-204-320.jpg)
![ISBN: 978-81-929339-0-0
National Conference on: “Trends and Challenges of Civil Engineering in Today’s Transforming World”
29th March, 2014, Civil Engineering Department S.N.P.I.T. & R.C., Umrakh
[9] Klunder, G. (2005), “Sustainable solutions for Dutch housing: Reducing the environmental impact of new
and existing houses”, Delft (DUP).
[10]Kohler, N. & U. Hassler (2002), “The building stock as a research object in Building Research &
Information”, 30(4).
[11]Ljubljana.Awano, H. (2005), “Towards the sustainable use of building stock”, Paris (OECD).
[12]MVROM (2008), INFO-Wonen, http://www.vrom.nl/infowonen
[13]Thomsen A. & K van der Flier (2002), Updating the Housing Stock, The Need for Renovation Based-
Approaches, in “Housing Cultures – Convergence and Diversity”, ENHR Conference 2002, Vienna.
[14]Thomsen A. (2007), “The New Building Assignment: Old Stock, New Markets”, Era build Event" 2007,
29-30 October 2007, Amsterdam (TU Delft).
[15]Prof. ChimayAnumba, Dr. Barbara Marino, Prof. Arie Gottfried, “Health and safety in refurbishment
involving and structural instability”, (Research 204).
[16]Tom Harris, “An article on How Building Implosions work”.
[17]Wassenberg F. (2006), “Motives for Demolition, in: “Housing in an expanding Europe”, ENHR Conference
2006.
[18]Y.Kasai. “Demolition Methods and Practice”, Proceedings of the Second International RILEM Symposium,
Tokyo, Japan. Chapman and Hall, London, UK 1988.](https://image.slidesharecdn.com/fullpaperproceeding-140331060233-phpapp02/85/Full-paper-proceeding-205-320.jpg)


![ISBN: 978-81-929339-0-0
National Conference on: “Trends and Challenges of Civil Engineering in Today’s Transforming World”
29th March, 2014, Civil Engineering Department S.N.P.I.T. & R.C., Umrakh
TABLE V: CHEMICAL PROPERTIES OF SCBA
Constituent Volume (%)
SiO2 50.64
CaO 4.11
Al2O3 4.83
Fe2O3 2.60
MgO ----
SO3 2.48
K2O ----
LOI 35.33
Source: Tested at Geo Test House, Baroda.
III.DESIGN MIX METHODOLOGY
A. Mortar Mix Proportion
A Mortar mix 1:3 was considered as per IS: 12269 -2013 method and was used to prepare the test samples.
The design mix proportion is done below in the tables.
TABLE VI: MIX PROPORTION FOR MORTAR
For 1 Cube Water Cement Sand
By Weight [gm] 90 ml 200 600
TABLE VII: CEMENT REPLACEMENT BY SCBA IN MORTAR
Sr.No. Mortar Type Description of Mortar
1. AM Normal Mortar (1:3)
2. MBC1 5% Replacement By SCBA
3. MBC2 10% Replacement By SCBA
B. Concrete Mix Proportion
A Concrete M25 grade was designed as per IS: 10262-2009 method and was used to prepare the test
samples. The design mix proportion is done below in the tables.
TABLE VIII: MIX DESIGN PROPORTION FOR CONCRETE
For 1 m3
Water Cement Fine Aggregate Coarse Aggregate
By Weight [kg] 200 L 400 665 1085
TABLE IX: CEMENT REPLACEMENT BY SCBA IN CONCRETE
Sr. No. Concrete Type Description of Concrete
1. AC Normal Concrete (M25)
2. CBC1 5% Replacement By SCBA
3. CBC2 10% Replacement By SCBA](https://image.slidesharecdn.com/fullpaperproceeding-140331060233-phpapp02/85/Full-paper-proceeding-210-320.jpg)


![ISBN: 978-81-929339-0-0
National Conference on: “Trends and Challenges of Civil Engineering in Today’s Transforming World”
29th March, 2014, Civil Engineering Department S.N.P.I.T. & R.C., Umrakh
REFERENCES
PAPERS:-
[1] AbdolkarimAbbasi& Amin Zargar, “Using BagasseAshInConcreteAsPozzolana”Middle-East
JournalofScientificResearch, ISSN 1990-9233, Vol.13, Issue 6, PP: 716-719, 2013.
[2] Lavanya M.R, Sugumaran.B and Pradeep.T, “An Experimental Study on the Compressive Strength of
Concrete By Partial Replacement of Cement With Sugarcane Bagasse Ash” International Journal of
Engineering Inventions ISSN: 2278-7461, ISBN: 2319-6491, Vol. 1, Issue 11, PP: 01-04, December2012.
[3] NuntachaiChusilp, NapongsatornLikhitsripaiboon and Chai Jaturapitakkul, “Development of Bagasse Ash
As A Pozzolanic Material In Concrete” Asian Journal on Energy and Environment, ISSN 1513-4121,
August 2009.
[4] R.Srinivasan&K.Sathiya, “Experimental Study on Bagasse Ash In Concrete” International Journal For
Service Learning In Engineering, ISSN 1555-9033, Vol. 5, No. 2, Pp. 60-66, Fall 2010.
IS CODES:-
[5] IS516-1959,“MethodsofTestsforStrengthofConcrete”, Bureau ofIndianStandards, New Delhi.
[6] IS 4031 -1988, “Methods for Physical Tests for Hydraulic Cement”, Part 6- Determination of
Compressive Strength of Hydraulic Cement Other than Masonry Cement, Bureau ofIndianStandards, New
Delhi.
[7] IS10262-2009,“ISMethod ofMixDesign”,Bureau of Indian Standards, New Delhi.
[8] IS 12269 -2013, “Specification for 53 Grade OPC”, Bureau ofIndianStandards, New Delhi.](https://image.slidesharecdn.com/fullpaperproceeding-140331060233-phpapp02/85/Full-paper-proceeding-215-320.jpg)


![ISBN: 978-81-929339-0-0
National Conference on: “Trends and Challenges of Civil Engineering in Today’s Transforming World”
29th March, 2014, Civil Engineering Department S.N.P.I.T. & R.C., Umrakh
3 Initial setting
time (hours,
min)
91 min 30 minimum
4 Final setting
time
(hours, min)
211
min
600 maximum
5 Compressive
strength
58
N/mm2
53 N/mm2
minimum
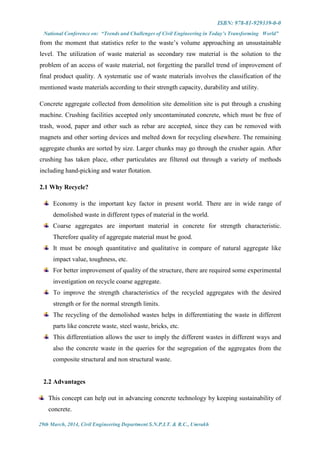
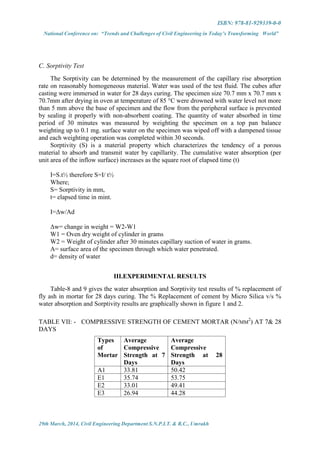
C. Fine Aggregate
Those fractions from 4.75 mm to 150 micron are termed as fine aggregate. The river
sand is used as fine aggregate conforming to the requirements of IS: 383. The river sand
is washed and screened, to eliminate deleterious materials and over size particles.
TABLE III: - PROPERTIES OF FINE AGGREGATE
Property Fine
Aggregate
(River sand)
Fineness modulus 3.1
Specific Gravity 2.767
Water absorption (%) 1.2
Bulk Density (gm/cc) 1.78
D. Water
Water is an important ingredient of Mortar as it actually participates in the chemical
reaction with cement. Since it helps to from the strength giving cement gel, the quantity and
quality of water is required to be looked into very carefully.
I. DESIGN MIX METHODOLOGY
TABLE IV: - MIX DESIGN PROPORTIONS
Wate
r
Cemen
t
Fine aggregate
(River sand)
By Weight,
[gms]
86 200 600
TABLE V: - % REPLACEMENT OF CEMENT BY MICRO SILICA
Sr.
No.
Types of
Mortar
Description of Mortar
1 A1 River sand Mortar (1:3)
2 H1 10% Cement Replacement by Micro Silica](https://image.slidesharecdn.com/fullpaperproceeding-140331060233-phpapp02/85/Full-paper-proceeding-218-320.jpg)
![ISBN: 978-81-929339-0-0
National Conference on: “Trends and Challenges of Civil Engineering in Today’s Transforming World”
29th March, 2014, Civil Engineering Department S.N.P.I.T. & R.C., Umrakh
3 H2 30% Cement Replacement by Micro Silica
4 H3 50% Cement Replacement by Micro Silica
TABLE VI: - DESIGN MIX PROPORTIONS FOR MORTAR (1:3)
Types of
Mortar
W/C
ratio
% Replacement of Cement
by Micro Silica
Design Mix Proportions For Mortar
(1:3) (by Weight in gms)
C F.A.R. Micro Silica
A1 0.45 0 200 600 -
H1 0.45 10% 180 600 20
H2 0.45 30% 140 600 60
H3 0.45 50% 100 600 100
W= Water, C= Cement, F. A.R. = Fine Aggregate Regional
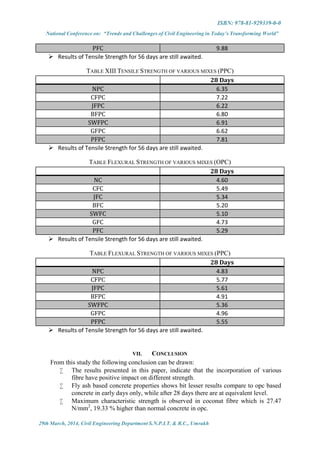
A. Compressive strength
Compressive strength tests were performed on compression testing machine using cube
samples. Three samples per batch were tested with the average strength values reported in
this paper. The loading rate on the cube is 35 N/mm2
per min. The comparative studies were
made on their characteristics for cement mortar ratio of 1:3 with partial replacement of
cement with Micro Silica as 0%, 10%, 30% and 50%.
Fig 1: Set up of Compressive Testing Machine
B. Water Absorption Test
The 70.7 mm x 70.7 mm x 70.7mm size cube after casting were immersed in water for
28 days curing. These specimens were then oven dried for 24 hours at the temperature85°C
until the mass became constant and again weighed. This weight was noted as the dry weight
(W1) of the cylinder. After that the specimen was kept in water at 85°c for 24 hours. Then
this weight was noted as the wet weight (W2) of the cylinder.
% water absorption = [(W2– W1) / W1] x 100
Where,
W1 = Oven dry weight of cubes in grams
W2 = after 24 hours wet weight of cubes in grams.](https://image.slidesharecdn.com/fullpaperproceeding-140331060233-phpapp02/85/Full-paper-proceeding-219-320.jpg)

![ISBN: 978-81-929339-0-0
National Conference on: “Trends and Challenges of Civil Engineering in Today’s Transforming World”
29th March, 2014, Civil Engineering Department S.N.P.I.T. & R.C., Umrakh
Fig 4: Average Sorptivity at 28 Days for Micro Silica Mortar
IV.CONCLUSION
As the % Replacement of Micro Silica Increase Compressive Strength is Decreasing
Optimum Replacement level is Found at 10 %
As the cost of Micro Silica is High so this Mortar Can only be used when Strength is
Required and Cost can be ignored
As the Compressive strength increase Water absorption and Sorptivity are Decreased
For Cost Effectiveness some extra additives like Fly Ash can be Used with Micro
Silica
This type of Mortar can be used for Structural Purpose rather than for Low cost
construction
V.ACKNOWLEDGMENT
The heading of the Acknowledgment and References must not be numbered. It should be like
in Following Format.
The authors are thankfully acknowledge to Mr. J.N.Patel, ChairmainVidyabharti Trust, Mr.
K.N.Patel, Hon. Secretary, Vidyabharti Trust, Dr. H.R.Patel, Director, Dr.J.A.Shah,
Principal, S.N.P.I.T.&R.C.,Umrakh, Bardoli, Gujarat,India for their motivational &
infrastructural supports to carry out this research.
REFERENCES
[1] Atis, C. D. (2003). “Accelerated carbonation and testing of mortar made with fly ash.” Construction and
Building Materials, Vol. 17, No. 3, pp. 147-152.
[2] Bai j., Wild S, Sabir BB (2002) “Sorptivity and strength of air-cured and water cured PC-PFA-MK mortar
and the influence of binder composition and carbonation depth”. Cement and mortar research 32:1813-
1821.](https://image.slidesharecdn.com/fullpaperproceeding-140331060233-phpapp02/85/Full-paper-proceeding-222-320.jpg)
![ISBN: 978-81-929339-0-0
National Conference on: “Trends and Challenges of Civil Engineering in Today’s Transforming World”
29th March, 2014, Civil Engineering Department S.N.P.I.T. & R.C., Umrakh
[3] Bentz, D., Ehlen, M., Ferraris, C., and Garboczi, E. "Sorptivity-Based Service Life Predictions for Mortar
Pavements." 181–193.
[4] Caliskan, S. (2006). "Influence of curing conditions on the sorptivity and weight change characteristics of
self-compacting mortar." The Arabian Journal for Science and Engineering, 31(1), 169-178.
[5] Claisse, P. A. (1997). "Absorption and Sorptivity of Cover Mortar."Journal of Materials in Civil
Engineering, 9(3), 105-110.
[6] Dias, W. P. S. (2000). "Reduction of mortar sorptivity with age through carbonation."Cement and Mortar
Research, 30(8), 1255-1261.
[7] Deepa A Sinha, Dr.A.K.Verma, Dr.K.B.Prakash (2012) “Sorptivity and waste absorption of steel fibers
reinforced ternary blended mortar”. International journal: global research analysis
(GRA),volume:1,issue:5,oct2012,issn no:2277-8160.
[8] Gonen, T. and Yazicioglu, S. (2007). “The influence of compactionpores on sorptivity and carbonation of
mortar.” Construction andBuilding Materials, Vol. 21, No. 5, pp. 1040-1045.
[9] Güneyisi, E. and Gesog˘lu, M., (2008). “A study on durability properties ofhigh-performance mortars
incorporating high replacement levelsof slag.” Materials and Structures, Vol. 41, No. 3, pp. 479-493.
[10] Hall, C. (1977). "Water movement in porous building materials--I.Unsaturated flow theory and its
applications."Building and Environment, 12(2), 117-125.
[11] Hall, Christopher; Hoff, William D (2012). Water transport in brick, stone and mortar, 2nd edn.
London and New York: Taylor and Francis. http://www.routledge.com/books/details/9780415564670/.
[12] JayeshkumarPitroda, Dr. F S Umrigar (2013), “Evaluation of Sorptivity and Water Absorption of
Concrete with Partial Replacement of Cement by Thermal Industry Waste (Fly Ash)” International Journal
of Engineering and Innovative Technology (IJEIT) Volume 2, Issue 7, January 2013, ISSN: 2277-3754, ISO
9001:2008 Certified, pp-245-249.
[13] Prof. JayeshkumarPitroda, Dr. L.B.Zala, Dr.F.S.Umrigar (2013), “ Durability of concrete with Partial
Replacement of Cement by Paper Industry Waste (Hypo Sludge)” International Journal of Innovative
Technology and Exploring Engineering (IJITEE) , ISSN: 2278-3075, Volume-2, Issue-3, February 2013 /
101-104
[14] Philip, John R (1957). "The theory of infiltration: 4. Sorptivity and algebraic infiltration equations".
Soil Science 84: 257-264.
[15] Rushabh A. Shah, Prof. JayeshkumarPitroda (2013), “Effect of Pozzocrete as Partial Replacement
with Cement in Mortar” International Journal Global Research Analysis, (GRA), Volume: 2, Issue: 1, Jan
2013, ISSN No 2277 – 8160, pp-44-46.
[16] Rushabh A. Shah, Prof. JayeshkumarPitroda (2013), “Pozzocrete: Modern Material Partially
Replaced with Cement in Mortar” International Journal of Innovative Technology and Exploring
Engineering (IJITEE), ISSN: 2278-3075, Volume-2, Issue-3, February 2013 / 105-108
[17] Rushabh A. Shah, Prof. JayeshkumarPitroda (2013), “Fly Ash Class F: Opportunities for Development
of Low Cost Mortar” International Journal of Innovative Technology and Exploring Engineering (IJITEE),
ISSN: 2278-3075, Volume-2, Issue-4, February 2013 / 112-115](https://image.slidesharecdn.com/fullpaperproceeding-140331060233-phpapp02/85/Full-paper-proceeding-223-320.jpg)
![ISBN: 978-81-929339-0-0
National Conference on: “Trends and Challenges of Civil Engineering in Today’s Transforming World”
29th March, 2014, Civil Engineering Department S.N.P.I.T. & R.C., Umrakh
[18] Rushabh A. Shah, Prof. JayeshkumarPitroda (2013), “Effect of Water Absorption and Sorptivity on
Durability of Pozzocrete Mortar” IJESE.
[19] Sulapha, P., Wong, S. F., and Wee, T. H., and Swaddiwudhipong, S.(2003). “Carbonation of mortar
containing mineral admixtures.”Journal of Materials in Civil Engineering, Vol. 15, No. 2, pp. 134-143.](https://image.slidesharecdn.com/fullpaperproceeding-140331060233-phpapp02/85/Full-paper-proceeding-224-320.jpg)


![ISBN: 978-81-929339-0-0
National Conference on: “Trends and Challenges of Civil Engineering in Today’s Transforming World”
29th March, 2014, Civil Engineering Department S.N.P.I.T. & R.C., Umrakh
Loss on Ignition (%) 4.63 %
Figure 4: Fly Ash
Source: - S.N.P.I.T & R.C, Umrakh
III.DESIGN MIX METHODOLOGY
A mix of 1:3 was taken. The design mix proportion is mentioned below:
TABLE V: MIX DESIGN PROPORTION
For 1m3
Cube Water/Cement Ratio Water (Litre) Cement (Kg) Coarse Aggregate (Kg)
By Weight [kg] 0.25 136 543 1629
TABLE VI: TYPES OF PERVIOUS CONCRETE
Sr. No. Mortar Type Description of Mortar Water/Cement Ratio
1. AC Conventional Pervious Concrete (Kapchi 20mm)
0.25
2. AF 10% Replacement of Cement by Fly Ash (Kapchi 20mm)
3. DC Conventional Pervious Concrete (Grit 10mm)
4. DF 10% Replacement of Cement by Fly Ash (Grit 10mm)
IV.COMPRESSIVE STRENGTH TEST
Compressive strength test was performed on compression testing machine using cube
samples at 7 days. Three samples for each component were casted and then tested. The
average strength values are reported in this paper.](https://image.slidesharecdn.com/fullpaperproceeding-140331060233-phpapp02/85/Full-paper-proceeding-229-320.jpg)


![ISBN: 978-81-929339-0-0
National Conference on: “Trends and Challenges of Civil Engineering in Today’s Transforming World”
29th March, 2014, Civil Engineering Department S.N.P.I.T. & R.C., Umrakh
[1] ThusharaPriyadarshana, Colombo, Shri Lanka, “ Pervious concrete – a sustainable choice in civil
engineering and construction”
[2] http://myscmap.sc.gov/marine/NERR/pdf/PerviousConcrete_pavements.pdf
[3] http://www.perviousconcrete.com/maintenance_prevention.htm
[4] http://en.wikipedia.org/wiki/Pervious_concrete
[5] http://theconstructor.org/concrete/pervious-concrete-futuristic-solution-to-urban-runoff/5289/
[6] http://www.nbmcw.com/articles/roads/5529-pervious-concrete-pavement-for-parking-areas-pathways-
sustainable-porous-and-storm-waterdrainage.html
[7] http://www.nbmcw.com/articles/roads/25313-pervious-concrete-a-solution-to-stormwater-runoff.html.
[8] http://www.nrmca.org/research_engineering/Documents/.
[9] http://www.flyash.com/data/upimages/press/TB.29%20Fly%20Ash%20in%20Pervious%20Concrete.pdf
[10]IS516-1959, “Methods of Tests for Strength of Concrete”, Bureau of Indian Standards, New Delhi.
[11]IS 4031 -1988, “Methods for Physical Tests for Hydraulic Cement”, Part 6- Determination of Compressive
Strength of Hydraulic Cement Other than Masonry Cement, Bureau of Indian Standards, New Delhi.
[12]IS10262-2009, “IS Method of Mix Design”, Bureau of Indian Standards, New Delhi.
[13]IS 12269 -1987, “Specification for 53 Grade OPC”, Bureau of Indian Standards, New Delhi.](https://image.slidesharecdn.com/fullpaperproceeding-140331060233-phpapp02/85/Full-paper-proceeding-232-320.jpg)
![ISBN: 978-81-929339-0-0
National Conference on: “Trends and Challenges of Civil Engineering in Today’s Transforming World”
29th March, 2014, Civil Engineering Department S.N.P.I.T. & R.C., Umrakh
sawdust, canola meal, and coconut shell.Copper is one such metal that requires considerable
attention. Industrial wastewater from textile, leather tanning, electroplating, pigmentation and
dyes contain copper in high concentration.
The application of low-cost adsorbents obtained from plant wastes as a replacement for costly
conventional methods of removing heavy metal ions from wastewater has been reviewed. It is
well known that cellulosic waste materials can be obtained and employed as cheap adsorbents
and their performance to remove heavy metal ions can be affected upon chemical treatment.
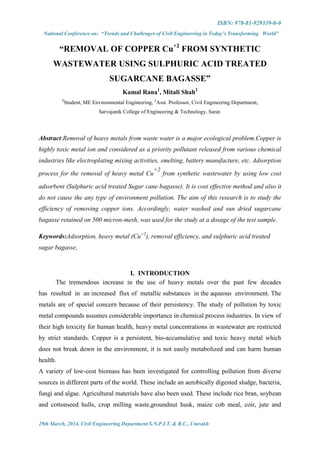
Fly ash, Peanut hulls, Banana peels, Neem leaves, Tea waste, Sugar cane bagasse, Rise husk,
Saw dust, Coconut husk, Soybean hulls, Cotton seed hulls are low cost adsorbents.[8]
Table 1. Heavy metal removal efficiency (%) of different adsorbents
Adsorbent
Avg. Heavy metal removal efficiency (%)
Cr(VI) Ni(II) Cu(II) Zn(II) Cd(II) Hg(II) Pb(II)
Rice husk carbon 98.5 92.3 85.5 78.3 66.2 58.1 57.8
Fly ash 85.3 67.5 78.4 74.9 65 55 51
Peanut hulls 87.1 72.5 57.8 83 71.4 61 56.3
Banana peels 91 81.3 81 73.8 62.8 70 61.8
Neem leaves 83 77.6 84.3 75.7 69 56.4 71.6
Tea waste 85.4 71.9 87.1 85.1 73.5 70 65.2
Sugar cane bagasse 99 87 94.2 75.3 71.5 61.7 66.5
Saw dust 84 75 91 57.8 59.7 62.7 55.8
Coconut husk 75 68 89.3 77.6 67.5 71.9 70
Cotton seed hulls 78 82 90 62.7 70 65.5 61
(Source: Low Cost Adsorbents for Removal of Heavy Metals from Wastewater ISSN (Online) 2319-183)
Introduction & effect of Copper
Copper is a persistent, bio-accumulative and toxic heavy metal which does not break
down in the environment, it is not easily metabolized and can harm human health. The
various potential sources of copper pollution are metallurgical and metal finishing, corrosion
inhibitors in cooling and boiler systems, drilling mud’s catalysts, primer paints, fungicides,
copper plating and pickling, corrosion of copper piping, copper releases from vehicle brake
pads.[2]
Acute poisoning from ingestion of excessive copper can cause temporary gastrointestinal
distress with symptoms such as nausea, vomiting, and abdominal pain. Liver toxicity has
been seen in doses high enough to cause death. High levels of exposure to copper can cause
destruction of red blood cells, possibly resulting in anemia.
Mammals have efficient mechanisms to regulate copper stores such that they are generally
protected from excess dietary copper levels. However, at high enough levels, chronic](https://image.slidesharecdn.com/fullpaperproceeding-140331060233-phpapp02/85/Full-paper-proceeding-234-320.jpg)
![ISBN: 978-81-929339-0-0
National Conference on: “Trends and Challenges of Civil Engineering in Today’s Transforming World”
29th March, 2014, Civil Engineering Department S.N.P.I.T. & R.C., Umrakh
overexposure to copper can damage the liver and kidneys. Symptoms of liver toxicity
(jaundice, swelling, pain) usually do not appear until adolescence [3].
II. LITERATURE REVIEW
Dr. P. AkhilaSwathanthra, Dr. B. SarathBabu, M. SrinivasaRao, Dr.V.V.BasavaRao has studied
thatAdsorption behavior of copper from waste water has been investigated in this paper using
Bagasse. Copper is highly toxic metal ion and considered as a priority pollutant released from
various chemical industries like electroplating mixing activities, smelting, battery
manufacture, etc. In the present paper, the experimental results carried out in batch adsorption
process using treated Bagasse with synthetic samples prepared in laboratory were presented.
The various parameters such as solution pH, initial copper concentration, Temperature and
adsorbent dosage on the adsorption of Cu (II) were studied and presented. It was found that
the adsorption data were fitted well by Langmuir isotherm. The Langmuir adsorption
capacity was estimated at 4.75 mg/g for Bagasse. The maximum removal of Copper is above
93% was observed at pHof 5 for Bagasse in 100ppm Copper solution [1].
N Prapurna and M Viswanathamhas studied that the Adsorption Kinetics for the
simultaneous and selective removal ofCr (VI) and Cu (II) ions fromaqueous mixture was
investigated using sugarcane bagasse. Batch studies were performed at room temperature at
three different initialconcentrations of each metal ion to be present in the test sample: 10ppm,
30ppm and 50ppm. Theavailable literature for the removal of each of these heavy metal ions
when present individually inaqueous solutions was applied in these studies. Accordingly,
water washed and sun dried sugarcanebagasse retained on 200 micron-mesh, was used for the
study at a dosage of 0.4 g/l of the test sample.ThepH of the test samples varied from 7.05
initial values to 8.09 at equilibrium, during all the batchstudies. The study has revealed that
the adsorbent had higher selectivity to Cu (II) ions in comparisonto the Cr (VI) ions at the
study conditions. The experimental results fit well with linearized Freundlich Adsorption
Isotherm Model [4].
PatilKishor P., Patil Vilas S., NileshPatil, Motiraya Vijay has investigated that the
efficiency of removing copper ions and Zinc ions from Copper Chloride and Zinc Chloride,
using naturally based adsorbents like Sugarcane Bagasse. Batch adsorption studies show that
the sugarcane bagasse has great ability for extracting metallic ions from wastewater samples.
The factors affectingcopper ion adsorption by sugarcane bagasse were determined to be](https://image.slidesharecdn.com/fullpaperproceeding-140331060233-phpapp02/85/Full-paper-proceeding-235-320.jpg)
![ISBN: 978-81-929339-0-0
National Conference on: “Trends and Challenges of Civil Engineering in Today’s Transforming World”
29th March, 2014, Civil Engineering Department S.N.P.I.T. & R.C., Umrakh
initial concentration and pH of the solution, the results showed that bagasse were found to be
an attractive low costalternative for the treatment of wastewater. A good efficiency to remove
toxic metal ions was achieved by usage of such by-product. The acid modified sugarcane
bagasse and Cu (II) solution were kept in contact for various time periods 10, 20, 30, 60 min.
The % removal of Cu was obtained 85-90%. Various time periods (1-4) hrs % removal is 60-
70% [5].
Thomas Anish Johnson, Niveta Jain, H C Joshi and Shiv Prasadstudied that use of
agricultural and agro-processing industry waste (Sugarcane bagasse) as metal adsorbents
from wastewater. Modified materials displayed better adsorption capacity of some was
comparable with that of commercial activated carbons and synthetic resins. Agricultural
wastes are low cost adsorbents and can be viable alternatives to activated carbon for
treatment of metal contaminated wastewater. Batch adsorption of sugarcane bagasse reached
equilibrium by 60 min of contact and achieved 60% removal of Cu (II); a highest up to 30.9
mg/g for Cu (II) at pH 5.5 [7].
Shaliza Ibrahim, Piarapakaran Subramaniam and Nasim Ahmad Khanhas studied that the
adsorption process is being widely used by various researchers for the removal of heavy
metals from waste streams and activated carbon has been frequently used as an adsorbent.
The objective of this study is to contribute in the search for less expensive adsorbents and
their utilization possibilities for various agricultural waste by-products such as sugarcane
bagasse, rice husk, oil palm shell, coconut shell, coconut husk etc. for the elimination of
heavy metals from wastewater. At an adsorbent dose of 0.8 g / 50 ml is sufficient to remove
80 – 100% Cr (VI) from aqueous solution having an initial metal concentration of 20mg/l at a
pH value of 1.The maximum removal obtained was around 99.8% at pH 2. The data for all
the adsorbents fit well to the Freundlich isotherm [6].
III. MATERIALS AND METHODS
Preparation of Adsorbent
The adsorbent was selectedfor removal of Copper by sugarcane bagasse. It is a waste
product from sugar mill mainly composed of glucose, cellulose, pentose, and lignin.
Adsorbent (Sugarcane bagasse) collected from Sugar industry. Firstly the adsorbent was
washed with distilled water and dried at room temperature to avoid the release of color by
adsorbent into the aqueous solution. The activation of adsorbent is carried out by treating it
with concentrated sulphuric acid (0.1N) and is kept in an oven maintained at a temperature
range of 150ºC for 24hr. Again is washed with distilled water to remove the free acid and put](https://image.slidesharecdn.com/fullpaperproceeding-140331060233-phpapp02/85/Full-paper-proceeding-236-320.jpg)
![ISBN: 978-81-929339-0-0
National Conference on: “Trends and Challenges of Civil Engineering in Today’s Transforming World”
29th March, 2014, Civil Engineering Department S.N.P.I.T. & R.C., Umrakh
in to oven for removal of moisture and then adsorbent is passed from 500 micron mesh size
and collected for experimental use.
Table 2. Physical and chemical characteristics of bagasse
Physical
Characteristics
Value
Chemical
Characteristics
Value (%)
Bulk density, kg/m3
254.55 Glucose 40 - 50%
Moisture (%) 6.5 Cellulose 45.1
Ash content (%) 1.08 Hemicelluloses 25.6
Porosity (%) 0.51 Lignin 12.7
Surface area, m2
419.5 Other organic material 4.3
Loss on drying (%) 18.1
(“REMOVAL OF HEAVY METALS EMPLOYING BAGASSE” ISSN: 2249-4189.)
Case study: Removal of Heavy Metals Employing Bagasse
Synthetic solution of Cu2+ were prepared50 ppm of stock Solution of CuCl2.0.775 gm of
CuCl2 is taken in 500 ml distilled water, so1000 ppm CuCl2 Solution is Prepared. Pipette out
25 ml solution from it and add to 475 ml distilledwater to prepare 500 ml of 50 ppm CuCl2
solution.The activation of adsorbent is carried out by treating it with concentrated sulphuric
acid (0.1N) and is kept in an oven maintained at a temperature range of 150ºC for 24hr.
The batch experiments are carried out in 250ml borosil conical flasks by shaking a pre-
weighed amount of the adsorbent with 100ml of the aqueous Copper solutions of known
concentration and pH value. The metal solutions were agitated on a magnetic stirrer 120 rpm
for a desired time. The samples were withdrawn from the stirrer at the pre determined time
intervals and adsorbent was separated by filtration. Copper concentration in the filtrate was
estimated using AAS.The experiments were carried out by varying the copper concentration
in the solution, pH. The adsorbent dosage gm/100ml for contact time. The adsorbent was
separated by filtered using filter paper.
% removal of copper = (C initial – C final) × 100/ C initial
Where C initial and Cfinal are the initial and final copper concentrations, respectively.[9]
IV. RESULTS AND DISCUSSION
Effect of pH:
Successful application of the adsorption technique demandsinnovation of cheap, non-
toxic, easily and locally availableadsorbents of known kinetic parameters and
sorptioncharacteristics.The uptake of Cu2+
ion as afunction of hydrogen ion concentration was](https://image.slidesharecdn.com/fullpaperproceeding-140331060233-phpapp02/85/Full-paper-proceeding-237-320.jpg)

![ISBN: 978-81-929339-0-0
National Conference on: “Trends and Challenges of Civil Engineering in Today’s Transforming World”
29th March, 2014, Civil Engineering Department S.N.P.I.T. & R.C., Umrakh
REFERENCES
[1] Dr. P. AkhilaSwathanthra, Dr. B. SarathBabu, M. SrinivasaRao, Dr.V.V.Basava “REMOVAL OF
COPPER FROM AQUEOUS SOLUTIONS BY USING SUGAR CANE BAGASSE” ISSN: 2320 1932
[2] HamizahMokhtar, NorhashimahMorad “Hyperaccumulation of Copper by Two Species of Aquatic Plants”
2011 International Conference on Environment Science and Engineering IPCBEE vol.8 (2011) © (2011)
IACSIT Press, Singapore.
[3] New Hampshire Department of environmental services “Environmental fact sheet” pg. no. 1-3.
[4] N Prapurna and M Vlswanatham “Adsorption kinetics of sugarcane bagasse for selective removal of Cr
(VI) and Cu (II) from aqueous solutions”
[5] PatilKishor P., Patil Vilas S., NileshPatil, Motiraya Vijay “Adsorption of Copper (cu 2+) & Zinc (zn2+)
Metal Ion from Waste Water by Using Soybean Hulls and Sugarcane Bagasse as Adsorbent” ISSN: 2279-
0543
[6] Shaliza Ibrahim, PiarapakaranSubramaniam and Nasim Ahmad Khan “Elimination of Heavy Metals from
Wastewater Using Agricultural Wastes as Adsorbents” Malaysian Journal of Science 23: 43 - 51 (2004)
[7] Thomas Anish Johnson, Niveta Jain, H C Joshi and Shiv Prasad “ Agricultural and agro-processing wastes
as low cost adsorbents for metal removal from wastewater” Vol. 647-658
[8] Zodape.G.V, Dhawan.V.L, Wagh.R.R, Sawant.A.S “Contamination of heavy metals in seafood marketed
from Vile Parle and Dadar markets of suburban areas of Mumbai (west coast of) India” International
Journal Of Environmental Sciences Volume 1, No 6, 2011.
[9] RaazMaheshwari, A K Chauhan, MahendraVyas, Bina Rani “REMOVAL OF HEAVY METALS
EMPLOYING BAGASSE” ISSN: 2249-4189.](https://image.slidesharecdn.com/fullpaperproceeding-140331060233-phpapp02/85/Full-paper-proceeding-239-320.jpg)


![ISBN: 978-81-929339-0-0
National Conference on: “Trends and Challenges of Civil Engineering in Today’s Transforming W o r l d ”
29th March, 2014, Civil Engineering Department S.N.P.I.T. & R.C., Umrakh
V.REFERENCES
[1] “Advancing and Integrating Construction Education, Research & Practice” August 4-5, 2008,
Karachi,, Pakistan
[2] Balaguru, P. N. (2005), “Nanotechnology and Concrete: Background, Opportunities and Challenges.”
Proceedings of the International Conference – Application of Technology in Concrete Design,
Scotland, UK, p.113-122.
[3] Bigley C. and Greenwood P. (2003). “Using Silica to Control Bleed and Segregation in Self-
Compacting Concrete.” Concrete, vol. 37, no. 2, p.43-45
[4] D.A. Koleva, “NANO MATERIALS FOR CORROSION CONTROL IN REINFORCED
CONCRETE”, TUDelft
[5] Dhir, R. K., Newlands, M. D., and Csetenyi, L. J. (2005). “Introduction.” Proceedings of the
International Conference – Application of Technology in Concrete Design, Scotland, UK, p. IV.
[6] Kuennen, K. (2004). “Small Science Will Bring Big Changes To Roads.” Better Roads
[7] Li, G. (2004). “Properties of High-Volume Fly Ash Concrete Incorporating Nano-SiO2.” Cement and
Concrete Research, vol.34, p.1043-1049.
[8] Liu, R., Zhang, Z., Zhong, R.; Chen, X.; Li, J.(2007) “Nanotechnology Synthesis Study: Research
Report”
[9] Mann, S. (2006). “Nanotechnology and Construction,” Nanoforum Report. www.nanoforum.org, May
30, 2008.
[10]MMFX Steel Corp. http://www.mmfx.com/products.shtml, May 30, 2008.
[11]Nanopedia (2008). “Carbon Nanotubes.” http://nanopedia.case.edu/image/nanotubes.jpg, January 16,
2008.
[12]RADU OLAR, NANOMATERIALS AND NANOTECHNOLOGIES FOR CIVIL ENGINEERING,
Universitatea Tehnică „Gheorghe Asachi” din Iaşi Tomul LIV (LVIII), Fasc. 4, 2011 Secţia
CONSTRUCŢII. ARHITECTURĂ
[13] Saurav, “Application Of Nanotechnology In Building Materials”, International Journal of Engineering
Research and Applications (IJERA) ISSN: 2248- 9622 www.ijera.com Vol. 2, Issue5, September-
October 2012, pp.1077-1082
[14]Song G, Gu H., Mo Y. L., Hsu T. T. C. and Dhonde H., , Concrete structural health monitoring using
embedded piezoceramic transducers, Smart Materials and Structures, 16: 959-968, 2007
[15] V. Kartik Ganesh, “NANOTECHNOLOGY IN CIVIL ENGINEERING”, European Scientific Journal November
edition vol. 8, No.27 ISSN: 1857 – 7881 (Print) e - ISSN 1857- 7431
[16]Yashar Moslehy, Haichang Gu, Abdeljalil Belarbi, Y.L. Mo and Gangbing Song; “Smart Aggregate-
Based Damage Detection of Circular RC columns under Cyclic Combined Loading”
[17]Zhi Ge, Zhili Gao, “Applications of Nanotechnology and Nanomaterials in Construction”, First
International Conference on Construction In Developing Countries (ICCIDC–I)](https://image.slidesharecdn.com/fullpaperproceeding-140331060233-phpapp02/85/Full-paper-proceeding-249-320.jpg)


![ISBN: 978-81-929339-0-0
National Conference on: “Trends and Challenges of Civil Engineering in Today’s Transforming W o r l d ”
29th March, 2014, Civil Engineering Department S.N.P.I.T. & R.C., Umrakh
′
= ∗ ( − )
Where,
A= area of the slab,
= thickness of monolith slab,
= specific weight of concrete,
=specific weight of water,
2. Bribiesca et al (1979): Obtain an expression for the time average of the square of the
total vertical force acting on the slab SP
2
as
= ∗ ∗
With
=
∝ +∝
∗ [ ∝ + (∝ − )] ∗ [ + ( − )]
Where,
= variance of the total pressure acting on the upper face of the slab.
= coefficient of distribution of pressure,
The thickness is given by,
=
−
( )
Where,
= standard deviation of the depth of flow at the centre of graviry of the area A, in m,
= useful life of concrete lining of the slab in seconds,
= main frequency of purpose fluctuations, Hz.
1. Toso et al. (1988): State that for practical purposes, the pressure fluctuations tend to
approach a definite limit, of the order of 80 to 90 % of the head.
By selecting an appropriate value of Cp from table given by him, the maximum
deviation from the mean pressure is worked out as
∆ =
This deviation pressure ∆ is assumed to act on the centre of an area 8y1 * 13y1 moving out of
the centre of the area, the pressure would drop off to the mean pressure.
The uplift force is given by
′
= ∆
Where,](https://image.slidesharecdn.com/fullpaperproceeding-140331060233-phpapp02/85/Full-paper-proceeding-259-320.jpg)


![ISBN: 978-81-929339-0-0
National Conference on: “Trends and Challenges of Civil Engineering in Today’s Transforming W o r l d ”
29th March, 2014, Civil Engineering Department S.N.P.I.T. & R.C., Umrakh
REFERENCES
[1] Building Construction by Dr. B.C. Punmia, Ashok Kumar Jain, Arun Kumar Jain
[2] IS 6313 (Part 1) :1981 CODE OF PRACTICE FOR ANTI-TERMITEMEASURES IN BUILDINGS
[3] IS 6313 (Part 2) :2001 CODE OF PRACTICE FOR ANTI-TERMITEMEASURES IN BUILDINGS
[4] www.termites101.org
[5] www.google.com
[6] www.gujaratpest.com
[7] www.ipm.ucdavis.edu
[8] www.pestworld.org
[9] www.wikipedia.com](https://image.slidesharecdn.com/fullpaperproceeding-140331060233-phpapp02/85/Full-paper-proceeding-273-320.jpg)


![ISBN: 978-81-929339-0-0
National Conference on: “Trends and Challenges of Civil Engineering in Today’s Transforming W o r l d ”
29th March, 2014, Civil Engineering Department S.N.P.I.T. & R.C., Umrakh
REFERENCES
[1] JAMES. M. FISHER S.E, Steel conference, expansion joints, where, when and how?
[2] Expansion Joints in Buildings: Technical Report No. 65, http://www.nap.edu/catalog/9801.html
[3] Mohammad Iqbal, D. Sc., P.E., S.E., Esq. October, 2010
[4] Structural Design - Discussions on design issues for structural engineers… Joint Publication of NCSEA |
CASE | SEI
[5] Kris zielonkaP.eng. Technical manager situra INC., A study of Practices in design, detailing and water
proofing, expansion joint in North America.
[6] Technical note 63, joints in concrete buildings, sept 2004.
[7] Gurcharan Singh, Building construction and materials, standard book house, 12th edition 2012
[8] http://www.expertsmind.com
[9] http://www.pavement.com
[10] http://www.stpltd.com/html/Presentation/Sealants%20and%20Additives/ShaliSeal%20PS%20PG.pdf
[11] http://www.heidelbergcement.com/uk/en/hanson/products/blocks/technical_information/thermalite_move
ment_control.htm
[12] http://besser.tsoa.nyu.edu/impact/f95/Cdwa/MATERIAL.HTML
[13] http://www.nbmcw.com/articles/waterproofing-construction-chemicals/3202-treating-expansion-joints-
with-koster-joint-tape-system.html
[14] https://www.google.co.in/?gws_rd=cr&ei=llT3UpPSEoyCrgemnYHwDA#q=Wind+effect+on+buildings+i
mages
[15] https://www.google.co.in/?gws_rd=cr&ei=llT3UpPSEoyCrgemnYHwDA#q=Thermal+effect+on+building
s+images
[16] https://www.google.co.in/?gws_rd=cr&ei=llT3UpPSEoyCrgemnYHwDA#q=Loads+effect+on+buildings+
images
[17] https://www.google.co.in/?gws_rd=cr&ei=llT3UpPSEoyCrgemnYHwDA#q=Earth+quake++effect+on+bu
ildings+images
[18] https://www.google.co.in/?gws_rd=cr&ei=llT3UpPSEoyCrgemnYHwDA#q=Problems+due+to+Expansio
n+Joint+images](https://image.slidesharecdn.com/fullpaperproceeding-140331060233-phpapp02/85/Full-paper-proceeding-288-320.jpg)


![ISBN: 978-81-929339-0-0
National Conference on: “Trends and Challenges of Civil Engineering in Today’s Transforming W o r l d ”
29th March, 2014, Civil Engineering Department S.N.P.I.T. & R.C., Umrakh
Figure 5: Comparison of dead load for circular and rectangular tank
CONCLUSIONS
Total water load in Rectangular tank is slightly higher than water load in circular tank
A hoop tension force for Circular tank is lower compare to Rectangular tank for higher
capacity.
An axial force in column due to total water load in Circular tank is lower compare to
Rectangular tank for higher capacity.
Software results compare to IS code calculation is higher.
REFERENCES
[1] S. Ramamrutham , Design of Reinforced Concrete Structures
[2] Shah H.J. Vol-2, Design of Reinforced Concrete Structures
[3] IS code 3370, Part-I,II,III,IV
[4] IS code 456-2000
50000 60000 75000 90000 100000
Dead load for circular (KN) 788.935 939.329 1017.604 1126.422 1143.711
Dead load for rectangular (KN) 828.47 889.48 1056.5 1136.46 1155.53
0
200
400
600
800
1000
1200
1400
Dead load (KN)
Capacity (liter)
COMPARISON OF DEAD LOAD FOR CIRCULAR AND
RECTANGULAR TANK](https://image.slidesharecdn.com/fullpaperproceeding-140331060233-phpapp02/85/Full-paper-proceeding-294-320.jpg)


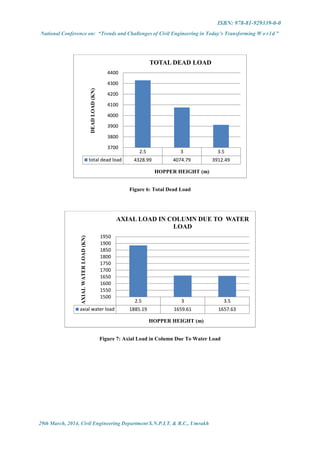

![ISBN: 978-81-929339-0-0
National Conference on: “Trends and Challenges of Civil Engineering in Today’s Transforming W o r l d ”
29th March, 2014, Civil Engineering Department S.N.P.I.T. & R.C., Umrakh
Figure 10: Axial Load in Column Due To Water Load
CONCLUSIONS
In Intz tank, Hoop tension force, Axial load in column due to water load, dead load, total
dead load & total water load is minimum for the 5m height of wall.
tank, Hoop tension forces is minimum for 3m height of hopper.
In Intz tank, Axial load in column, total dead load and total water load is minimum for
3.5m height of hopper.
In Intz tank, Hoop tension force is minimum for 9.5m bottom diameter.
In Intz tank, Dead load of water tank is minimum for 10m bottom diameter.
In Intz tank, Water load of tank is minimum for 10.5m bottom diameter.
In Intz tank, Axial load in column due to water load is minimum for 10.5m bottom
diameter.
In Intz tank, Axial load in column due to dead load is minimum for 9.5m bottom
diameter.
As per reference book hoop tension s maximum at base but software gives the maximum
hoop tension at H/3 at the base.
Software results compare to IS code calculation is higher.
REFERENCES
[1] S. Ramamrutham , Design of Reinforced Concrete Structures
[2] Shah H.J. Vol-2, Design of Reinforced Concrete Structures
[3] IS code 3370, Part-I,II,III,IV
[4] IS code 456-2000
9.5 10 10.5
axial water load 1663.89 1885.19 1656.81
1500
1550
1600
1650
1700
1750
1800
1850
1900
1950
AXIALWATERLOAD(KN)
BOTTOM DIAMETER (m)
AXIAL LOAD IN COLUMN DUE TO WATER
LOAD](https://image.slidesharecdn.com/fullpaperproceeding-140331060233-phpapp02/85/Full-paper-proceeding-303-320.jpg)


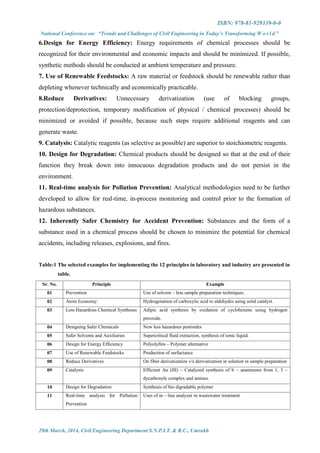


![ISBN: 978-81-929339-0-0
National Conference on: “Trends and Challenges of Civil Engineering in Today’s Transforming W o r l d ”
29th March, 2014, Civil Engineering Department S.N.P.I.T. & R.C., Umrakh
CRITERIA FOR NON POTABLE WATER
Nitul D. Limbasiya1
, Kamal Rana2
, Mitali Shah3
,
1
Student, ME Environmental Engineering, Sarvajanik College of Engineering & Technology,
Surat
2
Student, ME Environmental Engineering, Sarvajanik College of Engineering & Technology,
Surat
3
Asst. Professor, Civil Engineering Department, Sarvajanik College of Engineering &
Technology, Surat.
E-mail ID: kamalrana681983@gmail.com, mitali.shah@scet.ac.in
Abstract: Non-potable water is water that has not of drinking water quality, but which may
still be used for many other purposes, Typical non potable uses include irrigation,
maintenance, and some non-food producing industrial applications. Sources of non-potable
water are rainwater harvesting, storm water, gray water, black water, foundation Drainage,
untreated environmental water sources – wells and rivers or lakes. Water Quality Issues for
reuse of non potable water are Nutrients, TDS, suspended solids, chlorides, odor, hardness,
chloride and color. So, for proper quality improvement secondary treatment, filtration using
polymers, denitrification, disinfection and reverse osmosis techniques are used. Treated
water will use for environmental and recreational reuse, groundwater recharge, agricultural
reuse, industrial reuse, urban reuse.
Keywords: Non potable water, water quality, treatments, recreational uses
I. Introduction
Water that has not been examined, properly treated, and not approved by appropriate
authorities as being safe for consumption. Non-potable water is water that has not of drinking
water quality, but which may still be used for many other purposes, Water use for means
other than drinking, cooking or showering/bathing. Typical non potable uses include
irrigation, maintenance, and some non-food producing industrial applications (e.g., cooling
tower makeup). Where water has not been treated, it is considered to be a non-manufactured
substance under the Act, but there are still statutory obligations on the supplier and end user
of this water. [4]](https://image.slidesharecdn.com/fullpaperproceeding-140331060233-phpapp02/85/Full-paper-proceeding-314-320.jpg)
![ISBN: 978-81-929339-0-0
National Conference on: “Trends and Challenges of Civil Engineering in Today’s Transforming W o r l d ”
29th March, 2014, Civil Engineering Department S.N.P.I.T. & R.C., Umrakh
II. Materials and methods
Sources of non-potable water
Rainwater harvesting
Rainwater harvesting is a technology used to collect, convey and store rainwater for later use
from relatively clean surfaces such as a roof, land surface or rock catchment.
Storm water
Storm water is water that originates during precipitation events. It may also be used to apply
to water that originates with snowmelt that enters the storm water system. It is including that
from dams, creeks, and rainwater tanks also
Gray water
Gray water is reusable wastewater from residential, commercial and industrial bathroom
sinks, bath tub shower drains, and clothes washing equipment drains. Gray water is reused
onsite, typically for landscape irrigation.
Black water
Black water used to describe wastewater containing biodegradable matter and urine. It is also
known as brown water, foul water, or sewage. It is distinct from grey water or selvage, the
residues of washing processes.
Foundation Drainage
They're pipes located under your basement walls that collect ground water to help keep it from
damaging your home or anything you store in the basement by preventing water from seeping through
the floor or walls. [1]
Untreated environmental water sources – wells and rivers or lakes.
Water Quality Issues
• Cooling Towers
– Nutrients, TDS, suspended solids, chlorides, odor, hardness, bacteriological
• Agriculture
– TDS, boron, chloride, chlorine, suspended solids
• Landscaping / Single Family Homes
– TDS, boron, chloride, chlorine, SS, odors
• Toilets and Urinal Flushing
– Suspended solids, color, odor
• Water Features
– Nutrients, color
• Textile Mill](https://image.slidesharecdn.com/fullpaperproceeding-140331060233-phpapp02/85/Full-paper-proceeding-315-320.jpg)
![ISBN: 978-81-929339-0-0
National Conference on: “Trends and Challenges of Civil Engineering in Today’s Transforming W o r l d ”
29th March, 2014, Civil Engineering Department S.N.P.I.T. & R.C., Umrakh
– Color, inorganic, chlorine, odor
Water reuses drivers
The main drivers for water reuse development worldwide are:
Increasing water demands to sustain industrial and population growth. This is the most
common and important driver for dry and water-abundant regions in developed, developing,
and transitional countries.
Water scarcity and droughts, particularly in arid and semi-arid regions. In this case,
reclaimed water is a vital and drought-proof water source to ensure economic and agricultural
activities.
Environmental protection and enhancement in combination with wastewater management
needs represent an emerging driver, in a number of industrialized countries, coastal areas, and
tourist regions. In areas with more stringent wastewater discharge standards, such as in
Europe, Australia, and South Africa, wastewater reuse becomes a competitive alternative to
advanced water treatment from both economic and environmental points of view.
Socio-economic factors such as new regulations, health concerns, public policies, and
economic incentives are becoming increasingly important to the implementation of water
reuse projects.
Public health protection is the major driver in developing countries where lack of access to
fresh water supplies coupled with high market access in urban and per-urban areas, drives
untreated reuse in agriculture.
Trends in Water Reuse
Moving forward, there are a number of trends in treatment for water reuse that are popular,
including:
Dual systems
UV for disinfection and advanced oxidation
Membrane processes. [5]
Uses of non-potable water
Urban Reuse
1. Commercial uses such as vehicle washing facilities, laundry facilities, window washing,
and mixing water for pesticides, herbicides, and liquid fertilizers](https://image.slidesharecdn.com/fullpaperproceeding-140331060233-phpapp02/85/Full-paper-proceeding-316-320.jpg)

![ISBN: 978-81-929339-0-0
National Conference on: “Trends and Challenges of Civil Engineering in Today’s Transforming W o r l d ”
29th March, 2014, Civil Engineering Department S.N.P.I.T. & R.C., Umrakh
To establish saltwater intrusion barriers in coastal aquifers.
To provide further treatment for future reuse.
To augment potable or non-potable aquifers.
To provide storage of reclaimed water for subsequent retrieval and reuse,
To control or prevent ground subsidence. [2]
Non potable water systems
(Source: www.cwwa.ca)](https://image.slidesharecdn.com/fullpaperproceeding-140331060233-phpapp02/85/Full-paper-proceeding-318-320.jpg)
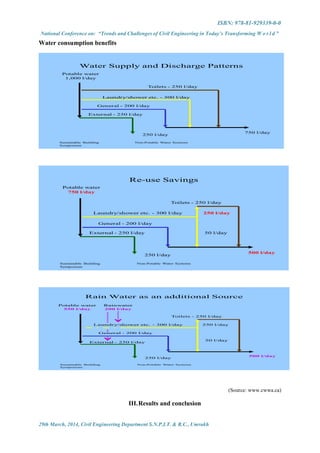
![ISBN: 978-81-929339-0-0
National Conference on: “Trends and Challenges of Civil Engineering in Today’s Transforming W o r l d ”
29th March, 2014, Civil Engineering Department S.N.P.I.T. & R.C., Umrakh
Lack of available funding
Although many larger municipalities have constructed water reuse projects, smaller utilities
have not, often due to lack of funding support from Federal and/or state governments. Lack
of funding is probably a major constraint around the world.
Need for public education
Local decision- makers, especially where rainfall is abundant, do not consider water reuse as
an option when considering water resource alternatives. An educational campaign is needed
to provide information to politicians on the success stories, costs, and benefits of water
reuse.
Better documentation of the economics of water reuse
Although several practitioners have documented the need for a complete accounting of
financial and social costs and, non-monetizable benefits, such an accounting has yet to be
accomplished. A well written, documented economic treatise on water reuse is needed as a
resource.
Additional research
Most wastewater, especially in arid and semi-arid areas, needs to be recycled to serve
growing populations. All of this water cannot be used to irrigate golf courses or for industrial
applications. These highly treated reclaimed waters will need to be used to irrigate edible
crops and for indirect potable reuse. The latter application necessitates substantial research to
be able to assure the public of the chemical and microbiological safety of reclaimed water.
Leadership by governments
Governments have a leadership role to play (a) in assuring adequate water resources for
regional and multi-jurisdictional areas, (b) to practice water use efficiency at federal facilities,
and (c) in providing funding to promote water use efficiency and conservation.
Source control and collection
Cost factor
Appropriate treatment (multiple barriers) availability
Storage, transmission and distribution protection
Cross connection control / backflow prevention, pipe line separation. [3]](https://image.slidesharecdn.com/fullpaperproceeding-140331060233-phpapp02/85/Full-paper-proceeding-320-320.jpg)

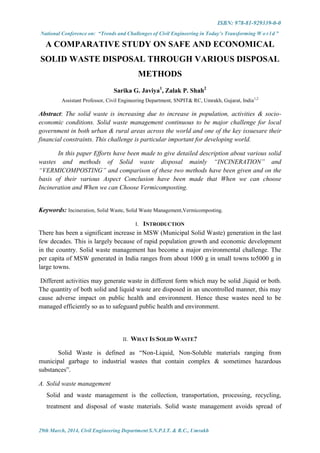


![ISBN: 978-81-929339-0-0
National Conference on: “Trends and Challenges of Civil Engineering in Today’s Transforming W o r l d ”
29th March, 2014, Civil Engineering Department S.N.P.I.T. & R.C., Umrakh
After in-depth study for different solutions for effective solid waste management two
solutions i.e., Incinerator and Vermi-composting were found suitable for solid waste
disposal.
From the above comparison it is clearly seen that incineration is the best solution for
solid waste disposal from the point of view of area & time required, while
vermicomposting is best solution for solid waste disposal from the point of view of
initial cost, service life, efficiency and maintenance.
When population and quantity of waste is more we can prefer incineration process
and when population and quantity of waste is less we can prefer vermicomposting.
ACKNOWLEDGMENT
The author is thankful to Mr. J.N.Patel, ChairmainVidyabharti Trust, Mr. K.N.Patel,
Hon. Secretary, Vidyabharti Trust, Dr. H.R.Patel, Director, Dr.J.A.Shah, Principal,
S.N.P.I.T.&R.C.,Umrakh, Bardoli, and Dr. Neeraj D. Sharma Head of Civil Engineering
Department, for their motivational & infrastructural supports to carry out this research.
REFERENCES
[1]Chandak S2010“Community-based Waste Management and Composting for waste”
[2]Frank kreith and George tchobanoglous2002 “Hand Book of Solid Management” McGraw-Hill Publishing,
june.
[3]Karmengam N, Alagermalai K and Daniel T. 1999. “Effect of vermicomposting”
[4]Solid and Liquid Waste Management in Rural Areas: A Technical Report; New Delhi.
[5]Solid Waste Management Manual 2000, Central Public Health and Environmental Engineering Organization
(CPHEEO), Government of India.](https://image.slidesharecdn.com/fullpaperproceeding-140331060233-phpapp02/85/Full-paper-proceeding-329-320.jpg)


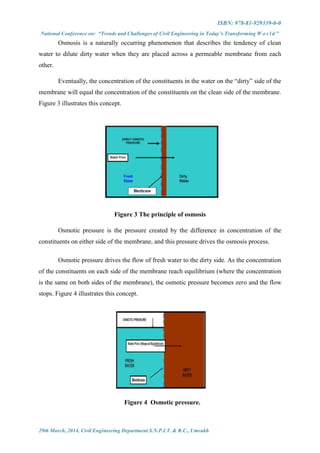


![ISBN: 978-81-929339-0-0
National Conference on: “Trends and Challenges of Civil Engineering in Today’s Transforming W o r l d ”
29th March, 2014, Civil Engineering Department S.N.P.I.T. & R.C., Umrakh
VII. CONCLUSION
Membrane filtration technology has definite utility in reducing the cost of dyeing and
reducing pollution. Reactive dyes need 60-80 g/l of salt – usually common salt. 75% - 85% of
this salt can be recovered from EDL and first wash liquor free from spent dyes which are
rejected as concentrate. This concentrate can be further concentrated and eventually
evaporated to dispose off solids by incineration. These solids are non-toxic and except for
colour they are harmless. The salt recovered in the process can be recycled.
The age old concept of having huge Effluent Treatment Plants and concentrating all
research efforts on efficient washing, new washing machinery development, reduced material
to liquor ratio (M:L) for processing are not relevant today. The relevant aspect is to select
membrane of appropriate pore size for membrane filtration for specific task. Rather than
talking in terms of Nano filtration or ultrafiltration, it is relevant and more scientific to talk in
terms of membrane of specific molecular weight cut off (MWCO) for specific task.
REFERENCES
[1] Wastewater Engineering Treatment and Reuse – By Metcalf and Eddy.
[2] http://www.mdpi.com/2073-4344/2/4/572
[3] http://www.advantecmfs.com/catalog/filt/membrane.pdf
[4] http://www.nesc.wvu.edu/pdf/dw/publications/ontap/2009_tb/membrane_DWFSOM43.pdf
[5] http://www.pall.in/main/laboratory/literature-library-details.page?id=729](https://image.slidesharecdn.com/fullpaperproceeding-140331060233-phpapp02/85/Full-paper-proceeding-339-320.jpg)
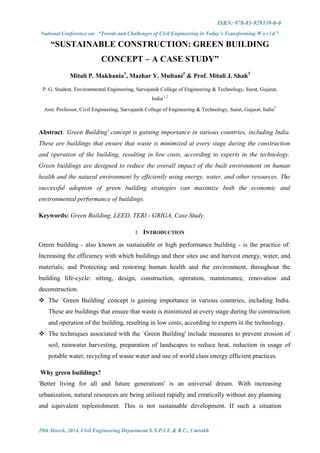


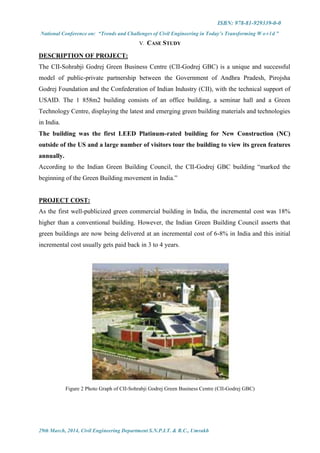


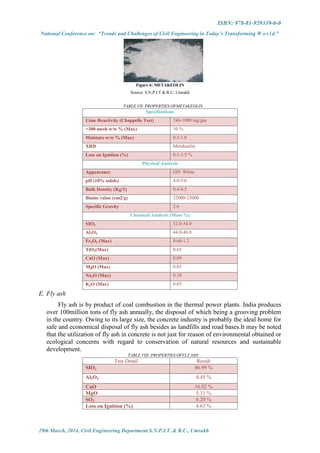
![ISBN: 978-81-929339-0-0
National Conference on: “Trends and Challenges of Civil Engineering in Today’s Transforming W o r l d ”
29th March, 2014, Civil Engineering Department S.N.P.I.T. & R.C., Umrakh
III. DESIGN MIX METHODOLOGY
A Concrete M25 grade was designed as per IS: 10262-2009 method and the same was
used as reference mix. The design mix proportion is asbelow :
TABLE IX: MIX DESIGN PROPORTION
For 1 m3
Water Cement Fine Aggregate Coarse Aggregate
By Weight [kg] 200 L 400 665 1085
TABLE X: DETAILS 0F REPLACEMENT OF CEMENT & RIVER SAND
ID Mark %River sand replacement
by Manufactured sand
% Cement Replacement by Mineral
Admixture (Metakeolin& Fly ash)
Reference Mix 0 % 0 %
MFMK602505 60 % Manufactured Sand 25 % Fly ash + 5 % Metakeolin
MFMK60257.5 60 % Manufactured Sand 25 % Fly ash + 7.5 % Metakeolin
MFMK602510 60 % Manufactured Sand 25 % Fly ash + 10 % Metakeolin
MFMK603005 60 % Manufactured Sand 30 % Fly ash + 5 % Metakeolin
MFMK60307.5 60 % Manufactured Sand 30 % Fly ash + 7.5 % Metakeolin
MFMK603010 60 % Manufactured Sand 30 % Fly ash + 10 % Metakeolin
MFMK603505 60 % Manufactured Sand 35 % Fly ash + 5 % Metakeolin
MFMK60357.5 60 % Manufactured Sand 35 % Fly ash + 7.5 % Metakeolin
MFMK603510 60 % Manufactured Sand 35 % Fly ash + 10 % Metakeolin
MFMK1002505 100 % Manufactured Sand 25 % Fly ash + 5 % Metakeolin
MFMK100257.5 100 % Manufactured Sand 25 % Fly ash + 7.5 % Metakeolin
MFMK1002510 100 % Manufactured Sand 25 % Fly ash + 10 % Metakeolin
MFMK1003005 100 % Manufactured Sand 30 % Fly ash + 5 % Metakeolin
MFMK100307.5 100 % Manufactured Sand 30 % Fly ash + 7.5 % Metakeolin
MFMK1003010 100 % Manufactured Sand 30 % Fly ash + 10 % Metakeolin
MFMK1003505 100 % Manufactured Sand 35 % Fly ash + 5 % Metakeolin
MFMK100357.5 100 % Manufactured Sand 35 % Fly ash + 7.5 % Metakeolin
MFMK1003510 100 % Manufactured Sand 35 % Fly ash + 10 % Metakeolin
IV. COMPRESSIVE STRENGTH TEST
Compressive strength tests were performed on compression testing machine using cube
samples at 7 days and 14 days. Three samples for each component were casted and
thentested.The average strength values are reported in this paper.
Figure 4: Set up of Compressive Testing Machine
Source: S.N.P.I.T & R.C, Umrakh.](https://image.slidesharecdn.com/fullpaperproceeding-140331060233-phpapp02/85/Full-paper-proceeding-357-320.jpg)

![ISBN: 978-81-929339-0-0
National Conference on: “Trends and Challenges of Civil Engineering in Today’s Transforming W o r l d ”
29th March, 2014, Civil Engineering Department S.N.P.I.T. & R.C., Umrakh
and hence reduces the production of GHGs associated with production of cement. It
also helps to solve the problem of dumping fly ash which is generated from Thermal
Power Stations in our Country.
ACKNOWLEDGMENT
The authors are thankfully acknowledge to Mr. J. N. Patel, ChairmainVidyabharti Trust, Mr.
K.N.Patel, Hon. Secretary, Vidyabharti Trust, Dr. H. R. Patel, Director, Dr. J. A. Shah,
Principal, S.N.P.I.T.&R.C.,Umrakh, Bardoli, Gujarat,India for their motivational &
infrastructural supports to carry out this research, Also, Dr. Neeraj D. Sharma, HOD Civil
Department, SNPIT & RC, Umrakh.
REFERENCES
PAPERS:-
[1] Mohammed S. Lambadi, Collette cardigan and Sean McKenna “Trends and developments in green cement
and concrete technology” - International Journal of Sustainable Built Environment, May 2013.
[2] Oscae Ortiz, Francesc castells and Guido Sonnemann “Sustainability in the construction industry: A review
of recent developments based on LCA” – Construction and building materials, Volume 23, issue 1,
January 2009.
[3] “Dundee sustainable development Guide for Construction” – Dundee City Council
[4] “Sustainable Construction - Innovation in action” by KyliaUbargang, Veronica Gailbrath and Alison Mai
Ling Tam, February 2004
[5] “Strategy for Sustainable Construction” – by HM Government and Strategic forum for Construction, June
2008.
[6] “21 Agenda for Sustainable Construction in Developing Countries” – A discussion document, WSSD
edition, Published by the CSIR Building and Construction Technology, Pretoria, 0001
[7]Dr. S. Elavenil and B. Vijaya “Manufactured Sand, A Solution And An Alternative To River Sand And In
Concrete Manufacturing” Journal of Engineering, Computers & Applied Sciences, ISSN No: 2319‐5606,
Volume 2, N0.2 February 2013
[8] Priyanka A. Jadhav and Dilip K. Kulkarni “An experimental investigation on the properties of concrete
containing manufactured sand” International Journal of Advanced Engineering Technology, E-ISSN 0976-
3945, Vol.III/ Issue II/April-June, 2012
[9] VikasSrivastava, Rakesh Kumar & V. C. Agarwal“Metakaolin inclusion: Effect on mechanical properties of
concrete” J. Acad. Indus. Res. Vol. 1(5), ISSN: 2278-5213, October 2012
[10] B. B. Patil and P. D. kumbhar “Strength and Durability Properties of High Performance Concrete
incorporating High Reactivity Metakaolin” International Journal of Modern Engineering Research, ISSN:
2249-6645, Vol.2, Issue.3, May-June 2012
[11] David Trejo and CekiHalmen “Evaluation of Metakaolin for Applications in Concrete”
[12] Ganesh Babu K. and Dinakar P. “Strength efficiency of metakaolin in concrete”
Structural Concrete _ 2006 -7 No 1 P.P.31-29
[13] Dr. S. L. Patil, J. N. Kale , S. Suman “Fly ash concrete: a technical analysis for Compressive strength”
International Journal of Advanced Engineering Research and Studies, E-ISSN2249–8974, Vol. II/ Issue
I/Oct.-Dec.,2012
[14] J. D. Bapat; S. S. Sabnis; C. V. Hazaree; and A. D. Deshchowgule “Ecofriendly Concrete with High
Volume of Lagoon Ash” JOURNAL OF MATERIALS IN CIVIL ENGINEERING © ASCE /
MAY/JUNE 2006
[15] Suresh Chandra pattanaik and Dr. AkshayakumarSabat “A study of NALCO Fly ash on Compressive
strength for effective use in high volume mass concrete for a sustainable development” International
Conference on Sustainable Technologies for Concrete Constructions, September 2010
[16] “ Investigation on Fly ash as a partial cement replacement in concrete” by faseyemi v. a., technical
manager, al andalus factory for cement products, doha – qatar.](https://image.slidesharecdn.com/fullpaperproceeding-140331060233-phpapp02/85/Full-paper-proceeding-359-320.jpg)
![ISBN: 978-81-929339-0-0
National Conference on: “Trends and Challenges of Civil Engineering in Today’s Transforming W o r l d ”
29th March, 2014, Civil Engineering Department S.N.P.I.T. & R.C., Umrakh
IS CODES:-
[1] IS516-1959,“MethodsofTestsforStrengthofConcrete”, Bureau ofIndianStandards, New Delhi.
[2] IS 4031 -1988, “Methods for Physical Tests for Hydraulic Cement”, Part 6- Determination of
Compressive Strength of Hydraulic Cement Other than Masonry Cement, Bureau ofIndianStandards, New
Delhi.
[3] IS10262-2009,“ISMethod ofMixDesign”,Bureau of Indian Standards, New Delhi.
[4] IS 12269 -1987, “Specification for 53 Grade OPC”, Bureau ofIndianStandards, New Delhi.](https://image.slidesharecdn.com/fullpaperproceeding-140331060233-phpapp02/85/Full-paper-proceeding-360-320.jpg)
![ISBN: 978-81-929339-0-0
National Conference on: “Trends and Challenges of Civil Engineering in Today’s Transforming W o r l d ”
29th March, 2014, Civil Engineering Department S.N.P.I.T. & R.C., Umrakh
ANALYSIS OF BED LOAD FOR STEEP SLOPE CHANNEL
Ms.P.R.Khokhar1
, Dr.S.M.Yadav2
, Mrs.S.I.Waikhom3
Research Scholar, M.E. (Civil), Dr. S. & S. S. Ghandhy Government Engineering College, Surat,
Gujarat, India1
Professor, Civil Engineering Department, SVNIT, Surat, Gujarat, India2
Associate Professor, Civil Engineering Department, Dr. S. & S. S. Ghandhy Government Engineering
College, Surat, Gujarat, India3
Abstract: Bed load transport rate is defined as the maximum bed load per unit width that a
particular discharge can transport at a certain slope.Prediction of bed load is of primary
importance for river engineering, fluvial geomorphology, eco-hydrology, environmental
surveys and management, and hazard prediction. A large number of studies have been done
by many researchers to test the predictability of various sediment transport methods covering
a wide range of flow conditions and sediment types. In the Present study, bed load transport
rate is computed using different approaches for steep slope and compared with the actual
experimental result using MPM, Graeme M. Smart, Rickenmann, Cheng, Abrahams and
Camenen and Larson approaches. The computed bed load is compared with the actual
measured values for Cao data set. A statistical analysis is carried out by computing rmse,
inequality ratio and discrepancy ratio. For Cao data set, bed load models shows good
agreement for Graeme M. Smart, Rickenmann and Camenen and Larson.
Keywords: Alluvial Channel, Steep slope, Bed load transport, Flume data, Comparison.
I. INTRODUCTION
Individual Particles move along the bed of the water course by rolling, sliding or occasionally
in jumps (Saltation) which is generally termed as bed load. Bed Load Transport in alluvial
rivers is the principle link between river hydraulics and river form and is responsible for
building and maintain the channel geometry (Parker, 1979). Bed load prediction is of primary
importance for river engineering, fluvial geomorphology, eco-hydrology, environmental
surveys and management and hazard Prediction (Recking, 2009). Bed load transport can be
described as a random phenomenon that is generated by the interaction of turbulent flow
structure with the materials of the bed surface (Einstein, 1950).
Data available for researchers, covering a wide range of sediment diameters, slopes, Shields
numbers θ = / [g ( – ρ) D] (where =bed shear stress, ρ = water density, = sediment
density, and D = grain diameter) and sediment transport rates for computing bed load
transport. However, most of them are for mild slope.](https://image.slidesharecdn.com/fullpaperproceeding-140331060233-phpapp02/85/Full-paper-proceeding-361-320.jpg)
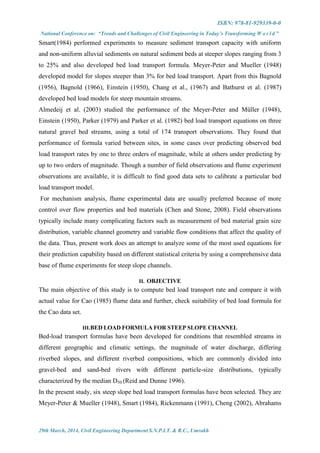
![ISBN: 978-81-929339-0-0
National Conference on: “Trends and Challenges of Civil Engineering in Today’s Transforming W o r l d ”
29th March, 2014, Civil Engineering Department S.N.P.I.T. & R.C., Umrakh
(2003) and Camenen and Larson (2005).They approaches used to determine bed load for
steep slope channel is discussed briefly as under
[1] Meyer-Peter and Mueller (1948)
Meyer-Peter and Mueller (1948) proposed the formula on the basis of experiments with
uniform sediments of various densities and channel slopes ranging from 0.04% to 2%.
Ф = 8( − ) .
… … … … … … … … … … … … … … . . … (1)
Where, Ф= the dimensionless sediment transport rate, = the critical dimensionless shear
stress introduced by Shields, and = dimensionless shear stress is computed using,
=
H. S
[(s − l)D] .
… . . … … … … … … … … … … … … … . . (2)
[2]Graeme M. Smart (1984)
For alluvial materials with mean grain size greater than 0.4 mm (0.016 in.), the sediment
transport capacity can be predicted for flows on slopes from 0.04 to 20% by following
equation:
Ф = 4.2 . . ( − ) … … … … . . … . … . . … … … … . . (3)
Where, H = measured flow depth, S = channel slope, d = mean grain diameter, = critical
Shield's parameter—slope adjusted, p = sediment density, s = ratio of sediment density to
water density (dimensionless quantity), C = flow resistance factor (conductivity) a
dimension- less quantity,
=
V
( ) .
… … … … … … … … … . . … … … … … … . (4)
= dimensionless shear stress (Shield's parameter) is computed using,
=
H. S
[(s − l)D] .
… . . … … … … … … … … … … … … … . . (5)
[3] Rickenmann (1991)
Rickenmann (1991) proposed a shear-stress-based equation to compute bed load transport.
The equation is based on 252 laboratory experiments conducted by Meyer-Peter and Muller](https://image.slidesharecdn.com/fullpaperproceeding-140331060233-phpapp02/85/Full-paper-proceeding-363-320.jpg)
![ISBN: 978-81-929339-0-0
National Conference on: “Trends and Challenges of Civil Engineering in Today’s Transforming W o r l d ”
29th March, 2014, Civil Engineering Department S.N.P.I.T. & R.C., Umrakh
[1948], Smart and Jaeggi [1983], and Rickenmann [1991] for a slope ranging from 0.0004 to
0.2.
Ф = 3.1
.
θ .
(θ − θ ) . ( − 1) .
… … … … … … … … . … … … . . (6)
Where, s = ρs/ρ is the ratio of sediment density to water density, and = dimensionless shear
stress (Shield's parameter) is computed using,
=
. S
[(s − l)D] .
… . . … … … … … … … … … … … … … … . . (7)
The critical dimensionless shear stress at the initiation of bed load transport θ is determined
as
θc =
S
[(s − l)D ] .
… . . … … … … … … … … … … … … … . . (8)
Where, is the critical hydraulic radius corresponding to the critical discharge.
[4] Cheng (2002)
For grain sizes 0.4 to 29 mm and slope ranging up to 0.02 m/m. Cheng (2002) developed
following equation for bed load,
Ф = 13 ∗ θ .
exp −
0.05
θ . … … … … … … … … . . … … … … … . (9)
Where, = dimensionless shear stress (Shield's parameter)
[5] Abrahams (2003)
For bed load in sheet flow, with grain sizes ranging from 3 to 10.5mm and river slopes from
0.03 to 0.21. Abrahams (2003) developed following equation for bed load,
Ф =
θ .
V
V∗
… . . … … … … … … … … … … … . . … … . . . (10)
Where, = dimensionless shear stress (Shield's parameter),V = mean flow velocity and V∗=
Shear velocity is computed using,](https://image.slidesharecdn.com/fullpaperproceeding-140331060233-phpapp02/85/Full-paper-proceeding-364-320.jpg)
![ISBN: 978-81-929339-0-0
National Conference on: “Trends and Challenges of Civil Engineering in Today’s Transforming W o r l d ”
29th March, 2014, Civil Engineering Department S.N.P.I.T. & R.C., Umrakh
V∗ = … … … … … … … … … … … … … … … … . (11)
[6] Camenen and Larson (2005)
For grain sizes 0.084 to 200 mm and river slopes from 0.03 to 0.2. Camenen and Larson
(2005) developed following equation for bed load,
Ф = 12 ∗ θ .
exp −
4.5 ∗ θ
θ
… … … … … … … … … … … (12)
Where, = dimensionless shear stress (Shield's parameter), = critical Shield's parameter
IV.DATA SET
In the present study Cao (1985) data set has been used. Range of data used in the present
analysis are given in Table 1.
Table 1 Flume experiment data set by Cao
Author Year Diameter
D (mm)
Standard
deviation
Σ
Sediment
Density
ρs (Kg/m3)
Slope
S(m/m)
Width
of
flume
W(m)
Cao 1985 22.2 mm 1.60 2570 0.01000<S<0.09000 0.600
44.3 mm 1.54 2750 0.03000<S<0.09000 0.600
11.5 mm 1.59 2650 0.01000 0.600
V. DATA ANALYSIS
Cao flume data set is used to compute dimensionless bed load transport using Meyer-Peter &
Mueller, Smart, Rickenmann, Cheng, Abrahams and Camenen and Larson equation. Table 2
shows the comparison between actual and computed dimensionless bed load transport.](https://image.slidesharecdn.com/fullpaperproceeding-140331060233-phpapp02/85/Full-paper-proceeding-365-320.jpg)


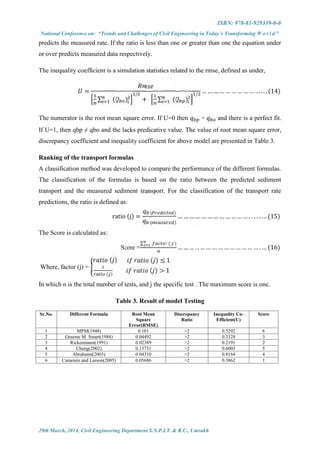


![ISBN: 978-81-929339-0-0
National Conference on: “Trends and Challenges of Civil Engineering in Today’s Transforming W o r l d ”
29th March, 2014, Civil Engineering Department S.N.P.I.T. & R.C., Umrakh
The rmse, inequality ratio, and discrepancy ratio suggest good agreement between
measured and calculated bed load transport rate for Smart ,Rickenmann and Camenen
and Larson
ACKNOWLEDGMENT
The authors are thankfully acknowledge to Mr. J.N.Patel, Chairmain Vidyabharti Trust, Mr.
K.N.Patel, Hon. Secretary, Vidyabharti Trust, Dr. H.R.Patel, Director, Dr.J.A.Shah,
Principal, S.N.P.I.T.&R.C.,Umrakh, Bardoli, Gujarat,India for organizing the conference and
for inviting the papers from the various sectors of Civil Engineering field.
REFERENCES
[1] Abrahams, A.D. and Li.G. “Effect of saltating sediment on flow resistance on flow resistance and bed
roughness in overland flow”, Earth surf. Proc. La., 33,953-960.1980.
[2] Almedeij, J.H., diplas,P., “Bed-load transport in gravel-bed streams with unimodal sediment.”,Journal of
Hydraulic Engineering 129(11),896-904,2003.
[3] Bagnold , R.A. , “The flow of cohesionless grains in fluids.”,Proc.Roy.Soc.,249,A964,235-296,1956.
[4] Bagnold,R.A.,“An approach to the sediment transport problem from general physics,”
U.S.Geo.Surv.Prof.Pap., 422(1), 37, 1966.
[5] Bathurst, J.C.,Graf, W.H. and Cao,H.H., “Bed load discharge equations for steep mountains rivers.”
SedimentTransportingravel-bedrivers,C.R.Thorne,J.C.Bathurst,andR.D.Hey,eds.,Wiley,Chichester,U.K.,pp.453-
477,1987.
[6] Bravo-Espinosa,M., “Prediction of bed load discharge for alluvial channels, PhD dissertation, Univ. of
Arizona, Tueson, Arizona,(1999)
[7] Camenen, B. and Larson, M., “A general formula for non – cohesive bed load sediment transport”,
Estuarine coastal shelf sci., 63 (1-2), 249-260, 2005.
[8] Cao, H. H. “Resistance hydraulique d’un lit à gravier mobile àpente raide; étude expérimentale.” Ph.D.
thesis, Ecole Polytechnique Federale de Lausane, Lausanne, Switzerland,1985
[9] Cheng, N.S., “Exponential formula for bed load transport”, J.Hy.E. 128(10), 942-946, 2002.
[10] Chen, L. and M. C. Stone., “Influence of bed material size heterogeneity on bedload transport uncertainty.”
Water Resour. Res., 44, W01405, doi: 10.1029/2006WR005483, 2008.
[11] Chang, H., D.B.Simons, and R.H.Brooks, “The effect of water detention structures on river and delta
morphology.”river morphology,International union of geology and geophysics,438-448,1967.
[12] Graeme M. Smart, “Sediment transport formula for steep channels”, Journal of Hydraulic Engineering,
Vol.110, No.3, 1984.
[13] Einstein H.A., “Formulas for the transportation of bed load transport”, American society of civil engineers.
107,1942.
[14] Einstein H.A., “ The bed load function for sediment transportation in open channel flows” ,United state
department of agriculture – soil conservation Service ,Washington pp7, 1950
[15] Engelund F. and Hansen E., “A Monograph on sediment transport in alluvial streams, Technical university
of Denmark, Hydraulic Laboratory, pg.634, 1967.
[16] Meyer-Peter, E. and Muller R., “Formulas for bed –load transport”, Proceeding, 2nd
congress IAHR,
Stockholm, June 1948.
[17] Parker, G., “Hydraulic geometry of active gravel rivers”, Journal of Hydraulic Engineering, 105, 9, 1185-
1201, 1979.
[18] Parker, G., and Klingeman,P.C., “on why gravel bed streams are paved.” Water Resour.Res. 18(5), 1409-
1423, 1982.
[19] Recking A., V. Boucinha, and P. Frey, “Experimental study of bed load grain size sorting near incipient
motion on steep slopes” , River Flow. AIRH, Napple, pp 253-258, 2004.
[20] Recking A., Frey P., Paquier A., Belleudy P. and Champagne J.Y., “Bed Load Transport Flume
Experimentson Steep Slopes” , Journal of Hydraulic Engineering, Vol. 134, No. 9,2008.](https://image.slidesharecdn.com/fullpaperproceeding-140331060233-phpapp02/85/Full-paper-proceeding-371-320.jpg)
![ISBN: 978-81-929339-0-0
National Conference on: “Trends and Challenges of Civil Engineering in Today’s Transforming W o r l d ”
29th March, 2014, Civil Engineering Department S.N.P.I.T. & R.C., Umrakh
[21] Recking A., Frey P., Paquier A., and Belleudy P., “An experimental investigation of mechanisms
responsible for bed load sheet production and migration.” J.Geophys.Res. 114, F03010, 2009.
[22] Reid, L.M., Dunne,T., “Rapid Evaluation of Sediment Budgets.”,Catena Verlag,Reiskirchen,pp.164,1996.
[23] Rickenmann D., “Hypoconcentrated flow and sediment transport at steep slopes”, J.H.E.,117,1419-
1439,1991
[24] Smart G.M. and Jaeggi, M.N.R.,“sediment transport on steep slopes.”,Mitteilungen No.191, der
Versuchsanstalt fuer Wasserbau, Hydrologie and Glaziologie, Eidg. Techn. Hochschule Zuerich, Zurich,
Switzerland.1983.
[25] www.sciencedirect.com
[26] www.asce.com
[27] http://onlinelibrary.wiley.com](https://image.slidesharecdn.com/fullpaperproceeding-140331060233-phpapp02/85/Full-paper-proceeding-372-320.jpg)


![ISBN: 978-81-929339-0-0
National Conference on: “Trends and Challenges of Civil Engineering in Today’s Transforming W o r l d ”
29th March, 2014, Civil Engineering Department S.N.P.I.T. & R.C., Umrakh
Measurement of Sound
Sound pressure level (SPL) or sound level (Lp) is a logarithmic measure of the root mean
square pressure (force / area) of a particular noise relative to a reference noise source. It is usually
measured in decibels [dB (SPL) or dB SPL]. Lp = 20 log10 (P2 / P02) dB SPL
A decibel is the standard for the measurement of noise. The zero on a decibel scale is at the
threshold of hearing, the lowest sound pressure that can be heard, on the scale acc. To smith, 20 db is
whisper, 40 db the noise in a quiet office. 60 db is normal conversation, 80 db is the level at which
sound becomes physically painful. The Noise quantum of some of the cities in our country indicate
their pitch in decibel in the nosiest areas of corresponding cities, e.g. Delhi- 80 db, Kolkata -
87,Bombay-85, Chennai-89 db etc.
Effect of the Noise
1. Auditory Health Effects:-Noise-induced hearing loss usually occurs over a lengthy period. By the
time it is evident, it may be too late. Early warning signs include a ringing or buzzing in the ear
(tinnitus) and muffled hearing. Noise is one of the main causes of the hearing loss suffered by 28
million Americans.
2. Non-Auditory Health Effects:-Noise puts stress and tension on the body. The non-auditory health
effects of noise include muscle reactions, heart palpitations, dilation of pupils, secretion of
Rock band, disco 115 db
Missing muffler 115 db
Hole(s) in muffler 111 db
Tailpipe damage 109 db
Circular saw 107 db
Heavy truck at 90 ft 99 db
Power mower 92 db
Train at 50 ft 88 db
Printing press 80 db
Vacuum cleaner 74 db
Busy street traffic 70 db
Air conditioning unit 60 db
Interior of quiet car 50 db
Private office 41 db
Library 33 db](https://image.slidesharecdn.com/fullpaperproceeding-140331060233-phpapp02/85/Full-paper-proceeding-375-320.jpg)
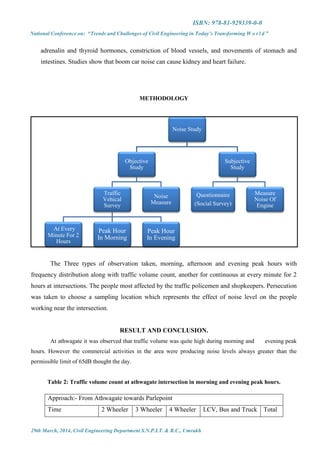
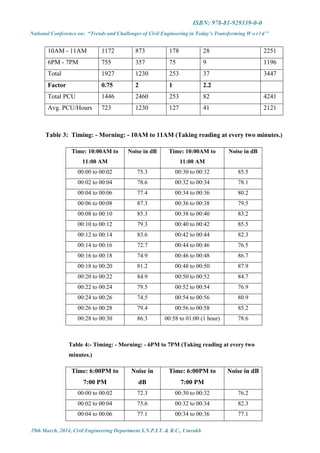
![ISBN: 978-81-929339-0-0
National Conference on: “Trends and Challenges of Civil Engineering in Today’s Transforming W o r l d ”
29th March, 2014, Civil Engineering Department S.N.P.I.T. & R.C., Umrakh
00:06 to 00:08 78.5 00:36 to 00:38 75.9
00:08 to 00:10 80.2 00:38 to 00:40 81.3
00:10 to 00:12 84.5 00:40 to 00:42 83.1
00:12 to 00:14 84.3 00:42 to 00:44 80.8
00:14 to 00:16 85.2 00:44 to 00:46 84.2
00:16 to 00:18 78.9 00:46 to 00:48 85.3
00:18 to 00:20 76.4 00:48 to 00:50 86.9
00:20 to 00:22 77.5 00:50 to 00:52 78.7
00:22 to 00:24 86.4 00:52 to 00:54 76.5
00:24 to 00:26 87.9 00:54 to 00:56 75.6
00:26 to 00:28 80.3 00:56 to 00:58 72.1
00:28 to 00:30 79.8 00:58 to 01:00 (1 hour) 79.8
CONCLUSION
1. As per survey we have found that at major intersection athwagate of surat having heavy traffic
flow almost throughout the day & due to that average noise level is between71db to 88db
which is higher that permissible limit 65db.
2. Frequency of two wheeler & three wheelers are more during pick hrs so majority of noise is
due these vehicles.
REFERENCES
[1] Amutha Jaisheeba and R. Sornaraj (2012). Assessment of Noise Pollution in Thoothukudi City, International
Journal of PharmTech Research, July-Sept 2012
[2] Brind Kumar and Kanakabandi Shalini (2013). A Review of the Assessment and Modeling of Traffic Noise
Pollution: An Indian Perspective, International Conference on Emerging Trends in Engineering & Technology,
April12, 13, 2013
[3] C.R. Patil and J.P. Modak (2011). Subjective Analysis of Road Traffic Noise Annoyance around Major Arterials
in Intermediate City, European Journal of Applied Sciences 3 (2): 58-61, 2011
[4] Davinder Singh and Amandeep Kaur (2013). Study of Traffic Noise Pollution at different location in Jalandhar
City, Punjab, India, International Journal of Environmental Sciences and Research Vol. 2, No. 2, 2013
[5] Hallberg, L.R. (1996). Occupational hearing loss: Coping and family life. Scandanavian Audiology, 43
Suppl., 25-33.
[6] Kryter, K.D. (1982). Community annoyance from aircraft and ground vehicle noise. Journal of the Acoustical
Society of America, 72, 1222-1242.
[7] Lotz, R., & Kurzweil, L.G. (1979). Rail transportation noise. In C.M. Harris (Ed.), Handbook of Noise Control
(2nd ed.). New York: McGraw-Hill Book Company, Chapter 33.
[8] Matthews, K.E., & Canon, L.K. (1975). Environmental noise level as a determinant of helping behavior. Journal
of Personality and Social Psychology, 32, 571-577](https://image.slidesharecdn.com/fullpaperproceeding-140331060233-phpapp02/85/Full-paper-proceeding-378-320.jpg)
![ISBN: 978-81-929339-0-0
National Conference on: “Trends and Challenges of Civil Engineering in Today’s Transforming W o r l d ”
29th March, 2014, Civil Engineering Department S.N.P.I.T. & R.C., Umrakh
[9] Otten, H., Schulte, W., & von Eiff, A.W. (1990). Traffic noise, blood pressure and other risk factors: The Bonn
traffic noise study. In B. Berglund & T. Lindvall (Eds.), Noise as a Public Health Problem (Vol. 4); New Advances
in Noise Research Part I. Stockholm: Swedish Council for Building Research, 327-335.
[10]Peterson, E.A., Augenstein, J.S., Tanis, D.C., & Augenstein, D.G. (1981). Noise raises blood pressure without
impairing auditory sensitivity. Science, 211, 1450-1452.
[11]Sundara Kumar K (2011). Assessment of Urban Noise Pollution in Vijayawada City, A.P, India, International
Journal of Earth Sciences and Engineering ISSN 0974-5904, Volume 04, No 06 SPL, October 2011
[12]Wazir Alam (2011). GIS based Assessment of Noise Pollution in Guwahati City of Assam, India,
INTERNATIONAL JOURNAL OF ENVIRONMENTAL SCIENCES Volume 2, No 2, 2011
[13]Zuhdi Salhab and Husein Amro (2012). Evaluation of Vehicular Noise Pollution In The City Of Hebron,
Palestine, International Journal of Modern Engineering Research (IJMER) Vol. 2, Issue. 6, Nov.-Dec. 2012
[14]www.legalserviceindia.com
[15]http://www.seminarprojects.com/search.php](https://image.slidesharecdn.com/fullpaperproceeding-140331060233-phpapp02/85/Full-paper-proceeding-379-320.jpg)


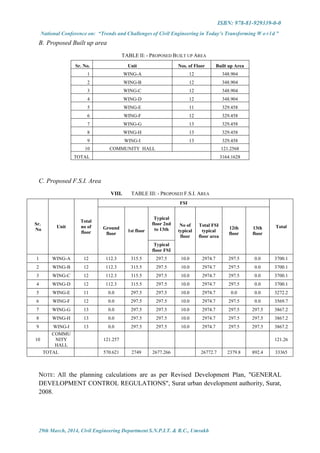
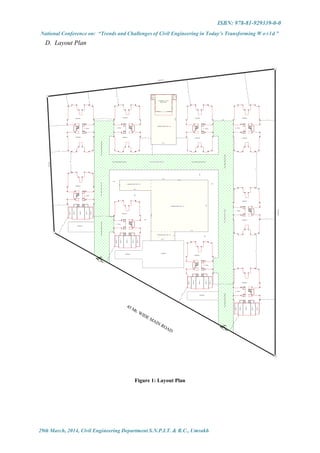

![ISBN: 978-81-929339-0-0
National Conference on: “Trends and Challenges of Civil Engineering in Today’s Transforming W o r l d ”
29th March, 2014, Civil Engineering Department S.N.P.I.T. & R.C., Umrakh
REFERENCES
[1] Dr. N. Kumara Swami and A. Kameswara Rao, “BUILDING PLANNING AND DRAWING”, Charotar
publishing house, Anand, 2010.
[[22]] M. G. Shah, C. M. Kale and S. Y. Patki, “BUILDING DRAWING WITH AN INTEGRATED APPROCH
TO BUILT ENVIRONMENT”, Tata McGraw Hill education , New Delhi, 2010.
[3] Revised Development Plan, "GENERAL DEVELOPMENT CONTROL REGULATIONS", Surat urban
development authority, Surat, 2008.
[[44]] S. C. Rangwala and K. S. Rangwala, “TOWN PLANNING”, Charotar publishing house, Anand, 2011.
[[55]] www.google.com
[[66]] www.wikipedia.com](https://image.slidesharecdn.com/fullpaperproceeding-140331060233-phpapp02/85/Full-paper-proceeding-387-320.jpg)


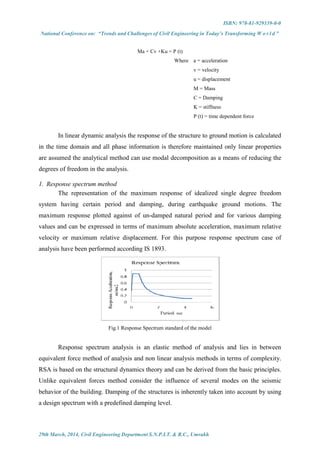

![ISBN: 978-81-929339-0-0
National Conference on: “Trends and Challenges of Civil Engineering in Today’s Transforming W o r l d ”
29th March, 2014, Civil Engineering Department S.N.P.I.T. & R.C., Umrakh
Modeling of frame structure and shear wall - frame structure are different in e-tabs for
non linear analysis. Modeling of shear wall is done by mid – pier approach. The non linear
model of the mid – pier frame is generally based on plastic hinge concept and a bilinear
moment – rotation relationship taking into account the analysis purpose, the plastic hinge (P-
M-M interaction) can be assumed either on the plastic zone at the end of the structural
elements or distributed along the member span length.
V. ANALYSIS OF STRUCTURE
All the three analysis are performed on the all three models of 10, 20, 30 storey with and
without shear walls and the comparison is done on the basis of top story displacement, base
shear, centre of mass.
3. Details of the models
The pertaining structure of 10, 20, 30 storey residential regular building with a general form
of plan shown in figure has been modeled. The storey plan is as shown in figure [2]. The
height of the floors is 3 meter. The base plan dimension in X and Y direction is 24 meter and
12 meter respectively. The loading which applied in this structure including dead, live,
earthquake loads are according to IS 875 part 1 and part 2 and IS 1893 respectively. The
sections including all beams and columns which are used in model are as follows columns -
600x300 mm and beams - 230x450 mm. the floor slab taken as 125 mm grade of concrete is
taken as M 25. The soil considered is medium and the earthquake zone is taken as zone 3.
Importance factor is taken as 1 and response reduction factor is taken as 5 for the ductile
designing and for SMRF.
Fig 2 Plan of residential regular building.](https://image.slidesharecdn.com/fullpaperproceeding-140331060233-phpapp02/85/Full-paper-proceeding-392-320.jpg)


![ISBN: 978-81-929339-0-0
National Conference on: “Trends and Challenges of Civil Engineering in Today’s Transforming W o r l d ”
29th March, 2014, Civil Engineering Department S.N.P.I.T. & R.C., Umrakh
plastic zone method. Plastic hinge approach is limited to its incapacity to capture the
more complex member behaviour that involve severe yielding under combined action
of compression and bi-axial bending and buckling effects.
ACKNOWLEDGEMENT
I would like to express my deepest gratitude to my external guide Mr Utsav D. Shah- director
of Ducon consultants pvt ltd, Ahmedabad, Gujarat. I would also like to thank my internal
guide Dr K. balakrishna rao- professor in manipal institute of technology, Manipal,
karnataka.
REFERENCES
1. [1].Aly Mousaad, Zasso Alberto and Resta (2011), “dynamics and control oh high-rise building under
multidirectional wind load”, Hindwa publshing corporation, Vol 2011, pp-15.
2. [2].Causevic Mehmed, Mitrovic Sasa (2010), “Comparison between non-linear dynamic and static
seismic analysis of structures according to european and US provisioms”, Springer science +business
media B.V. 2010.
3. [3].Bagheri bahador, Firozabad salami ehsan and Yahyaei mohammadreza (2012),”comparative study
of the static and dynamic analysis of multistory irregular building”, world Academy of Science,
engineering and technology.
4. [4].Inel mehmet and Ozmen baytan hayri (2006), “Effects of plastic hinge properties in nonlinear
analysis of reinforced concrete buildings” [on-line serial], www.sciencedirect.com.
5. [5].Computer and Structures inc (2000), “Three dimensional Analysis and design of Building Systems”
[on-line serial], First edition, www.csiberkeley.com.
6. [6]. Rizvi Zargharam, Sharma Ramesh, khan Sabir and Khan Zubair (2013),”Structural strengthening
and damage detection using time history and response spectrum analysis”, IJRREST, volume -2, Issue-
2.
7. [7].Moghadam A.S, Aziminejad. A (2004), “Interaction of torsion and P-delta effects in tall Buildings”,
Issue August 1-6, paper No 799, 13th World Conference on Earthquake Engineering Vancouver, B.C.,
and Canada.
8. [8]. Mwafy A.M, Elnashai A.S (2000),”static pushover versus dynamic collapse analysis of RC
buildings” [on-line serial], www.sciencedirect.com.
9. [9].Carr Athol (1994), “Dynamic analysis of structures”, Volume-27, no-2, Bulletin of the newzealand
national society for earthquake engineering.
10. [10].Chopra Anil (1996), Member ASCE,“Modal analysis of linear Dynamic system: physical
interpretation”, Journal of structural engineering.
11. [11].IS-1893 part 1, 2002,”criteria for earthquake resistant design of structures”, Bureau of Indian
standards, New Delhi, India.
12. [12].Wilson Edward (2002),”Three dimensional static and dynamic analyses of structures”, third
edition, computers and structures INC. Berkeley, California, US.
13. [13].ATC-40, “Seismic Evaluation and retrofit of concrete buildings”, Volume 1, California Seismic
Safety Commission.
14. [14].Baluch M.H., Ajmal M, Rahman M.K and Celep Z (2012),”Nonlinear static pushover analysis of
an eight story RC frame-shear wall building in Saudi Arabia”, WCEE](https://image.slidesharecdn.com/fullpaperproceeding-140331060233-phpapp02/85/Full-paper-proceeding-396-320.jpg)


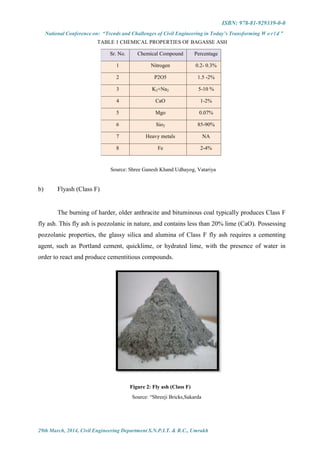
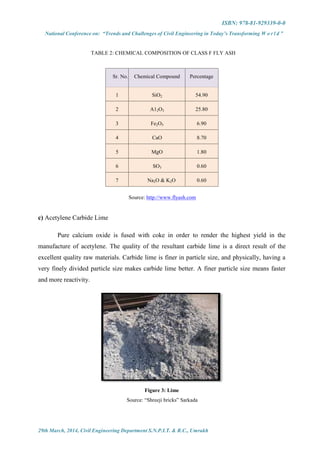


![ISBN: 978-81-929339-0-0
National Conference on: “Trends and Challenges of Civil Engineering in Today’s Transforming W o r l d ”
29th March, 2014, Civil Engineering Department S.N.P.I.T. & R.C., Umrakh
VIII. ACKNOWLEDGMENT
The author thankfully acknowledge to Dr. F. S. Umrigar, Principal, Prof. Jayeshkumar
Pitroda, Prof. J. J. Bhavsar, Associate Professor and PG (Construction Engineering and
Management) Coordinator, B.V.M. Engineering College, Mr. Sailesh Shah Chairman of Sigma
Institute of Engg. Asst. Professor Patel Ankit, Asst. Professor Rajgor Mamta, Lab Asst.
Dinubhai G. Desai, Sigma Institute of Engineering, Vadodara, Gujarat.
REFERENCES
[1] Effects of Fine Bagasse Ash on the Workability and Compressive Strength of Mortars, By: Department of
Materials Engineering, Faculty of Engineering, Kasetsart University, Bangkok0900, Thailand.
[2] Experimental Study on Bagasse Ash in Concrete. By: R .Shrinivasan & K.Sathiya, Tamil Nadu, India-2010
[3] Sugar cane Bagasse ash as a partial Portland cement replacement material, Sep-2010
[4] Environmental Construction and Valuation [Research -Paper] byB.N.Purohit from the Institution of values,
Gujarat zone
[5] Mamta B. Rajgor, Prof. Jayeshkumar Pitroda “A study of utilization aspect of stone waste in Indian context.”
[6] Om Prakash (1990), “Utilization of Pulverized (Fertilizer Plant) Fly Ash as Low-Cost Bricks and Construction
Material” M. Tech. Thesis Submitted to MNREC, Allahabad.
[7] Riddhish shah, JayeshPitroda “Recycling of Construction Material for Sustainability” published in National
Conference on Recent Trends in Engineering & Technology, (NCRTET-2011) B.V.M. Engg. College, V.V.Nagar,
Gujarat 13th
-14th
May 2011.
[8]Rajiv Sinha, “Extract from paper 'Technology: Fly ash Disposal and Utilization: The Indian Scenario”,
Department of Civil Engineering, IIT Kanpur
[9]Shreeji bricks Sarkada.
[10] Shree Ganesh khandudhagyog, Vatariya
[11] V. S. Aigbodion*, S. B. Hassan, T. Ause and G.B. Nyior “Potential Utilization of Solid Waste (Bagasse Ash)
“Journal of Minerals & Materials Characterization & Engineering, Vol. 9, No.1, pp.67-77, 2010
[12]“Engineering Materials” by R. K. Rajput, S. Chand & Company Ltd.
[13]Gujarat Narmada Fly ash Company Limited,901, A- Wing, Alkapuri Arcade, R. C. Dutt Road, Vadodara -390
005
[14] IS: 3495 (Part 1 and 2)-1992, Methods of tests of Burnt Clay Building Bricks—Specification, Bureau of
Indian Standards, New Delhi.
[15] S.K.Duggal, “Engineering Materials”.
[16] http://theconstructor.org/building/fly-ash-bricks/5330/
[17] http://en.wikipedia.org/wiki/Sand
[18] http://flyashbricksinfo.com/fly-ash-brick-vs-normal-clay bricks.html
[19] www.wikipedia.com](https://image.slidesharecdn.com/fullpaperproceeding-140331060233-phpapp02/85/Full-paper-proceeding-406-320.jpg)
![ISBN: 978-81-929339-0-0
National Conference on: “Trends and Challenges of Civil Engineering in Today’s Transforming W o r l d ”
29th March, 2014, Civil Engineering Department S.N.P.I.T. & R.C., Umrakh
[20] http://rmrc.wisc.edu/coal-fly-ash
[21] http://www.google.co.in/imgres
[22] http://www.caer.uky.edu/kyasheducation/flyash.shtml
[23] http://rmrc.wisc.edu/coal-fly-ash/
[24] http://www.graymont.com
[25]http://www.mapsofindia.com
[26] http://www.sereneinteriors.com](https://image.slidesharecdn.com/fullpaperproceeding-140331060233-phpapp02/85/Full-paper-proceeding-407-320.jpg)

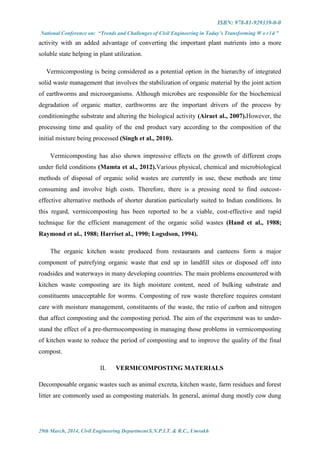
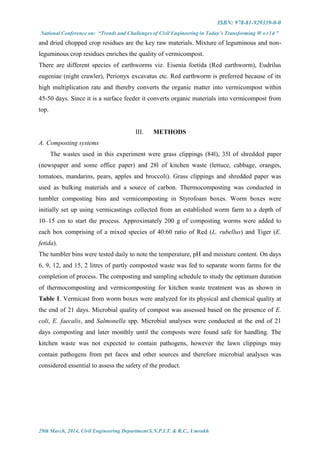

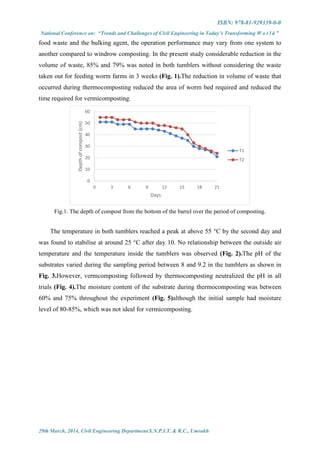


![ISBN: 978-81-929339-0-0
National Conference on: “Trends and Challenges of Civil Engineering in Today’s Transforming W o r l d ”
29th March, 2014, Civil Engineering Department S.N.P.I.T. & R.C., Umrakh
REFERENCES
[1] Agriculture and Resource Management Council of Australia and New Zealand Water Technology
Committee (ARMCANZ), 1995. Guidelines for Sewage Systems—Biosolid Management. Occasional Paper
WTC No. 1/95. October 1995.
[2] APHA, AWWA, WPCF, 1995. Standard Methods for the Examination of Water and Wastewater. APHA,
Washington, DC.
[3] Bajsa, O., Nair, J., Mathew, K., Ho, G.E., 2003. Vermiculture as a tool for domestic wastewater
management. Water Science and Technology 48 (11–12), 125–132.
Cekmecelioglu, D., Demirci, A., Graves, R.E., Davitt, N.H., 2005. Applicability of optimised in-vessel food
waste composting for windrow systems. Biosystems Engineering 91 (4), 479–486.
[4] Donahue, D.W., Chalmers, J.A., Sorey, J.A., 1998. Evaluation of in-vessel composting of university
postconsumer food wastes. Compost Science and Utilisation 6 (2), 75–81.
Haug, R.T., 1993. The Practical Handbook of Compost Engineering, second ed. Lews Publishers, CRC Press
Inc., Florida, USA.
[5] Kristiana, R., Nair, J., Anda, M., Mathew, K., 2005. Monitoring of the process of composting of kitchen
waste in an institutional scale worm farm. Water Science and Technology 51 (10), 171–177.
[6] Morais, F.M.C., Queda, C.A.C., 2003. Study of storage inXuence on evolution of stability and maturity
properties of MSW composts. In: Proceedings of the fourth International Conference of ORBIT association on
Biological Processing of Organics: Advances for a sustainable Society Part II, Perth, Australia.
[7] Ndegwa, P.M., Thompson, S.S., 2001. Integrating composting and vermi-composting in the treatment and
bioconversion of biosolids. Biore-source Technology 76, 107–112.
Sidhu, J., Gibbs, R.A., Ho, G.E., Unkovich, I., 2001. The role of indigenous microorganisms in suppression of
Salmonella regrowth in composted biosolids. Water Research 35 (4), 913–920.
[8] Standards Australia, 1995a. Australian StandardsTM
, Method 6: Thermo-tolerant Coliforms and Escherichia
coli—Estimation of Most Probable Number (MPN) AS 4276.6.
Standards Australia, 1995b. Australian StandardsTM
, Water microbiology: Method 8: Faecal streptococci—
Estimation of Most Probable Numbers (MPN), AS 4276.8.
[9] Standards Australia, 1995c. Australian StandardsTM
, Water Microbiology: Method 14: Salmonellae, AS
4276.14.
[10] Tripathi, G., Bhardwaj, P., 2004. Comparative studies on biomass production, life cycles and composting
effciency of Eisenia fetida (Savigny) and Lampito mauritii (Kinberg). Bioresource Technology 92, 275–283.
[11] Wong, J.W.C., Lee, K.M.Y., Ng, T., Jagadeesan, H., 2003. Feasibility of in-vessel composter for treating
vegetable waste in densely populated city—Hong Kong. In: Proceedings of the Fourth International Conference
of ORBIT Association on Biological Processing of Organics: Advances for a Sustainable Society Part II, Perth,
Australia, pp. 119– 128.
[12] Wu, L., Ma, L.Q., 2001. EVects of sample storage on biosolids compost stability and maturity evaluation.
Journal of Environmental Quality 30, 222–228.
[13] Wu, N., Smith, J.E., 1999. Reducing pathogen and vector attraction for biosolids. Biocycle(November),
59–61.](https://image.slidesharecdn.com/fullpaperproceeding-140331060233-phpapp02/85/Full-paper-proceeding-417-320.jpg)


![ISBN: 978-81-929339-0-0
National Conference on: “Trends and Challenges of Civil Engineering in Today’s Transforming W o r l d ”
29th March, 2014, Civil Engineering Department S.N.P.I.T. & R.C., Umrakh
The following steps are required to be followed to compute carrying capacity of river.
1. Create a new HEC-RAS project.
2. Create a new river and reach in the geometry editor window.
3. Create a new cross section. [Cross Section, Options, Add a new Cross Section].
4. Paste the surveyed station/elevation points into the new Cross section then add the
location of the left and right bank stations.
5. Choose the Run/Hydraulic Design Functions… menu item from the main menu.
6. Choose the Type/ Uniform Flow menu item.
7. If it is not already selected, choose the correct river and reach from the drop down
combo boxes.
8. Enter the elevation of the field-selected bank-full stage and the channel slope into the
appropriate fields.
9. Click on the field next to the elevation on left most station/elevation point, under the
heading “Equation” and choose Manning as the resistance equation.
10. Enter the Manning ‘n’ value.
11. Click inside of the “Discharge” field then click the “Compute” button to calculate the
discharge.
V. EXPECTED OUT-COME
Cross section data represent the geometric boundary of the stream. Cross sections are located
at relatively short intervals along the stream to characterize the flow carrying capacity of the
stream and its adjacent floodplain. Even though it is not a must, it is advisable to take cross
section at constant interval. Cross sections are required at representative locations throughout
the stream and at locations where changes occur in discharge, slope, shape, roughness; at
locations where levees begin and end; and at hydraulic structures (bridges, culverts, and
weirs).
When cross-section and other related data are given as input in a HEC-RAS software then
expected out-comes are obtained as shown in fig 1 to fig 2.](https://image.slidesharecdn.com/fullpaperproceeding-140331060233-phpapp02/85/Full-paper-proceeding-421-320.jpg)


![ISBN: 978-81-929339-0-0
National Conference on: “Trends and Challenges of Civil Engineering in Today’s Transforming World”
29th March, 2014, Civil Engineering Department S.N.P.I.T. & R.C., Umrakh
Green construction and technologies focus on reducing the overall impact of
construction on human health and the natural environment. Green products and
techniques work to utilize resources like water, gas, electricity, etc, more efficiently
while reducing waste, pollution, and environmental degradation.
REFERENCES
[1] Australian Greenhouse Office, "National Greenhouse Gas Inventory", Canberra ACT, March 2007.
[2] "Climate Change 2007: Mitigation of Climate Change, Summary for Policymakers from IPCC Fourth
Assessment Report". Working Group III, IPCC. 2007-05-04. pp. Item 25 and Table SPM.7, pp. 29-31.
[3]"Climate change glossary". Carbon credit. Environment Protection Authority Victoria. 2008-09-02.
[4] "Collins English Dictionary - Complete & Unabridged 10th Edition". Carbon credit. William Collins Sons &
Co. Ltd/Harper Collins Publishers. 2009.
[5] Planning Commission Report for operational using Clean Development Mechanism (CDM), Govt. of India
[6] UNFCCC CDM project database.
[7] “Going Green” digit Fast track
[8] www.ipm.iastate.edu/ipm/icm/2004/1-26- 2004/cc.html
[9] www.nswai.com/images/newsletters/feb2007.pdf
[10] www.onlinecarbonfinance.com/india-and-carbon-credits.htm
[11] www.suspicious-carbon-credits.com
[12] www.unfccc.int](https://image.slidesharecdn.com/fullpaperproceeding-140331060233-phpapp02/85/Full-paper-proceeding-434-320.jpg)

![ISBN: 978-81-929339-0-0
National Conference on: “Trends and Challenges of Civil Engineering in Today’s Transforming World”
29th March, 2014, Civil Engineering Department S.N.P.I.T. & R.C., Umrakh
closely forms a part to achieve Reservoir control. Reservoir control were presented initially
by Beard (1963)[3]
as a a deterministic operating procedure for reservoir control, Windsor
(1973)[18]
tries to form a recursive linear programming procedure for the operation of a flood
control system, Can and Houck (1984)[4]
gave a goal-programming method for multireservoir
system.,Ozelkana et al. (1997)[13]
applied application of dynamic techniques in solving
reservoir control.Oshimaaand Kosudaa(1998)[12]
formed a deterministic chaos method based
on the demand prediction in a reservoir control system. Chang and Chang 2001[5]
suggested
that optimal hydrological parameters as input and output should be there to build an optimal
reservoir operation system.
A set of operating rules for 10 stages for controlling the spillway gate opening was made
by Haktanir and Kisi (2001)[7]
. Now a days most common reservoir control strategy are based
on human-operator decisions based on Rule Levels or Water releasing policies. In this
strategy, a constant amount of water is discharged according to the reservoir level. The most
significant drawback of this approach is how to determine the constant water amount that
must be discharged for a given Elevation. Another disadvantage of this approach is that it
does not consider the change rate of either the elevation or Inflow or change in elevation to
determine the water amount to be released. KarabogaDervis et. al.(2004)[10]
gave a new,
reliable and efficient control method based on fuzzy logic which was proposed for the real-
time operation of spillway gates of a reservoir during any flood of any magnitude up to the
probable maximum flood. To demonstrate the performance of the proposed method the
simulation of the control system using different probable overflow hydrographs were carried
out by them.Haktaniret. al. (2013)[8]
gave a fifteen-stage operation policy for the routing of
flood hydrographs with return periods from 1.01 years up to the Probable Maximum Flood
(PMF) for any dam having a gated spillway. They proposed a procedure to identify sets of
operational rules for gated spillways for optimal flood routing management of artificial
reservoirs. They route the flood dividing it into 15 sub-storage, hence they carried out a 15
stage routing.
The application of Fuzzy logic can be traced to the hydrological domain and study by
various researchers can found such as byRussel and Campbell 1996[14]
, Shrestha et al.
1996[16]
, Cheng and Chau 2001[5]
, Jolma et al. 2001, Kumar et al. 2001 and
KarabogaDervis(2004)[10]
. These have applied the Fuzzy logic in various trends of reservoir
operation. Russel and Campbell 1996[14]
gave fuzzy programming based optimization of
reservoir operation, rule based model byShrestha et al. 1996[16]
.](https://image.slidesharecdn.com/fullpaperproceeding-140331060233-phpapp02/85/Full-paper-proceeding-436-320.jpg)
![ISBN: 978-81-929339-0-0
National Conference on: “Trends and Challenges of Civil Engineering in Today’s Transforming World”
29th March, 2014, Civil Engineering Department S.N.P.I.T. & R.C., Umrakh
II. RESERVOIR OPERATION MANAGEMENT SYSTEM IN HIGH INFLOWS
A real-time reservoir operation is a very complex problem and becomes quite tedious
and tough to control for the high inflow for gated spillways. A dam which is built to serve
various purposes such as storage, Irrigation, Power Demands etc. has to be managed
effectively by a proper efficient Reservoir Operation by fulfilling all needs and demands
which are required. High Inflow or flood usually plays a very important role in the Reservoir
operation and hence, Reservoir control policies have to be adopted to control the outflow to
the downstream, to maintain the storage and elevation levels, to manage the high inflow or
flood. Satisfying fully and efficiently the demand and needs by mitigating the parameters
(flood, change in elevation/storage, drought) which affects the purposes of a dam constitute
the main objectives of the study under reservoir operation management in high inflows or
flood. Also, the structure of the dam and spillway must be safe against unexpected changes in
the elevation and inflows. Therefore, management of the spillway gates in reservoir operation
for gated spillways for a dam forms a major and concern part of study during a mild or a
severe flood control problem.
Reservoir control and operation has been done by the U.S. Army Corps of Engineers,
they utilizes its own method of operating the gated spillways based on the so-called “water
control diagrams” derived considering long- and short-term hydrologic forecasts
(Hydrological 1987). Beard(1963)[3]
also presented deterministic rule’sapproach similar to
Corps’ method for reservoir operation. Sakakima et al. (1992)[15]
make the following similar
comment: “For the extremely big flood, a reservoir operator has to control the gates to protect
the reservoir and the downstream reference point by relying on his judgement.”
Russell and Campbell (1996)[14]
formed reservoir operating rules using fuzzy
programming, which according to them was a better solution then the conventional dynamic
programing methods The gates of a spillway should be operated according to the probable
inflow hydrograph as given by Haktanir and Kisi (2001)[7]
. Gates should not be opened wide
for low inflow as it would cause more release of water and most water will be unnessasorily
lost.Haktaniret. al. (2013)[8]
gave fifteen stage routing method for operating gated spillways.](https://image.slidesharecdn.com/fullpaperproceeding-140331060233-phpapp02/85/Full-paper-proceeding-437-320.jpg)
![ISBN: 978-81-929339-0-0
National Conference on: “Trends and Challenges of Civil Engineering in Today’s Transforming World”
29th March, 2014, Civil Engineering Department S.N.P.I.T. & R.C., Umrakh
III. CONTROL METHOD (STRATEGY) TO BE ADOPTED
The aim of this fuzzy logic based control system is to adjust the dam Elevation as per
rule level and to effectively manage the flood mitigation for high inflow. This should happen
in the shortest time possible by adjusting the openness of spillway gates. Various uncertain
factors that affect dam water reservoir and flow are inflow hydrograph, unexpected and
sudden changes in reservoir water level, amount of water discharge per unit of time,
maximum possible point of outflow etc. In this paper gate operation using fuzzy logic control
(FLC) is discuss. Algorithm of fuzzy rules are used to obtain optimized membership function
representing fuzzy values. These rules are derived based on the intuition and decision
management depending upon the availability of occurs of particular flow.
The main variables of a reservoir management system are the inflow rate [I(t), m3
/s], outflow
rate[Q(t), m3
/s], reservoir capacity[S(106
m3
)], minimum reservoir water surface elevation
[Hmin (m)], actual water level [H (m)],and spillway gate opening [d (m)] (Fig. 2). The
accumulation of storage in a reservoir depends on the difference between the rates of the
inflow and outflow. For the time interval of Dt, this continuity relationship can be expressed
as the following (Udall 1961):
∆ ( ) = ( ). ∆ − ( ). ∆
Where, ∆ ( )storage accumulated or depleted during. ∆ ; and I(t)/Q(t)= average rate of
inflow/outflow during . ∆ .
Table 3: Elevation (in feet and m) and Storage relation for Ukai Dam Tapi basin
Elevation-Storage and Elevation-Discharge these relations are used to find out the outflow
hydrograph for the Inflow in a river. Here also we have utilised the same for routing the flow
and to find outflow hydrograph as well. Table 3 gives the Elevation and storage relation for
the Ukai Dam, Tapi basin which is utilised to find the elevation with respect to the particular
storage and hence route the flow.](https://image.slidesharecdn.com/fullpaperproceeding-140331060233-phpapp02/85/Full-paper-proceeding-438-320.jpg)
![ISBN: 978-81-929339-0-0
National Conference on: “Trends and Challenges of Civil Engineering in Today’s Transforming World”
29th March, 2014, Civil Engineering Department S.N.P.I.T. & R.C., Umrakh
In the fuzzy control system design, the selection of the controller structure involves the
following choices.
A. Input and output variables.
The input variables for the fuzzy controller are lake level (H) and rate of change in
Inflow(dQ). The output of the controller is gate opening (d). The outflow rate of the reservoir
is controlled by the gate opening tuned by the FLC. For the H, dQ, and d variables, the
normalization intervals can be selected as [FRL PMF], [-1, 1] and [0 to max. gate opening]
respectively. FRL: free reservoir level, PMF: probable maximum flood.Figures 1 & 2 shows
the schematic representation of the gates for the spillway and the strategy to be used in fuzzy
logic program.
Figure 1. Schematic sketch of the gated spillway
Figure 2. Proposed Fuzzy Control System
B. Number and type of membership functions for variables.
The membership functions used for the fuzzy values of the fuzzy variables are selected based
on human/expert experience. Hence, each fuzzy variable can have fuzzy values and therefore
the number of membership functions is depends on its value. All of the fuzzy values are](https://image.slidesharecdn.com/fullpaperproceeding-140331060233-phpapp02/85/Full-paper-proceeding-439-320.jpg)
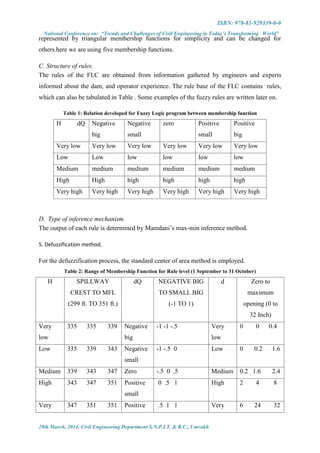


![ISBN: 978-81-929339-0-0
National Conference on: “Trends and Challenges of Civil Engineering in Today’s Transforming World”
29th March, 2014, Civil Engineering Department S.N.P.I.T. & R.C., Umrakh
Figure 5.Discharge by Fuzzy Logic (Maroon line) and Actual Discharge (Red line) [Inflow hydrograph is
in Blue line]
4. CONCLUSION
Following findings can be summarized as an outcome of present study,
1. The fuzzy logic based control method does not require a mathematical model and the
control operation can be carried out automatically without requiring any human operator
interference.
2. The proposed control method is the most systematic approach, since it discharges the water
in proportion to theoverall severity of the incoming flood hydrograph.
3. The fuzzy control produces smoother outflow hydrographs than those obtained by actual
controlled outflow.
4. The fuzzy control successfully decrease the lake level of the reservoir tothe desired lake
level for a high inflow hydrograph.
Consequently, when compared with the conventional controltechniques, the proposed fuzzy
control method performs as anaccurate and reliable control alternative. These characteristics
ofthe fuzzy logic control system are highly desirable in reservoirmanagement, and are
important indications of the power and effectivenessof the fuzzy control approach.
0.0
1000.0
2000.0
3000.0
4000.0
5000.0
6000.0
7000.0
20-Aug 25-Aug 30-Aug 4-Sep 9-Sep 14-Sep
Dischargeincumecs
Time in days
Inflow Data
Actual outflow
Fuzzy outflow](https://image.slidesharecdn.com/fullpaperproceeding-140331060233-phpapp02/85/Full-paper-proceeding-443-320.jpg)
![ISBN: 978-81-929339-0-0
National Conference on: “Trends and Challenges of Civil Engineering in Today’s Transforming World”
29th March, 2014, Civil Engineering Department S.N.P.I.T. & R.C., Umrakh
ACKNOWLEDGMENT
We are thankfully acknowledge to Mr. J.N.Patel, ChairmainVidyabharti Trust, Mr.
K.N.Patel, Hon. Secretary, Vidyabharti Trust, Dr. H.R.Patel, Director, Dr.J.A.Shah,
Principal, S.N.P.I.T.&R.C.,Umrakh, Bardoli, Gujarat,India for their motivational &
infrastructural supports to carry out this research.
REFERENCES
[1] AcanalNese, HaktanirTefaruk,. Six-Stage Flood Routing for Dams Having Gated Spillways, Tr. J. of
Engineering and Environmental Science 23 (1999) , 411 422.
[2] AcanalNese, YurtalRecep and HaktanirTefaruk, Multi-stage flood routing for gated reservoirs and
conjunctive optimization of hydroelectricity income with flood losses, Hydrological Sciences-Journal-des
Sciences Hydrologiques, 45(5) October 2000.
[3] Beard, L. R. (1963). “Flood control operation of reservoirs.”J. Hydraul. Div., Am. Soc. Civ. Eng., 89(1), 1–
23.
[4] Can, E. K., and Houck, M. H. (1984). “Real-time reservoir operations by goal programming.”J. Water
Resour. Plan. Manage, 110(3), 297–309.
[5] Chang, L., and Chang, F. (2001). “Intelligent control for modeling of real-time reservoir
operation.”Hydrolog.Process., 15, 1621–1634.
[6] George J. Klir and Bo Yuan, 1995, Fuzzy sets and fuzzy logic: theory and applications, Prantice hall, PTR,
Prantice Hall publisher, Upper Saddle river New Jersey.
[7] Haktanir T., And Kisi O. (2001). “Ten-stage discrete flood routing for dams having gated spillways.” J.
Hydrologic Eng., 6(1), 86–90.
[8] HaktanirTefaruk, CitakogluHatice and AcanalNese, Fifteen-stage operation of gated spillways for flood
routing management through artificial reservoirs, Hydrological Sciences Journal – Journal des Sciences
Hydrologiques, 58 (5) 2013.
[9] Hydrological Engineering Center. (1987). “Management of water control system, engineering and
design.”Rep. EM 1110-2-3600, U.S. Army Corps of Engineers, Davis, Calif.
[10] KarabogaDervis, BagisAytekin and HaktanirTefaruk (2004), Fuzzy Logic Based Operation of Spillway
Gates of Reservoirs during Floods, J. Hydrol. Eng. 2004.9:ASCE:544-549.
[11] Kisi, Ö. (1999). “Optimum ten stage overflow operating model for dams having gated spillway.” MSc
thesis, Erciyes Univ., Turkey.
[12] Oshimaa, N., and Kosudaa, T. (1998). “Distribution reservoir control with demand prediction using
deterministic-chaos method.”Water Sci. Technol., 37(12), 389–395.
[13] Ozelkan E. C., Galambosia, Á.,Gaucheranda, E. F., and Duckstein, L. (1997). “Linear quadratic dynamic
programming for water reservoir management.”Appl. Math. Model., 21(9), 591–598.
[14] Russell Samuel O., Member, ASCE, and Campbell Paul F., “Reservoir Operating Rules with Fuzzy
Programming”, Journal of Water Resources Planning and Management/May/June/1996.
[15] Sakakima, S., Kojiri, T., and Itoh, K. (1992). “Real-time reservoir operation with neural nets
concept.”Proc., 17th Int. Conf. on Applications of Artificial Intelligence in Engineering—AIENG/92,
Computational Mechanics Publications, Southampton, U.K., 501–514.](https://image.slidesharecdn.com/fullpaperproceeding-140331060233-phpapp02/85/Full-paper-proceeding-444-320.jpg)
![ISBN: 978-81-929339-0-0
National Conference on: “Trends and Challenges of Civil Engineering in Today’s Transforming World”
29th March, 2014, Civil Engineering Department S.N.P.I.T. & R.C., Umrakh
[16] Shrestha, B. P., Duckstein, L., and Stakhiv, E. Z. (1996). “Fuzzy rulebased modeling of reservoir
operation.”J. Water Resour. Plan.Manage., 122(4), 262–269.
[17] Udall, S. L. (1961). “Design of small dams.” Rep., U.S. Dept. of the Interior, Bureau of Reclamation,
Washington, D.C.
[18] Windsor, J. S. (1973). “Optimization model for the operation of flood control systems.”Water Resour. Res.,
9(5), 1219–1226.
[19] Wurbs, R. A. (1993). “Reservoir system simulation and optimization models.”J. Water Resour. Plan.
Manage. 119(4), 455–472.
[20] Yeh, W. (1985). “Reservoir management and operations models: A state of the art review.” Water Resour.
Res., 21(12), 1797–1818.](https://image.slidesharecdn.com/fullpaperproceeding-140331060233-phpapp02/85/Full-paper-proceeding-445-320.jpg)

![ISBN: 978-81-929339-0-0
National Conference on: “Trends and Challenges of Civil Engineering in Today’s Transforming World”
29th March, 2014, Civil Engineering Department S.N.P.I.T. & R.C., Umrakh
dimensional hydraulic simulation allowing for steady flow, unsteady flow, Quasi-unsteady
flow and sediment simulations. Wardman et al[2]
(2009) studied sediment transport processes
in the lower Puyallup River, WA using HEC-RAS. Results of the study suggested increase in
the bed level and decrease in overall trap efficiency due to tidal influences. Huang et al[9]
(2012) used 1-D sediment transport model to simulate the future channel bed response to
river geometry with and without temporary channel for the Elephant Butte Temporary
Channel (Temp Channel) on the Middle Rio Grande in New Mexico. The paper presents an
analysis of Sediment Transport using one-dimensional model (HEC-RAS) which gives the
deposition of sedimentation profile of the river reach or reservoir. Amir at al[1]
(2012) studied
critical erodible points and areas with potential sediment aggredation along Karun River, Iran
using HEC-RAS. Duan et al[7]
(2012) examined to improved one-dimensional numerical
model that takes into account the effect of sediment concentration and bed change on mass
and momentum conservation of flood flow in the Yellow River. Tullos et al[6]
(2009)
compared results from a 1-D (HEC-RAS) hydraulic and sediment transport analysis (Yang
equation) is compared to pre- and post-removal bathymetric and sediment surveys. Model
simulations over predicted erosion in the reservoir and downstream relative to what was
observed. Meselhe et al[11]
(2009) used 1-D (HEC-RAS) model for numerical modeiling of
lower Mississippi river to study bed material transport. Cantelli et al[4]
(2007) handful of
model’s specific to dam removal gives general hydrodynamic applications (HEC-RAS,
MIKE 11, GSTARS), are available for simulating responses of rivers to the erosion and
downstream pulse of reservoir sediments. Cui and Wilcox[5]
(2008) used 1-D cross-
sectionally and longitudinally averaged sediment transport model, at the Marmot Dam
removal site is investigate potential aggradations and suspended sediment concentrations
under various flow and sediment management scenarios. Brunner et al[3]
(2005) highlighted
additional sediment transport capabilities of HEC-RAS. In the present study, the numerical
sediment transport model provide in HEC-RAS 4.1.0 (Hydrologic Engineering Centre, 2006)
is utilised to predict the sediment movement through the study reach, specifically the
location, volume, and depth of sediment deposition or erosion.
2. STUDY AREA: LOWER SIANG RESERVOIR
The proposed Lower Siang hydroelectric project is located near village Bodak, 23 km from
Pasighat the head quarter of East Siang district of Arunachal Pradesh, India. The dam of the
proposed water storage project is geographically located at longitude 950
14’ 00”E and](https://image.slidesharecdn.com/fullpaperproceeding-140331060233-phpapp02/85/Full-paper-proceeding-447-320.jpg)


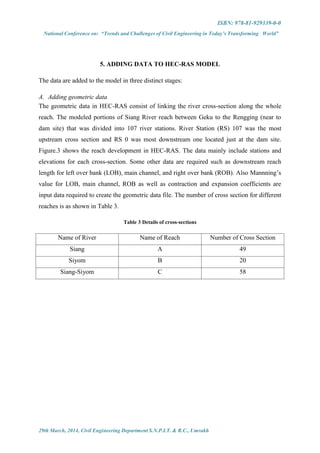


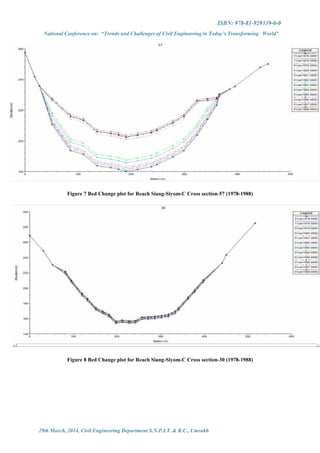


![ISBN: 978-81-929339-0-0
National Conference on: “Trends and Challenges of Civil Engineering in Today’s Transforming World”
29th March, 2014, Civil Engineering Department S.N.P.I.T. & R.C., Umrakh
REFERENCES
1) Amir Hamzeh Haghiabi and Ehsan Zaredehdasht, Evaluation of HEC-RAS Ability in Erosion and
Sediment Transport Forecasting, World Applied Sciences Journal 17 (11): 1490-1497, 2012 ISSN
1818-4952 © IDOSI Publications, 2012.
2) Brian G. Wardman, Brad R. Hall, and Casey M. Kramer, One-Dimensional Modeling of Sedimentation
Processes on the Puyallup River, World Environmental and Water Resources Congress 2009: Great
Rivers © 2009 ASCE.
3) Brunner et al (2010) HEC-RAS, River Analysis System Hydraulic Reference Manual [Report] /
Hydrologic Engineering Center (HEC) ; Institute for Water Resources. - Davis : US ARMY CORPS
OF ENGINEERS, 2010.
4) Cantelli, A., Wong, M., Parker, G., and Paola, C. (2007). "Numerical model linking bed and bank
evolution of incisional channel created by dam removal." Water Resources Research, 43(W07436), 16.
5) Cui, Y., and Wilcox, A. (2008). "Development and applications of numerical models of sediment
transport associated with dam removal." Sedimentation engineering: Processes, measurements,
modeling, and practice, M. H. Garcia, ed., American Society of Civil Engineers, Reston, VA, 995-
1020.
6) Desiree Tullos, Matt Cox, Cara Walter, Simulating dam removal with a 1D hydraulic model: Accuracy
and techniques for reservoir erosion and downstream deposition at the Chiloquin Dam removal, World
Environmental and Water Resources Congress 2010: Challenges of Change. © 2010 ASCE.
7) Duan, et al (2012). ”Numerical Simulation of Unsteady Hyperconcentrated Sediment-Laden Flow in
the Yellow River.” J. Hydraul. Eng., 138(11), 958–969.
8) Gibson, S.A, Pak, J.H, and Fleming, M.J, Modeling Watershed and Riverine Sediment Processes with
HEC-HMS and HEC-RAS, Watershed Management 2010 © ASCE 2011.
9) Jianchun Huang, and Paula W. Makar, Sediment Modeling of the Middle Rio Grande with and without
the Temporary Channel: San Antonio to Elephant Butte Reservoir, World Environmental and Water
Resources Congress 2012: Crossing Boundaries © ASCE 2012.
10) Martin J. Teal, Marc A. Schulte, David T. Williams, and John I. Remus II , Sediment Modeling of Big
Bend Reservoir, South Dakota, Water Resources 2000, ASCE 2004.
11) Meselhe et al (2009), Numerical Simulation of Bed Material trasnpsort in the lower Missippi River,
Journal of coastal Research, Special Issue 56, 2009,1449.
12) Stanford Gibson, Steve Piper, Mark Jensen ,Sediment transport computations with HEC-RAS, Eighth
Federal Interagency Sedimentation Conference (8thFISC), April2-6, 2006, Reno, NV, USA.](https://image.slidesharecdn.com/fullpaperproceeding-140331060233-phpapp02/85/Full-paper-proceeding-459-320.jpg)


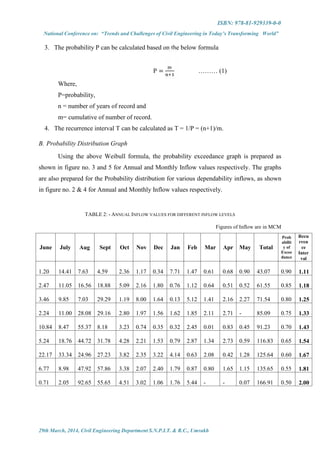


![ISBN: 978-81-929339-0-0
National Conference on: “Trends and Challenges of Civil Engineering in Today’s Transforming World”
29th March, 2014, Civil Engineering Department S.N.P.I.T. & R.C., Umrakh
REFERENCES
[1] Cruise and Singh (1996) presented a typical flood regulation approach
[2] Ethan et al (2013) explained about the evaluation of change in reservoir rule curve using the historical
water data
[3] Jain et al. (1998) adopted a simulation approach to derive operating rules for a multipurpose reservoir
systems in India
[4] K. Subramanya – A book on Engineering Hydrology
[5] Marien et al. (1994) formulated an implicit stochastic optimization model for building seasonal rule curves
for multipurpose multi-reservoir systems
[6] Qubaa et al. (2002) Development of optimization model that allocates water among computed sectors to
obtrain highest economic return
[7] S. Vedula and P. P. Majumdar – A book on Water Resources Systems – Modelling Techniques and
Analysis
[8] V. Jyothiprakash, R. Arunkumar and A. Ashokrajan , “Optimal Crop Planning using a Chance Constrained
Liner Programming Model” Water Policy 13(2011) 734-749.
[9] Wasimi & Kitanidis described a methodology for solving the combined problem of real-time forecasting
and daily operations of a multi-reservoir systems during flood.
[10] Willis et al. (1984) developed a method for determining probabilistic release rules using Monte Carlo
optimization.
[11] www.google.com
[12] www.wikipedia.com](https://image.slidesharecdn.com/fullpaperproceeding-140331060233-phpapp02/85/Full-paper-proceeding-470-320.jpg)


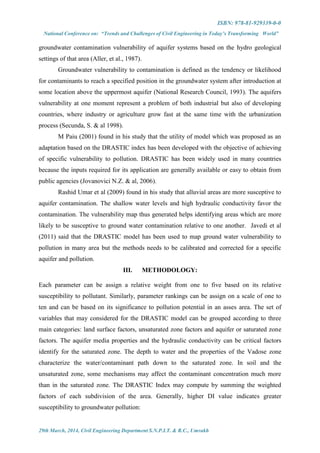

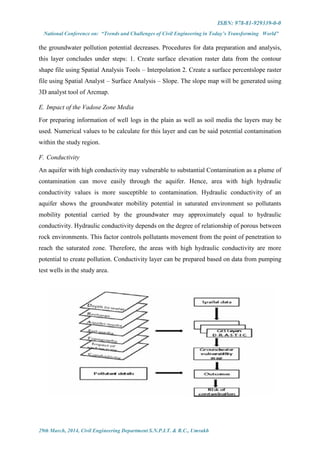
![ISBN: 978-81-929339-0-0
National Conference on: “Trends and Challenges of Civil Engineering in Today’s Transforming World”
29th March, 2014, Civil Engineering Department S.N.P.I.T. & R.C., Umrakh
Figure 1. Methodology flowchart for groundwater vulnerability analysis using
DRASTIC model in GIS
CONCLUSIONS
The results of this study may confirm the utility of intrinsic vulnerability indexes (DRASTIC)
and specific vulnerability to pollution indexes for evaluating the vulnerability of the
groundwater in the area. The model, which may propose as an adaptation based on the
DRASTIC index can be develop with the objective of achieving greater accuracy in the
estimation of specific vulnerability to pollution. It can be based on a multiplicative model that
integrates the risk of groundwater pollution related to different land uses and considers both
the negative impacts, over time, of some of these uses on aquifer media and also the
protective effects of others. The DRASTIC and intrinsic vulnerability indexes may show
certain limitations that can be improved. The importance and nature of groundwater resources
call for mankind to act at global, regional, and local levels. Thus, GIS is one of the best tool
to be used for the comprehensive study of ground water resources from local to global levels
allowing flexible approaches.
REFERENCES
[1] Aller L., Bennett T., Lehr J.H., Petty R.J.& Hackett G. (1987), DRASTIC: a standardized system for
evaluating ground water pollution potential using hydrogeologic settings, EPA-600/2-87-035, National
Water Well Association, Dublin, Ohio / EPA Ada. Oklahoma. 641 pp.
[2] Alizadeh, Principles of Applied Hydrology, Astan Qds Razavi publications.2004, P 254.
[3] Jovanovic N. Z., Adams S., Thomas A., Fey M., Beekman H. E., Campbell R., Saayman I. & Conrad J.,
(2006), Improved DRASTIC method for assessment of groundwater vulnerability to generic aqueousphase
contaminants, WIT Transactions on Ecology and the Environment, Vol 92, waste Management and the
Environment III, p. 393-402
[4] K. Dirk De, C. Marco, P. Roberto, A. Ayed, B.M. Abdullah And M. Yacine, A computerized methodology
for aquifer vulnerability mapping: Mean Sea Level aquifer, Malta and Manouba aquifer, Tunisia. Karst
Hydrology (Proceedings of Workshop W2 held at Rabat, Morocco, April-May IAHS Publ. no. 247, 1997. 81.
[5] M. Civita, and M. De Maio. Mapping groundwater vulnerability in areas impacted by flash food disasters.
Bull. GEAM 32, 4, 1995, pp. 233-238.
[6] Napolitano, P. & Fabbri, A.G. (1996). Single-parameter sensitivity analysis for aquifer vulnerability
assessment using DRASTIC and SINTACS. HydroGIS 96: Application of Geographic Information Systems
in Hydrology and Water Resouces Management (Proceedings of the Vienna Conference, April 1996). IAHS
Publ. No.235, 1996, 559-566
[7] National Research Council, Groundwater Vulnerability Assessment: (1993), Predicting Relative
Contamination Potential under Conditions of Uncertainty, Committee for Assessing Groundwater
Vulnerability, National Academy Press: Washington, D.C.
[8] Rahman, A. (2003). Assessing water quality from Jal Nigam hand pumps in Aligarh city, India. In Nature
Pollution and Technology (pp.241–244) Karad.](https://image.slidesharecdn.com/fullpaperproceeding-140331060233-phpapp02/85/Full-paper-proceeding-476-320.jpg)
![ISBN: 978-81-929339-0-0
National Conference on: “Trends and Challenges of Civil Engineering in Today’s Transforming World”
29th March, 2014, Civil Engineering Department S.N.P.I.T. & R.C., Umrakh
[9] R.C. Gogu, A. Dassargues. Current trends and future challenges in groundwater vulnerability assessment
using overlay and index methods. Environmental Geology, 39 2000 (6):549- 559.
[10] Secunda, S., Collin, M., & Melloul, A. J. (1998), Groundwater vulnerability assessment using a composite
model combining DRASTIC with extensive land use in Israel’s Sharon region, Journal of Environmental
Management, 54, 39–57.](https://image.slidesharecdn.com/fullpaperproceeding-140331060233-phpapp02/85/Full-paper-proceeding-477-320.jpg)


![ISBN: 978-81-929339-0-0
National Conference on: “Trends and Challenges of Civil Engineering in Today’s Transforming World”
29th March, 2014, Civil Engineering Department S.N.P.I.T. & R.C., Umrakh
VI.CONCLUSION
The aforementioned industrial water reclamation and reuse case studies clearly
indicate that this practice is feasible and, in both cases essential, in order to save fresh
water and boost security of supply. Advanced technologies are gaining in importance,
especially in cases where the functioning of industrial processes has to be guaranteed.
Whatever the case, water reuse constitutes major factor in sustainable development,
especially in arid and semi-arid regions.
REFERENCES
[1] Anderson, P. and Y. Meng (2011). Assessing opportunities for municipal wastewater reuse in the
metropolitan Chicago area. Illinois Sustainable Technology Center Report.
[2] Anderson, P. and Y. Meng (2011). Assessing opportunities for municipal wastewater reuse in the
metropolitan Chicago area. Illinois Sustainable Technology Center Report.
[3] Arceivala, S.J., Asolekar, S.R., 2007. Water Conservation and Reuse in Industry and Agriculture. In:
Wastewater Treatment for Pollution Control and Reuse, 2007, Tata McGraw- Hill Publishing Company
Limited, New Delhi, pp. 396–425
[4] Asano, T. and A. Levine (1996). Wastewater reclamation, recycling, and reuse: past, present, and future.
Water Science and Technology 33, 1-14
[5] DeBoer, J. and K. Lindstedt (1985). Advances in water reuse applications. Water Resources 19, 1455-1461
[6] Global challenges to wastewater reclamation and reuse by Prof. Takashi Asano and Dr. Akica Bahri,
Professor Emeritus, Department of Civil and Environmental Engineering, University of California at Davis
[7] Illinois Administrative Code Title 35, Subtitle C, Chapter II (IEPA), Part 372; Indiana Administrative Code
Title 327, Article 6.1
[8] J. Lahnsteiner, F. Klegraf, R. Mittal, P. Andrade, Reclamation of wastewater for industrial purposes, Paper
presented at the 6th
IWA Specialist Conference on Wastewater Reclamation and Reuse for Sustainability,
October 9-12, 2007, Antwerp, Belgium
[9] Leverenz, H. and T. Asano (2011). “Wastewater reclamation and reuse system” in Treatise on Water
Science vol. 4, 63-71
[10] Scholars Research Library, Archives of Applied Science Research, 2011, 3 (4):163-168, Reclamation of
waste water, Shilpi Saxena, Gaurav Kr. Rastogi, Saloni Gangal, Department of Applied Sciences,
Mangalayatan University, Beswan (Aligarh), Department of Applied Sciences and Humanities, Sunderdeep
Engineering College (Gaziabad)
[11] Sheikh, B. et al. (1990). Monterey wastewater reclamation study for agriculture. Research Journal of the
Water Pollution Control Federation 62(3), 216-226
[12] Singapore Public Utilities Board (PUB), 2002, Singapore Water Reclamation Study: Expert Panel Review
and Findings Report, Singapore Public Utilities Board (PUB), June 2002. In Website:
http://www.pub.gov.sg/water/newater/NEWaterOverview/Documents/review.pdf (Accessed on April 12, 2011).
[13] Wastewater Recycle, Reuse, and Reuse of Domestic Wastewater–S.Vigneswaran, M. Sundaravadivel](https://image.slidesharecdn.com/fullpaperproceeding-140331060233-phpapp02/85/Full-paper-proceeding-485-320.jpg)


![ISBN: 978-81-929339-0-0
National Conference on: “Trends and Challenges of Civil Engineering in Today’s Transforming World”
29th March, 2014, Civil Engineering Department S.N.P.I.T. & R.C., Umrakh
For effective results, the system must be carefully selected, designed, operated and
maintained. Because the decision is complex, an experienced ion exchange engineer
should be consulted to assist in selection and design.
REFERENCES
[1] Cyril Jacob, “Seawater desalination: Boron removal by ion exchange technology”, Desalination, 205,
2007, 47-52.
[2] Dykes, G. M. and W. J. Conlon, Use of Membrane Technology in Florida, Journal of the American Water
Works Association, 81, 1989, 43-46.
[3] N.M. Dube, R. Tzoneva; Automation of ion exchange process used for desalination of water, Desalination,
Sen-I Gakkaishi, 44, 1989, 40.
[4] M.Y. Kariduraganavar, R.K. Nagarale, A.A. Kittur, S.S. Kulkarni; “Ion-exchange membranes" preparative
methods for electrodialysis and fuel cell applications”, Desalination, 197, 2006, 225-246
[5] Sengupta A. K., Ion Exchange Technology: Advancesin Pollution Control, Lancaster, TECHNOMIC
Publishing Co. Inc, PA: 1995.
[6] Slater, M.J.; Continuous Ion Exchange in Fluidized Beds. The Canadian Journal of Chemical engineering,
1974, Vol. 52.
[7] Tamim Younos, Kimberly E. Tulou, “Overview of Desalination Techniques”, Universities council on
water resources journal of contemporary water research & education, 132, December 2005, 3-10.
[8] Vander Bruggen, Bart, C. Vandecasteele; Distillation vs. Membrane Filtration: Overview of Process
Evolutions in Seawater Desalination, Desalination, 143, 2002, 207-218.
[9] W. Pusch, Synthetic membranes for separation processes, Sen-I Gakkaishi, 44, 1988, 20.
[10]Wastewater Engineering by B. C. Punamia, Aurnkumar Jain, Ashokkumar Jain. Laxmi Publication.
[11]Wastewater Engineering Disposal & Reuse by George Tchobanoglous by Tata Metcalf & Eddy - McGraw
Hill.
[12]www.cedengineering.com
[13]http://www.ianrpubs.unl.edu
[14]https://www.idadesal.org](https://image.slidesharecdn.com/fullpaperproceeding-140331060233-phpapp02/85/Full-paper-proceeding-503-320.jpg)


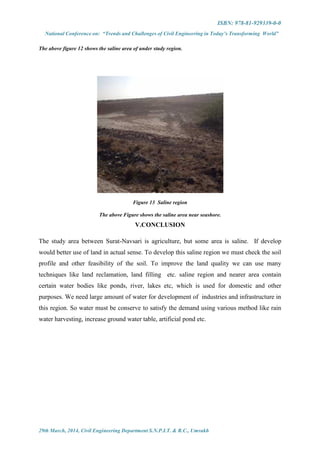
![ISBN: 978-81-929339-0-0
National Conference on: “Trends and Challenges of Civil Engineering in Today’s Transforming World”
29th March, 2014, Civil Engineering Department S.N.P.I.T. & R.C., Umrakh
REFERENCES
[1] Gujarat ecology commission
[2] http://articles.timesofindia.indiatimes.com/2013-0903/surat/41725959_1_land-conversion-city-
development-lakh-sq-m
[3] http://www.rentxperts.in/NewsDetails.aspx?Newsid=50
[4] http://articles.timesofindia.indiatimes.com/2012-07-25/surat/32847922_1_metro-rail-surat-municipal-
corporation-twin-cities
[5] http://gsldc.org/Schemes.aspx
[6] http://agri.gujarat.gov.in/hods/commi_fisheries/donwload/bwacguj.pdf
[7] Surat urban development authority (SUDA)
[8] Navsari area development authority (NADA)
[9] Gujarat Village Dictionary 2001
[10] Google earth
[11] Gujarat State Irrigation- C.A.D.
[12] http://www.dnaindia.com/india/report-gujarat-govt-plans-to-create-5-twin-cities-1621197
[13] http://www.thinkindia.net.in/2013/09/surat-navsari-twin-city-development-triggers-rush-for-land-
conversion.html
[14] http://eau.sagepub.com/content/15/1/149
[15] http://www.thehindu.com/todays-paper/tp-national/tp-karnataka/make-bangalore-mysore-twin-cities-
ravindra/article2980126.ece](https://image.slidesharecdn.com/fullpaperproceeding-140331060233-phpapp02/85/Full-paper-proceeding-513-320.jpg)


![ISBN: 978-81-929339-0-0
National Conference on: “Trends and Challenges of Civil Engineering in Today’s Transforming World”
29th March, 2014, Civil Engineering Department S.N.P.I.T. & R.C., Umrakh
REFERENCES
[1] AMC and AUDA with CEPT University (2006). City Development Plan - Ahmedabad.
Ahmedabad Municipal Corporation and Ahmedabad Urban Development Authority.
[2] About Surat - The City of Diamonds and Silk
http://www.trinnitydevelopers.com/about-surat.html
[3] Appraisal of City Development Plan
http://www.niua.org/jnnurm/cdp per cent20appraisal_surat_niua.pdf
[4] Census Data
http://www.indiamapia.com/surat.html
[5] Details of Sanctions Final Schemes www.suratmunicipal.org/content/townplanning/finalschemes.shtml
[6] Kadiyali L.R., “Traffic Engineering and Transport Planning”, Khanna Publishers, Seventh
Edition (Eighth Reprint: 2011).
[7] Managing urban growth using town planning scheme mechanism
http://www.niua.org/publications/newsletter/Urb_fin_mar_04.pdf (Page 7 & 8)
[8] Population growth, area and density (Election Ward Wise)
http://www.suratmunicipal.gov.in/content/city/stmt19.shtml
[9] Tentative Recommendations on the provision of Parking Spaces for Urban Areas, Special
Publication 12, IRC, New Delhi, 1973
[10] www.google.com: Product “Google earth”](https://image.slidesharecdn.com/fullpaperproceeding-140331060233-phpapp02/85/Full-paper-proceeding-520-320.jpg)


![ISBN: 978-81-929339-0-0
National Conference on: “Trends and Challenges of Civil Engineering in Today’s Transforming World”
29th March, 2014, Civil Engineering Department S.N.P.I.T. & R.C., Umrakh
2011 326.515 722.00
(Source: Surat CDP revised [2006-2012])
Below Table - 2 states the population within SMC and SUDA areas respectively based on
source of Census.
TABLE 2:- SMC AND SUDA POPULATION AS PER CENSUS YEAR
Sr.
No
Year Population
SMC SUDA SMC+SUDA
1 1951 223182 --- ---
2 1961 288026 --- ---
3 1971 471656 21345 493001
4 1981 776583 137223 913806
5 1991 1498817 20133 1518950
6 2001 2433785 377679 2811464
7 2011 4473143 331739 4804882
(Source: Surat CDP revised [2006-2012] and Census of India, 2011)
Existing administration setup leaves 396 Sq. km. area for SUDA upon exclusion of SMC.
The SUDA area is the area identified for urban agglomeration by the State Government of
Gujarat and available for future expansion of the city as and when need is ‘felt’. Growth rate
in the table remarkably identifies the difference of development pace accommodating citizens
near their workplaces.
II. RECONSTRUCTION OF DATA SET
Details in Table – 2 are reflected from the Surat CDP and Census of India, 2011. These
details are based on present boundary of SMC however, the same are somewhat misleading
from the actual scenario with observed changes in administrative boundary and any
judgement based on gross population may affect adversely. Actually out of 125 villages and
Surat city in entire of SUDA, the area except SMC is comprising of 95 villages of Four
Taluka namely, Chorasi, Olpad, Kamrej and Palsana. To observe uniformity and better
projection results, it is essential to keep the spatial boundaries constant and reformulation of
population shall be worked out. Hence, following is the reconstructed population of previous
decades considering present boundary of SMC and SUDA.](https://image.slidesharecdn.com/fullpaperproceeding-140331060233-phpapp02/85/Full-paper-proceeding-523-320.jpg)


![ISBN: 978-81-929339-0-0
National Conference on: “Trends and Challenges of Civil Engineering in Today’s Transforming World”
29th March, 2014, Civil Engineering Department S.N.P.I.T. & R.C., Umrakh
66 % 36 % 24 % 82 %
(Source: Authors)
III.POPULATION PROJECTIONS
The concepts of population estimates and population projections often are confused even
though the distinction between the two is relatively simple and straightforward. Both
concepts involve the generation of a number that is intended to indicate the size of the
population of a given geographic area at a specific point in time. Both techniques make use of
the basic demographic equation:
P2 = P1 + B - D + I - O
It indicates that the population at any given point in time (P2) is a function of the
population at a previous point in time (P1) plus the amount of natural increase (births minus
deaths) and the net migration (in-migration minus out-migration) during the interim. As per
Census of India-GoI, basically there are two types of population projection methods:
1. Component and Non-component methods
2. Mathematical methods
Both methods have different characteristics so that they are used at large scale and small
scale respectively. For projecting the population of Surat, different type of methods have
been used, they are [1] Arithmetical increase method (AIM), [2] Incremental increase method
(IIM), [3] Geometrical increase method (GIM), [4] Geometric general method (GGM) and
[5] Ratio and correlation method (RCM).
All the above methods are applied to village-wise population for past five decades.
Population totals are derived as per the administrative boundaries of SMC and SUDA as per
existing status (year 2011) of administrative inclusion.
A. Arithmetical Increase Method (AIM)
Rate of population increase is constant and expression is = where Ka is an
arithmetic constant. The formula is, P_future = P_last + (K_a) (t_future - t_last) and =
∑
where x = number of past records time intervals. This methods is more or less a
straight line projection method where the projected values follow a uniform rate of growth, as
obtained from past trends without consideration of any other effects.
B. Incremental Increase Method (IIM)
In incremental increase method not only average increase but difference of increment is
also add. So that method is focus on variation of increment. The applicable formula used is](https://image.slidesharecdn.com/fullpaperproceeding-140331060233-phpapp02/85/Full-paper-proceeding-526-320.jpg)

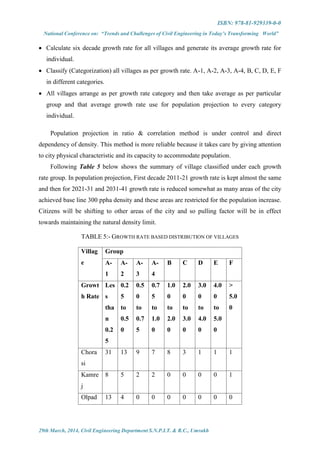


![ISBN: 978-81-929339-0-0
National Conference on: “Trends and Challenges of Civil Engineering in Today’s Transforming World”
29th March, 2014, Civil Engineering Department S.N.P.I.T. & R.C., Umrakh
There is a need for developing unique relationship among various parameters to
project population of a rapidly growing urban area. The same may not be applicable
to another urban area as though overall urbanization is almost uniform but the
governing parameter may be different.
ACKNOWLEDGMENT
The authors are thankfully acknowledge to Mr. K. J. Mehta, Hon’ble Chairman, SES, Mr.
Hiren H. Patel, Principal, SCET, Prof. H. J. Padhya, Head, Civil Engineering Department,
SCET, Surat, Gujarat, India for their motivational & infrastructural supports to carry out this
research. Authors also are thankful to Mr. Rajesh Pandya, Town Planner, SMC and Mr. Jitesh
V. Vora, ATP, SUDA for their valuable time and support
.
REFERENCES
[1] Census of India, 1961 to 2011 – population data for villages of Surat District
[2] City Development Plan of - Amritsar (2026), Rajkot (2005-12), Surat (2006-12) and (revised CDP, 2008-
13), Vadodara (2006-12) and Draft Development Plan of Ahmedabad (2013)
[3] Conference proceeding of “Combining Deterministic and Stochastic Population Projections”, 28-30 April
2010, Lisbon, Portugal, United Nations statistical commission and Economic commission for Europe.
[4] Donald J. Bogue, Kenneth Hinze and Michael White, “Techniques of Estimating Net Migration” (Chicago:
Community and Family Study Center, University of Chicago, 1982)
[5] George W. Barclay, "The study of mortality, “Techniques of Population Analysis” (New York: John Wiley
and Sons, 1958) 123-134
[6] James C. Raymondo, "Survival Rates: Census and Life Table Methods, “Population Estimation and
Projection” (New York: Quorum Books, 1992) 43-60
[7] Report on “Urbanisation has touched tribal areas in Gujarat”, Manish Bhardwaj, Oct 17, 2011, Agency:
DNA
[8] Sergei Scherbov, Marija Mamolo, Wolfgang Lutz. 2007, “Probabilistic Population Projections for the 27
EU Member States Based on Eurostat Assumptions”, International Institute for Applied Systems Analysis,
Luxemburg, Austria.
[9] Steve McKelvey, July 1995, “Malthusian Growth Model”,Department of Mathematics, Saint Olaf College,
Northfield, Minnesota
[10] United Nations Population Division, “World Urbanization Prospects: The 2007 Revision Population
Database”, accessed online, Sept. 28, 2009
[11] Virginia Population Projections, “Understanding Population Projections, demographic & workforce”,
Weldon cooper center for public service, university of Virginia
[12] World Urbanization Prospects, the 2011 Revision “, United Nations, Department of Economic and Social
Affairs, Population Division: New York 2012](https://image.slidesharecdn.com/fullpaperproceeding-140331060233-phpapp02/85/Full-paper-proceeding-531-320.jpg)


![ISBN: 978-81-929339-0-0
National Conference on: “Trends and Challenges of Civil Engineering in Today’s Transforming World”
29th March, 2014, Civil Engineering Department S.N.P.I.T. & R.C., Umrakh
VIII. CONCLUSION
The following findings are derived based on the present study:
1. Based on performance results of ANN & MLR models it is found that an MLR model
performs better than ANN.
2. With rigorous exercise on different aspects such as selection of an appropriate
algorithm, transfer function best suits to the data, number of hidden layers, number of
neurons in each hidden layers, number of epochs, artificial neural network models
performance can be further improved.
3. The long term time scale effect of data is observed in both the techniques where in
value of R2
is higher.
4. The short term time scale effect of data is reflected in a lower value of R2
.
ACKNOWLEDGMENT
We are thankfully acknowledge to Mr. J. N. Patel, Chairmain Vidyabharti Trust, Mr.
K.N.Patel, Hon. Secretary, Vidyabharti Trust, Dr. H. R. Patel, Director, Dr. J. A. Shah,
Principal, S.N.P.I.T.&R.C.,Umrakh, Bardoli, Gujarat,India for their motivational &
infrastructural supports.
REFERENCES
[1] Adhikari Alok, Patra K.C. and Das S.K. (2013),’Prediction of Discharge with Elman and Cascade Neural
Networks’ Research Journal of Recent Sciences, Vol. 2(ISC-2012), pp. 279-284.
[2] Agarwal A. and Singh R.D. (2004), “Runoff modeling through back propagation artificial neural network
with variable rainfall-runoff data “Water resources Management, Vol. 18.
[3] ASCE TASK Committee on Application of ANNs in hydrology,(2000). “Artificial neural networks in
hydrology II: Hydrologic applications”. Journal of Hydrologic Engineering.Vol.5 (2)
[4] K. P. Sudheer and S. K. Jain (2003) “Radial Basis Function Neural Network for Modeling Rating Curves”
Journal of Hydrologic Engineering Vol. 8, No. 3, pp. 161-164
[5] Emad H. Habib and Ehab A. Meselhe (2006)” Stage–Discharge Relations for Low-Gradient Tidal Streams
Using Data-Driven Models” Journal of Hydraulic Engineering, Vol. 132, No. 5 , pp 482-492
[6] Ani1 K. Jain (1996) Artificial Neural Networks: A tutorial (March 1996), IEEE, pp.31-44
[7] Bhola N.S. Ghimire and M. Janga Reddy (2010) “Development of stage-discharge rating curves in river
using genetic algorithms and model tree.”pp.1-11
[8] Mahesh Pal and Arun Goel 2006 “Development of Stage-Discharge Relation Using Support Vector
Machines” World Environmental and Water Resource Congress, pp.1-10
[9] S. K. Jain and D. Chalisgaonkar 2000 “Setting Up Stage-Discharge Relations Using ANN” Journal of
Hydrologic Engineering, Vol. 5, No. 4, pp-428-433
[10] Zhiging Kou 2003 “Use of Artificial Neural Network for Predicting Stage- Discharge Relationship and
water quality parameters for selected Hawai streams”.](https://image.slidesharecdn.com/fullpaperproceeding-140331060233-phpapp02/85/Full-paper-proceeding-541-320.jpg)

![ISBN: 978-81-929339-0-0
National Conference on: “Trends and Challenges of Civil Engineering in Today’s Transforming World”
29th March, 2014, Civil Engineering Department S.N.P.I.T. & R.C., Umrakh
most other materials. It can be formed into different desired shape and sizes right at the
construction site.
B. Self compacting concrete
Self-consolidating concrete (SCC) represents one of the most outstanding advances in
concrete technology in recent decades.SCC is a concrete with the ability to compact itself by
means of its own weight without the requirement of vibration. It is able to fill reinforcement
spaces and voids, even in highly reinforced concrete members, and it flows without
segregation [2]. Previous investigations showed that the use of fly ash and blast furnace slag
in SCC reduced the dosage of superplasticizer needed to obtain a similar slump flow as
compared to concrete made with Portland cement only [8]. In addition, the use of fly ash
improved the rheological properties and reduced thermal cracking of the produced concrete
[3]. Due to the differences in mixture design, placement, and consolidation techniques, the
strength and durability of SCC may differ from those of conventional concrete, and thus,
require thorough investigation [7]. The problem of durability still exists, particularly in terms
of the physicochemical properties that are essential in order to avoid corrosion of rebar [5].
Self compacting concrete is defined as a concrete which is capable of self consolidating
without any external efforts like vibration, floating, poking etc. The mix is therefore required
to have ability of passing, ability of filling and ability of being stable. Concrete is
heterogeneous material and the ingredients having various specific gravity values and hence
it is difficult to keep them in cohesive form. This is principally true when the consistency is
too high.
C. Durability of concrete
A durability concrete is one that performs satisfactorily in the working environment
during its anticipated exposure conditions during service. Inadequate durability manifests
itself by deterioration which can be due to external factors or to internal causes within the
concrete itself. The various actions can be physical, chemical or mechanical. Mechanical
damage is caused by impact, abrasion, erosion or cavitations. The chemical causes of
deterioration include the alkali-silica and alkali-carbonate reactions. External chemical attack
occurs mainly through the action of aggressive ions, such as chlorides, sulphates, or of carbon
dioxide, as well as many natural or industrial liquids and gases. The damaging actions can be
of various kinds and can be direct or indirect.
Physical causes of deterioration include the effects of high temperature or of the
difference in thermal expansion of aggregate and of the hardened cement paste. An important
cause of damage is alternating freezing and thawing of concrete and the associated action of](https://image.slidesharecdn.com/fullpaperproceeding-140331060233-phpapp02/85/Full-paper-proceeding-543-320.jpg)
![ISBN: 978-81-929339-0-0
National Conference on: “Trends and Challenges of Civil Engineering in Today’s Transforming World”
29th March, 2014, Civil Engineering Department S.N.P.I.T. & R.C., Umrakh
de-icing salts. It is observed that the physical and chemical processes of deterioration can act
in a synergetic manner.
Concrete durability has been extensively studied for more than a century, therefore the
origin and the progress of all types of attack are now rather well known. Investigations have
also permitted establishing the rules for preventing or, at least, strongly hindering concrete
deterioration. The rules are simple and easy to apply and do not require any particular
materials or methods [1].
II. LITERATURE REVIEW
A. Concrete
Some chemical reactions occurring between the concrete constituents can produce
expansion and cracking of the hardened material.
The most common reaction is the one between some forms of silica, present in certain
aggregates, and the alkalis of Portland cement. A silica gel containing calcium and alkalis is
formed that tends to absorb water from the surrounding environment and to swell. Swelling
causes stresses: concrete cracking occurs when stresses exceed the tensile strength of the
paste.
When concrete cracks, its permeability increases and the aggressive water penetrates
more easily into the interior, thus accelerating the process of deterioration, Sometimes, the
expansion of concrete causes serious structural problems.
Many concrete structures such as bridges, roads, dams, aqueducts, etc., are permanently
or occasionally in contact with water. Pure and acidic waters attack the cement paste by
initially leaching the calcium hydroxide and then decomposing the other hydrated
compounds. The lime loss results in greater permeability and lower strength of concrete.
Calcium, sodium, magnesium and ammonium sulphates attack the cement paste forming,
according to the circumstances, gypsum (CaSO4
·2HO) and ettringite
(3CaO·Al2
O·3CaSO·32HO). Formation of both compounds is associated with expansion that
can cause diffuse cracks.
Sea water is dangerous for both plain and reinforced concrete because of its high salt
content (about 3.5%), but in fact the attack is far less serious than expected since
deterioration appears to be due more to weight loss than to expansion and cracking.
Throughout its service life, concrete is subjected to thermal and hygrometric variations
caused by the heat of hydration of cement and the changes in temperature and humidity of the
environment. Another deterioration factor is the crystallization of salts into the concrete
pores.
B. Self-compacting concrete
The Self Compacting Concrete is an innovative concrete that does not require vibration
for placing and compaction. It is able to flow under its own weight, completely filling
formwork and achieving full compaction, even in the presence of congested reinforcement.
The hardened concrete is dense, homogeneous and has the same engineering properties and
durability more than traditional vibrated concrete](https://image.slidesharecdn.com/fullpaperproceeding-140331060233-phpapp02/85/Full-paper-proceeding-544-320.jpg)
![ISBN: 978-81-929339-0-0
National Conference on: “Trends and Challenges of Civil Engineering in Today’s Transforming World”
29th March, 2014, Civil Engineering Department S.N.P.I.T. & R.C., Umrakh
It is environmental-friendly, as industrial wastes are used and concreting is noise-free. It
Reduced equipment costs as no vibration are required. It reduced manpower (example-
against 150 nos. for normal concreting, 50 nos. for SCC were used in one of the sites.)
Shortened construction time (E.g. against 15 hrs. for normal concreting, 11 hrs. for SCC.)
Early strength gain reduced formwork costs as no. of repetitive uses with SCC are more than
with normal concrete (50% roughly more.). Innovative design, more complex shape, thinner
section, etc are possible [4].
Reduced bleeding, proper compaction even in congested areas, no honeycombing etc
Safe working environment is possible due to the elimination of manual labour (vibrating
operator, mason etc.) for compaction and finishing works. Fewer defects and hence reduced
remedial work, improved durability, easier placing, better surface finishing, decreased
Permeability: Increased density and long term pozzolanic action of fly ash, which ties up free
lime, results in fewer bleed channels and decreases permeability. Increased durability: Dense
fly ash concrete helps keep aggressive compounds on the surface, where destructive action is
lessened [6].
The material having higher specific gravity would like to settle down which makes the
mix no more a concrete and it becomes system of sediment layers of concrete ingredients. To
overcome this, one can add more amounts of fines and use super-plasticizers. Super
plasticisers reduce water demand and at the same time increase fluidity. However, there is a
probability of bleeding and mix may become adhesive. To overcome this problem viscosity-
modifying agent (VMA) is required to be added. VMA is a pseudo plastic agent, which
thickens the water and keeps the mixture under suspension, providing segregation resistance.
The principle of sedimentation velocity is inversely proportional to the viscosity of the
floating medium is applied in the system. The VMA offers high shear resistance to the
ingredients at rest and less shear resistance at movement and this property keeps the coarser
particles under suspension in self-compacting concrete.
III. CONCLUSION
SCC gives good durability properties as compared to the ordinary concrete because of
SCC is dense concrete compare to ordinary vibrated concrete.
The strength of SCC is higher than ordinary concrete because of addition of super
plasticizer in SCC to maintain flow ability gives proper compaction of concrete which
enhance all properties of SCC.
SCC gives good finishing as compared to ordinary concrete without any external
mean of compaction.
ACKNOWLEDGMENT
I express my heartfelt thanks to my Guide Dr. Atul K. Desai, Prof. Applied Mechenics
Department, SVNIT, Surat and Dr. Santosh G. Shah, Dean R&D, HOD, Civil Engineering
Department, ITM, Vadodra for their valuable guidance and constant inspiration during my
research work.](https://image.slidesharecdn.com/fullpaperproceeding-140331060233-phpapp02/85/Full-paper-proceeding-545-320.jpg)
![ISBN: 978-81-929339-0-0
National Conference on: “Trends and Challenges of Civil Engineering in Today’s Transforming World”
29th March, 2014, Civil Engineering Department S.N.P.I.T. & R.C., Umrakh
REFERENCES
[1] Franco Massazza “Durability of concrete and service life of structures: two solvable problems”
Italcementi Group, Italy
[2] Joseph A, Khayat Kamal H. “Kinetics of formwork pressure drop of selfconsolidating concrete
containing various types and contents of binder.” Cem Concr Res 2005;35(8):1522–30.
[3] Kurita M, Nomura T. “Highly-flowable steel fiber-reinforced concrete containing fly ash”. In:
Malhotra VM, editor. Am Concr Inst SP, 178. p. 159–75.
[4] N R Gaywala and D B Raijiwala “Self compacting concrete: A concrete of next decade” Journal of
Engineering Research and Studies, Vol. II, Issue IV, October-December, 2011, PP 213-218
[5] Nehdi M, Bassuoni M. “Benefits Limitations and research needs of selfcompacting concrete
technology in the Arabian Gulf”: a holistic view. In: The annual concrete technology and corrosion
protection conference, Dubai, UAE; 2004. p. 12.
[6] Prof. Kishor S. Sable, Prof. Madhuri K. Rathi “Comparison of normal compacted concrete and self
compacted concrete in shear & torsion” International Journal of Computer Technology and Electronics
Engineering (IJCTEE) Volume 2, Issue 4, August 2012
[7] Stéphan A, Gilles E, Vincent W. “Estimates of self-compacting concrete ‘potential’ durability”. Constr
Build Mater 2007;21(10):1909–17.
[8] Yahia A, Tanimura M, Shimabukuro A, Shimoyama Y. “Effect of rheological parameters on self
compactability of concrete containing various mineral admixtures.” In: Skarendahl A, Petersson O,
editors. Proceedings of the first RILEM international symposium on self-compacting concrete,
Stockholm; September 1999. p. 523–35.
[9] www.google.com](https://image.slidesharecdn.com/fullpaperproceeding-140331060233-phpapp02/85/Full-paper-proceeding-546-320.jpg)

![ISBN: 978-81-929339-0-0
National Conference on: “Trends and Challenges of Civil Engineering in Today’s Transforming World”
29th March, 2014, Civil Engineering Department S.N.P.I.T. & R.C., Umrakh
on the packing ability of individual aggregates, and, therefore, potential for optimizing
blended aggregates.
II. RESEARCH OBJECTIVES
The objective of this research is to find combined aggregate gradations, using locally
available aggregate sources, which will significantly reduce the amount of cement required
without compromising fresh properties of self compacting concrete. To achieve this objective
several combination of aggregate was tested with different binder volume keeping constant
water binder ratio, A results show that aggregates with maximum packing density reveals
excellent workability of self compacting concrete.
III. LITERATURE REVIEW
In many fields of materials science it is important to know how densely a particle
mixture can be packed. The “packing density” is the ratio of the particle volume and the
volume of the surrounding container needed for a random close packing of the particles.
Proportioning of aggregates for concrete is influenced by geometrical characteristics of
aggregates such as shape, angularity, texture, particle size distribution (PSD), wall effect and
method of compaction. These parameters are collectively reflected in terms of the packing
density [2, 6].
Packing density of aggregates is an indicator of the voids content. Aggregates with
higher packing density result in lesser void content, in turn minimizing the volume of paste to
fill up the voids. Apart from economic benefit due to lower cement content, research has
shown that the packing density has significant influence on the fresh and hardened properties
of concrete [5, 10]. Moreover, higher fraction of aggregates results in enhancement of
hardened concrete properties such as drying shrinkage, creep, strength and stiffness [7]. The
first work published on particle packing for concrete was by Ferret in 1892 [8].
In 1907, Fuller and Thompson experimentally investigated the importance of size
distribution of aggregates on the properties of concrete, on the basis of packing of constituent
materials[4]. Later, a number of research studies were devoted to developing models for
proportioning particles to attain densest packing. A review of particle packing theories can be
found elsewhere [13]. Theoretical models are always desirable for providing a general
platform for an alternative optimisation of aggregates, but the development is extremely
difficult. The applicability of the theoretical models is quite good only for particles that are
almost spherical in shape [12]. Many theoretical models are available for predicting the](https://image.slidesharecdn.com/fullpaperproceeding-140331060233-phpapp02/85/Full-paper-proceeding-548-320.jpg)
![ISBN: 978-81-929339-0-0
National Conference on: “Trends and Challenges of Civil Engineering in Today’s Transforming World”
29th March, 2014, Civil Engineering Department S.N.P.I.T. & R.C., Umrakh
packing density of aggregates. However, very few models are capable of predicting the
packing densities and behaviour of concrete precisely [6,].
Experimental studies on packing of particles also gained interest on par with theoretical
studies. In a study by Jones et al., the applicability of particle packing models to both
aggregate and powder phases was evaluated. The largest improvements in the void ratio were
achieved with aggregate phase and only small improvements in voids ratio could be achieved
with the powder phase. Moreover, proportioning concrete mixtures based on particle packing
up to powder phase tended to produce harsh mixes. This result suggests the use of packing
density concept specifically for the optimisation of aggregate phase [9]. In another study,
experiments were carried out to investigate the influence of packing density of concrete
mixtures on their properties by using quartz sand and crushed granite aggregates [1].
In study by Prakash Nanthagopalan and Manu Santhanam, 2012, it was observed that
the mixtures with maximum packing density resulted in minimum porosity, minimum
permeability, maximum slump and maximum compressive strength. A number of studies
were conducted on packing density for ternary systems [14, 11]. Generally, the packing
density of ternary mixtures is represented in a triangular diagram. The range of proportions of
aggregates for normal concrete compositions, when represented in the ternary packing
diagram (TPD), is relatively small compared to the available combinations of aggregates in
the diagram. Small variations within this range may have large effects on the rheological
behaviour of concrete [7]. This is applicable to SCC also.
Self-compacting concrete (SCC) mixture proportioning is an optimisation problem that
greatly depends on the characteristics of all materials. Adequate information is available for
the selection of cementitious materials, admixtures and their proportions for SCC. However,
limited information is available for the selection of combination of aggregates despite their
significant influence on the properties of SCC. Hence, there is a need for establishing a
practicable method for proportioning the aggregates for SCC. Therefore, in this study, a new
method was used to determine the optimal aggregate combination giving maximum packing
density. This proposed approach, irrespective of the gradation, shape and size of the
aggregates, can be used with confidence for optimising the aggregate combinations without
any predefined assumptions.
The packing density of aggregates was determined experimentally, using a modified
version of the test procedure described in ASTM C 29[3]. Generally, when aggregates are
mixed and poured into a container by using scoop or shovel, two types of subjectivities are
encountered during the measurement of packing density. The height from which the](https://image.slidesharecdn.com/fullpaperproceeding-140331060233-phpapp02/85/Full-paper-proceeding-549-320.jpg)
![ISBN: 978-81-929339-0-0
National Conference on: “Trends and Challenges of Civil Engineering in Today’s Transforming World”
29th March, 2014, Civil Engineering Department S.N.P.I.T. & R.C., Umrakh
aggregates are poured and the method of pouring may lead to error in the measurement of the
packing density. Though the standard deviation for a single operator for coarse aggregate
(maximum size 25 mm) and fine aggregate is 14 kg/m3
in ASTM C 29, it would be ideal to
obtain consistent test results irrespective of the operator. The error due to subjectivity in
measuring the packing density is eliminated by using the method developed in this study.
Majella Anson-Cartwright summary of Recent Studies on Optimization Techniques for
Combined Aggregate Blends [15]. The results of previous research varied greatly as different
methodologies and aggregate sources were used. The results are summarized in Table 1.
TABLE 1: SUMMARY OF RECENT STUDIES ON OPTIMIZATION TECHNIQUES FOR
COMBINED AGGREGATE BLENDS [15].
Researcher(s) Methodology Aggregate
Source
Results (highlighted)
Goltermann,
Johansen and
Palbol (1997)
Modified Toufar
Model
Denmark Effectively optimizes packing of aggregates for binary
and ternary blends
Dewar (1999) Theory of Particle
Mixtures
United
Kingdom
Effectively optimizes packing of aggregate blends
↓ water demand maintaining adequate cohesion to
resist segregation
Jones, Zheng
and Newlands
(2002)
Modfied Toufar
Model, Theory of
Particle Mixtures
Scotland Both packing models are effective at optimizing
packing of aggregates for binary and ternary blends
Panchalan and
Ramakrishnan
(2007)
Talbot’s Grading
Curve
South Dakota ↑ compressive and flexural strength for n = 0.45 with
adequate workability
Shilstone
(1990)
Coarseness Factor
Chart
Riyadh,
Saudi
Arabia
Dallas, TX
↓water demand ↑workability↑compressive strength
Holland
(1990)
8-18 Distribution Atlanta, GA ↓water demand
↓cement demand
↓drying shrinkage
↑workability ↑compressive strength
NRMCA
(Meininger,
2003)
8-18 Distribution United States Difficult for combined aggregate blends to fall within
limits, and is also not a necessity for combined
aggregate blends to fall within limits to have adequate
workability and finishability](https://image.slidesharecdn.com/fullpaperproceeding-140331060233-phpapp02/85/Full-paper-proceeding-550-320.jpg)

![ISBN: 978-81-929339-0-0
National Conference on: “Trends and Challenges of Civil Engineering in Today’s Transforming World”
29th March, 2014, Civil Engineering Department S.N.P.I.T. & R.C., Umrakh
TABLE 3 PARTICLE SIZE DISTRIBUTION OF AGGREGATES.
Sieve size
(mm)
River sand
(% passing)
12.5 mm max.
size (% passing)
20 mm max.
size (% passing)
40 100 100 100
20 100 100 98
12.5 100 96 32
10 100 39.6 10
6.3 100 0.2 0
4.75 91.4 0 0
2.36 81 0 0
1.18 59.5 0 0
0.6 31.1 0 0
0.3 7.5 0 0
0.15 0 0 0
VI. OPTIMISATION OF AGGREGATE COMPOSITION
In many fields of materials science it is important to know how densely a particle
mixture can be packed. The “packing density” is the ratio of the particle volume and the
volume of the surrounding container needed for a random close packing of the particles.
The packing density of aggregates was determined experimentally, using a modified
version of the test procedure described in ASTM C 29[3]. Generally, when aggregates are
mixed and poured into a container by using scoop or shovel, two types of subjectivities is
encountered during the measurement of packing density. The height from which the
aggregates are poured and the method of pouring may lead to error in the measurement of the
packing density. Though the standard deviation for a single operator for coarse aggregate
(maximum size 25 mm) and fine aggregate is 14 kg/m3
in ASTM C 29, it would be ideal to
obtain consistent test results irrespective of the operator. The error due to subjectivity in
measuring the packing density is eliminated by using the method developed in this study.
In the present study, two different sizes of coarse aggregates (10 mm max. size and 20 mm
max. size) and river sand were used. The aggregate combination was selected based on the
particle packing concept. Experiments were conducted to determine the packing density of
different combination of aggregates (fine aggregate, coarse aggregates 10 mm maximum size
and 20 mm maximum size).
The test procedure is as follows:](https://image.slidesharecdn.com/fullpaperproceeding-140331060233-phpapp02/85/Full-paper-proceeding-552-320.jpg)

![ISBN: 978-81-929339-0-0
National Conference on: “Trends and Challenges of Civil Engineering in Today’s Transforming World”
29th March, 2014, Civil Engineering Department S.N.P.I.T. & R.C., Umrakh
20 55 30 15 21.28 9.79 4.64 0.672
21 60 20 20 23.09 6.49 6.15 0.675
22 60 30 10 22.94 9.68 3.06 0.674
23 10 80 10 4.02 27.13 3.21 0.620
24 10 10 80 4.18 3.53 26.77 0.623
25 80 10 10 28.19 2.97 2.82 0.652
26 20 60 20 7.79 19.71 6.23 0.615
27 20 40 40 8.00 13.49 12.79 0.625
28 20 20 60 8.01 6.76 19.21 0.620
VII. CONCLUSIONS
It was observed from packing density test that; individual aggregate has more void
contain then combination of all aggregate.
The coarse aggregate (20 mm maximum size) contain more voids then 10 maximum size
coarse aggregate as well as sand.
The aggregate combination of 50:20:30 (Fine aggregate: Coarse aggregate 10 mm
maximum size: Coarse aggregate 20 mm maximum size) by volume give minimum void
contain. So it gives maximum packing density for all given other combination of
aggregate.
ACKNOWLEDGMENT
I express my heartfelt thanks to my Guide Dr. Atul K. Desai, Prof. Applied Mechenics
Department, SVNIT, Surat and Dr. Santosh G. Shah, Dean R&D, HOD, Civil Engineering
Department, ITM, Vadodra for their valuable guidance and constant inspiration during my
research work.
REFERENCES
[1] Andreasen AHM and Andersen J “Uber die beziehung zwischen kornabstufung und zwischenraum in
produkten aus losen kornern (mit einigen experimenten).” Kolloid Z, 1930 50:217–228.
[2] ASTM C 29 “Standard test method for bulk density (Unit Weight) and voids in aggregate.” American
Society for Testing and Materials Standards, West Conshohocken, 2001
[3] Fuller W B, Thompson S E. “The laws of proportioning concrete. Transactions”, American Society of
Civil Engineers; 1907. p. 67–172.
[4] Glavind M and Pedersen EJ “Packing calculations applied for concrete mix design.” In: Proceedings
of creating with concrete, University of Dundee, 1999, pp 1–10
[5] Goltermann P, Johansen V, Palbol L “Packing of aggregates: an alternative tool to determine the
optimal aggregate mix.” ACI Mater J , 1997, 94(5):435–443
[6] Johansen V, Andersen P J. “Particle packing and concrete properties” Material Science of Concrete
II. Ohio: The American Ceramic Society; 1991. p. 111–47.
[7] Joisel A “Composition des betons hydrauliques.” Ann IITBTP, 1952 58:992–1065](https://image.slidesharecdn.com/fullpaperproceeding-140331060233-phpapp02/85/Full-paper-proceeding-555-320.jpg)
![ISBN: 978-81-929339-0-0
National Conference on: “Trends and Challenges of Civil Engineering in Today’s Transforming World”
29th March, 2014, Civil Engineering Department S.N.P.I.T. & R.C., Umrakh
[8] Jones MR, Zheng L, Newlands MD “Comparison of particle packing models for proportioning
concrete constituents for minimum voids ratio.” Mater Struct, 2002, 35:301–309
[9] Petersson O, Billberg P. Y and Van B.K., “A model for self-compacting concrete, Poduction Methods
and Workability of Concrete,” Edited by P.J.M. Bartos, D.L. Marrs y D.J. Cleand, Editorial: E & FN
Spon, Londres, 1996
[10] Ridgway K and Tarbuck KJ “Particulate mixture bulk densities.” Chem Proc Eng , 1986, 49:103–105.
[11] Romagnoli M and Siligardi C “Comparison of models for dense particle packing.” In: Proceedings of
Congresso, AIMAT Ancona, 29 Giugno-2, Luglio, 2004
[12] Senthilkumar V, Santhanam M. “Particle packing theories and their application in concrete mixture
proportioning: a review.” The Indian Concrete Journal 2003:1324–31.
[13] Standish N and Yu A B “Porosity calculations of ternary mixtures of particles.” Powder Technol,
1987, 49(3):249–253
[14] Andersen PJ “Control and monitoring of concrete production.” Ph.D Thesis, Academy of Technical
Sciences, The Technical University of Denmark, 1990
[15] Majella Anson-Cartwright “Optimization of Aggregate Gradation Combinations to Improve Concrete
Sustainability” M Sc Thesis, Master of applied science, Department of civil engineering, University of
Toronto, 2011](https://image.slidesharecdn.com/fullpaperproceeding-140331060233-phpapp02/85/Full-paper-proceeding-556-320.jpg)


![ISBN: 978-81-929339-0-0
National Conference on: “Trends and Challenges of Civil Engineering in Today’s Transforming World”
29th March, 2014, Civil Engineering Department S.N.P.I.T. & R.C., Umrakh
REFERENCES
[1] http://www.ncbi.nlm.nih.gov/pubmed/12397675
[2] Soly J. Arceivala, Shyam R. Asolekar, Wastewater Treatment For Pollution Control And Reuse, Third
Edition, Page No. 173.
[3] L. Korsak,Anaerobic Treatment of Wastewater In A Uasb Reactor, Licentiate Thesis In Chemical
Engineering, 2008.
[4] G. Tchobanoglous, F. L. Burton, H. D. Stensel, Wastewater Engineering Treatment And Reuse,
Metcalf And Eddy, Page No. 1007.
[5] M. Uldal, Effect of Hydraulic Loading Variation on a Pilot Scale UASB Reactor Treating Domestic
Wastewater at Vapi CETP, India, Master Thesis number: 2008.
[6] Lettinga, G., Roersma, R. and Grin, P. (1983). Anaerobic Treatment of Raw Domestic Sewage at
Ambient Temperatures Using a Granular Bed UASB Reactor. Biotechnology and Bioengineering 25
(7): 1701–1723. The first paper describing the process.](https://image.slidesharecdn.com/fullpaperproceeding-140331060233-phpapp02/85/Full-paper-proceeding-564-320.jpg)

![ISBN: 978-81-929339-0-0
National Conference on: “Trends and Challenges of Civil Engineering in Today’s Transforming World”
29th March, 2014, Civil Engineering Department S.N.P.I.T. & R.C., Umrakh
another supplier’s product cost may be the lowest, this is very good for a company, but at the
same time the delivery performance may be the worst. Suppliers have been acknowledged as
the best intangible assets of any business organization (Muralidharan et al. 2002)[1]
. However,
selecting the right suppliers for a long term relationship is a relevant procurement issue that
demands judicious attention. According to sarkis et al. (2002)[2]
, "supplier selection problem
has become one of the most important issues for establishing an effective supply chain
system." The conventional supplier selection approach may sometime lead towards improper
supplier selection which brings partial failure of the project. Present Supplier selection
process of construction companies in Gujarat state of India was studied in the beginning of
this study. It was that present approach lacks scientific methodology & does not consider
multi-criteria in decision making. There is a need of scientific supplier selection approach.
Such approach will provide the best selection of supplier considering all aspects of the
process. Hence this study is carried out with a aim to develop a mathematical approach to
supplier selection process with the help of Analytical Hierarchy Process technique (AHP).
II. LITERATURE REVIEW
Vendor selection of a telecommunications system is an important problem to a
telecommunications company as the telecommunications system is a long-term investment
for the company and the success of telecommunications services is directly acted by the
vendor selection decision (Maggie C. Y. Tam 2000). The proposed model is applied to two
vendor selection problems. In both cases, the decisions reached by using the model agreed
with those obtained by using the pre-existing vendor selection process. Using the AHP
model, the criteria for vendor selection are clearly identified and the problem is structured
systematically. This enabled decision-makers to examine the strengths and weaknesses of
vendor systems by comparing them with respect to appropriate criteria and sub criteria. The
analytic hierarchy process (AHP) can be very useful in involving several decision-makers
with various conflicting objectives to arrive at a consensus decision. Using the AHP model,
the criteria for vendor selection was clearly identified and the problem was structured
systematically. A well-researched methodology was adopted for the synthesis of priorities
and the measurement of consistencies (sanjaykumar et.al 2009). Industries has been classifies
into small scale, medium scale and large scale. Various criteria for vendor selection process
as received from the expert have been identified. These criteria have been compared using
average matrix, priority matrix and overall priority matrix. The expert views as obtained
through a questionnaire and then quantifying the obtained subjective views, using Analytical](https://image.slidesharecdn.com/fullpaperproceeding-140331060233-phpapp02/85/Full-paper-proceeding-566-320.jpg)

![ISBN: 978-81-929339-0-0
National Conference on: “Trends and Challenges of Civil Engineering in Today’s Transforming World”
29th March, 2014, Civil Engineering Department S.N.P.I.T. & R.C., Umrakh
Figure I1: Proposed Supplier Selection Process
V. ANALYTICAL HIERARCHY PROCESS
The analytic hierarchy process (AHP) is a structured technique for organizing and analyzing
complex decisions. Based on mathematics and psychology, it was developed by Thomas L.
Saaty [3] in the 1970s and has been extensively studied and refined since then. It has
particular application in group decision making, and is used around the world in a wide
variety of decision situations, in fields such as government, business, industry, healthcare,
and education. Users of the AHP first decompose their decision problem into a hierarchy of
more easily comprehended sub-problems, each of which can be analyzed independently. The
elements of the hierarchy can relate to any aspect of the decision problem—tangible or
intangible, carefully measured or roughly estimated, well- or poorly-understood—anything at
all that applies to the decision at hand.
Once the hierarchy is built, the decision makers systematically evaluate its various elements
by comparing them to one another two at a time, with respect to their impact on an element
above them in the hierarchy. In making the comparisons, the decision makers can use
concrete data about the elements, but they typically use their judgments about the elements'
relative meaning and importance. It is the essence of the AHP that human judgments, and not
just the underlying information, can be used in performing the evaluations.
The AHP converts these evaluations to numerical values that can be processed and compared
over the entire range of the problem. A numerical weight or priority is derived for each
element of the hierarchy, allowing diverse and often incommensurable elements to be
compared to one another in a rational and consistent way. This capability distinguishes the
AHP from other decision making techniques.
Step 1: Calling For Public Tender
Step 2: Determination of Key Supplier
Evaluation Criteria
Step 3: Compute Weighted Value of Each
Criteria By AHP Technique
Step 4: Developing Supplier Selection Approach
By TOPSIS Method
Step 5: Validation Of The Result And Finally
Select The Best Supplier](https://image.slidesharecdn.com/fullpaperproceeding-140331060233-phpapp02/85/Full-paper-proceeding-569-320.jpg)


![ISBN: 978-81-929339-0-0
National Conference on: “Trends and Challenges of Civil Engineering in Today’s Transforming World”
29th March, 2014, Civil Engineering Department S.N.P.I.T. & R.C., Umrakh
Rs= 1 −
∑
Here, d = difference between ranks and n = number of parameters being ranked. Spearman's
rank correlation coefficient was calculated to find correlation between different data sets.
Consistency of the data was checked by spearmen correlation co-efficient. The value of
Spearman's rank co-relation coefficient between different groups of cities is very near to 1.
This shows that there is very marginal difference in opinion of experts' for weighting of
criteria and they all exhibit strong positive correlation.
X. CONCLUSION
Present study covers issue of supplier selection approach of current middle level construction
companies of Gujarat state of India. It has been found that no methodical approach is adopted
in supplier selection. Low rates are the only major criteria being considered in selection the
supplier which leads towards partial failure of the project. This study suggests systematic
approach by selecting 26 different criteria for supplier selection. Analytic Hierarchy Process
is suggested for best supplier selection. Ranking of criteria is developed through AHP
technique. The study found that quality of materials, direct cost of material, delivery lead
time, safety measures and standards and certifications are five most important criteria for
supplier selection. Total 75 responses were taken from various purchase managers of
construction companies from cities of Gujarat state of India. Data accuracy was checked by
Spearman’s rank correlation coefficient. Weights were further derived by AHP technique.
Weights derived by AHP technique can be further used in TOPSIS technique to develop
complete supplier selection process with mathematical modelling.
REFERENCES
[1] Muralidharan, C., Anantharaman, N., &Deshmukh. (Fall 2002). A multi-criteria group decision
making model for supplier rating. The Journal of Supply Chain Management, 22-33.
[2] Sarkis, J. and Talluri, S. (2002). “A Model for Strategic Supplier Selection,” Journal of Supply Chain
Management, Volume 38, Number 1, 18-28.
[3] Saaty, T. L. (1990). How to Make a Decision: The Analytic Hierarchy Process, European Journal of
Operational Research, Volume 48, 9-26.
[4] Hamid Reza Sadeghian(2010), Supplier evaluation using loss function and AHP, International
Conference in Dhaka, Jan 2010.
[5] HuseyinSelcukKilic,An integrated approach for supplier selection in multi-item/Multi-supplier
environment By in Applied Mathematical Modeling, 2012.
[6] SedaSen ,Integrated AHP And TOPSIS approach for supplier selection, International Conference on
Manufacturing Engineering and Management, 2012.
[7] Mohammad marufuzzaman ,Supplier evaluation and selection by using the analytic hierarchy process
approach, International Journal of Value Chain Management 2009.
[8] www.wikipedia.org/supplier selection process.
[9] www.gicea.org/list ofconstruction company.
[10]www.google.com/ supplier selection process.
[11]www.sciencedirect.com/ supply chain management.](https://image.slidesharecdn.com/fullpaperproceeding-140331060233-phpapp02/85/Full-paper-proceeding-575-320.jpg)


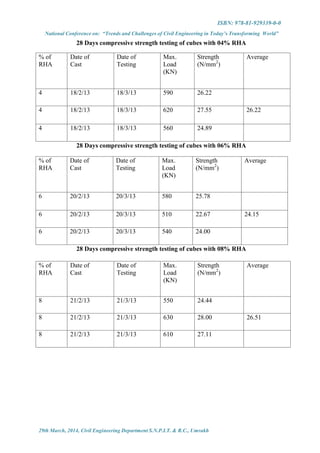

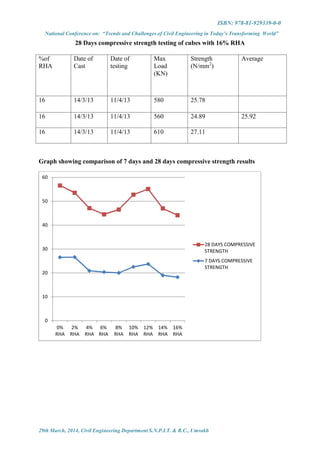

![ISBN: 978-81-929339-0-0
National Conference on: “Trends and Challenges of Civil Engineering in Today’s Transforming World”
29th March, 2014, Civil Engineering Department S.N.P.I.T. & R.C., Umrakh
REFERENCES
[1] Report on Compressive Strength Of Concrete With Rice Husk Ash As Partial Replacement Of
Ordinary Portland Cement
Maurice E. Ephraim, Godwin A. Akeke and Joseph O. Ukpata.
Department of Civil Engineering, Rivers State University of Science and Technology Port Harcourt,
Nigeria.
[2] Study On Properties Of Rice Husk Ash And Its Use As Cement Replacement Material
GhassanAboodHabeeb*, Hilmi Bin Mahmud
Department of Civil Engineering, Faculty of Engineering,University of Malaya, Kuala
Lumpur, Malaysia
[3] Effect Of Rice Husk Ash On Properties Of High Strength Concrete
Dao Van Dong- Doctor, Pham DuyHuu- Professor, Nguyen Ngoc Lan- Engineer
University of Transportation and Communication, Vietnam
[4] Mortar Incorporating Rice Husk Ash: Strength And Porosity
Muhammad Harunur Rashid
Department of Civil Engineering
Khulna University of Engineering & Technology, Bangladesh
[5] Absorption And Permeability Performance Of Selangor Rice Husk Ash Blended Grade 30 Concrete
KARTINI, K.1,*, MAHMUD, H.B.2, HAMIDAH, M.S.3
1The Faculty of Civil Engineering, UniversitiTeknologi MARA, Malaysia.
2The Department of Civil Engineering, University of Malaya, Malaysia.
[6] Study Of Various Characteristic Of Concrete With Rice Husk Ash As A Partial Replacement Of Cement
With Natural Fibers (Coir)
Pravin V Domke1, Sandesh D Deshmukh2,Satish D Kene3. R.S.Deotale4
(Research Scholar, Department Of Civil Engineering, YCCE, Nagpur-10, Maharashtra, India)
[7] The Effects Of Types Of Rice Husk Ash On The Porosity Of Concrete
M.F. NURUDDIN
Associate Profesor Department of Civil Engineering, UniversitiTeknologi PETRONAS Malaysia](https://image.slidesharecdn.com/fullpaperproceeding-140331060233-phpapp02/85/Full-paper-proceeding-604-320.jpg)