Download to read offline


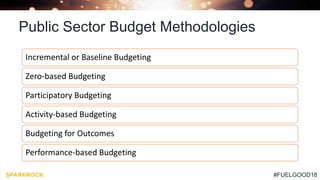
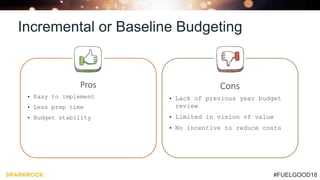
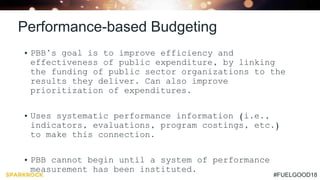
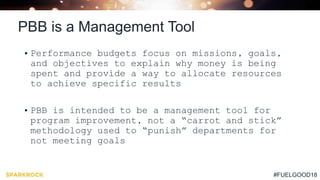
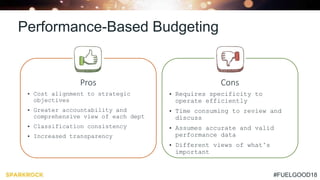


The document discusses public sector budgeting methodologies, with a focus on performance-based budgeting (PBB) as a tool aimed at improving the efficiency and effectiveness of public expenditures. It outlines various budgeting types, their pros and cons, and emphasizes the importance of performance indicators and effective management models for successful implementation. Finally, it highlights how Questica's software can assist organizations in adopting these budgeting practices for better transparency and accountability.


