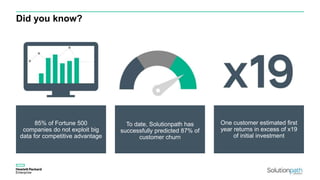
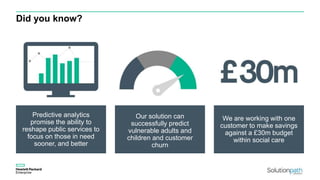
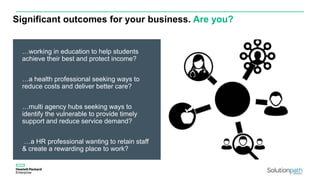
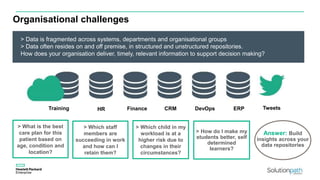
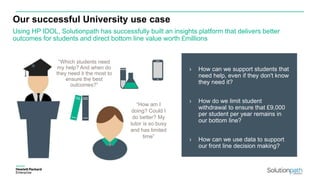
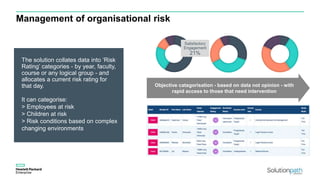
Disruptive (Big) Data Predictive Analytics
2
Did you know?
85% of Fortune 500
companies do not exploit big
data for competitive advantage
To date, Solutionpath has
successfully predicted 87% of
customer churn
One customer estimated first
year returns in excess of x19
of initial investment
Did you know?
Predictive analytics
promise the ability to
reshape public services to
focus on those in need
sooner, and better
Our solution can
successfully predict
vulnerable adults and
children and customer
churn
We are working with one
customer to make savings
against a £30m budget
within social care
Significant outcomes for your business. Are you?
…working in education to help students
achieve their best and protect income?
…a health professional seeking ways to
reduce costs and deliver better care?
…multi agency hubs seeking ways to
identify the vulnerable to provide timely
support and reduce service demand?
…a HR professional wanting to retain staff
& create a rewarding place to work?
Organisational challenges
> Data is fragmented across systems, departments and organisational groups
> Data often resides on and off premise, in structured and unstructured repositories.
How does your organisation deliver, timely, relevant information to support decision making?
> What is the best
care plan for this
patient based on
age, condition and
location?
> Which staff
members are
succeeding in work
and how can I
retain them?
> How do I make my
students better, self
determined
learners?
> Which child in my
workload is at a
higher risk due to
changes in their
circumstances?
Answer: Build
insights across your
data repositories
HR Finance CRM DevOps ERPTraining Tweets
Our successful University use case
Using HP IDOL, Solutionpath has successfully built an insights platform that delivers better
outcomes for students and direct bottom line value worth £millions
› How can we support students that
need help, even if they don't know
they need it?
› How do we limit student
withdrawal to ensure that £9,000
per student per year remains in
our bottom line?
› How can we use data to support
our front line decision making?
“How am I
doing? Could I
do better? My
tutor is so busy
and has limited
time”
“Which students need
my help? And when do
they need it the most to
ensure the best
outcomes?”
Video Testimonial
Nottingham Trent University
Demo Content
The following slides describe the general themes covered in the demonstration
Management of organisational risk
Objective catagorisation - based on data not opinion - with
rapid access to those that need intervention
Satisfactory
Engagement
21%
The solution collates data into ‘Risk
Rating’ categories - by year, faculty,
course or any logical group - and
allocates a current risk rating for
that day.
It can categorise:
> Employees at risk
> Children at risk
> Risk conditions based on complex
changing environments
Personalised and contextual insight
› Receive an objective, 360º view of your
students.
› Easily accessible data allows institutions to
view interactions across the physical and
virtual campus.
› Track student progress against a particular
cohort.
› Add additional data sources with ease to
meet future requirements.
The student analytics process
› Student becomes involved in
Freshers Week (off campus) and
shows as a flatline.
› An alert is sent to the tutor
prompting intervention.
› Notes are added to the system and
the university witnesses an upturn in
engagement.
Benefits realisation
1. Improved student and tutor engagement
› Enriched conversations
› Allows tutor to target those that need support
› Time spent on activities that matter increases
2. Objective measurement of what matters to all students
› Offers standardisation and insights to good practice
› Centralisation of records for 360º view and single source of truth
3. Early interventions ensures better outcomes
› Academic performance improvements
› Reduction in ‘crisis’ recovery
› Improved retention
Contextualise the solution to your function
* Students = Employees
* Student = Child in care
› The same digital footprint from a student journey can similarly be related to a health care or
employee journey
› What care routes are most effective for certain people or circumstances?
› What does the digital footprint for a successful, retained member of staff look like?

Solutionpath - HPE Discover 2015

  • 1.
    Disruptive (Big) DataPredictive Analytics
  • 2.
    Disruptive (Big) DataPredictive Analytics 2
  • 3.
    Did you know? 85%of Fortune 500 companies do not exploit big data for competitive advantage To date, Solutionpath has successfully predicted 87% of customer churn One customer estimated first year returns in excess of x19 of initial investment
  • 4.
    Did you know? Predictiveanalytics promise the ability to reshape public services to focus on those in need sooner, and better Our solution can successfully predict vulnerable adults and children and customer churn We are working with one customer to make savings against a £30m budget within social care
  • 5.
    Significant outcomes foryour business. Are you? …working in education to help students achieve their best and protect income? …a health professional seeking ways to reduce costs and deliver better care? …multi agency hubs seeking ways to identify the vulnerable to provide timely support and reduce service demand? …a HR professional wanting to retain staff & create a rewarding place to work?
  • 6.
    Organisational challenges > Datais fragmented across systems, departments and organisational groups > Data often resides on and off premise, in structured and unstructured repositories. How does your organisation deliver, timely, relevant information to support decision making? > What is the best care plan for this patient based on age, condition and location? > Which staff members are succeeding in work and how can I retain them? > How do I make my students better, self determined learners? > Which child in my workload is at a higher risk due to changes in their circumstances? Answer: Build insights across your data repositories HR Finance CRM DevOps ERPTraining Tweets
  • 7.
    Our successful Universityuse case Using HP IDOL, Solutionpath has successfully built an insights platform that delivers better outcomes for students and direct bottom line value worth £millions › How can we support students that need help, even if they don't know they need it? › How do we limit student withdrawal to ensure that £9,000 per student per year remains in our bottom line? › How can we use data to support our front line decision making? “How am I doing? Could I do better? My tutor is so busy and has limited time” “Which students need my help? And when do they need it the most to ensure the best outcomes?”
  • 8.
  • 9.
    Demo Content The followingslides describe the general themes covered in the demonstration
  • 10.
    Management of organisationalrisk Objective catagorisation - based on data not opinion - with rapid access to those that need intervention Satisfactory Engagement 21% The solution collates data into ‘Risk Rating’ categories - by year, faculty, course or any logical group - and allocates a current risk rating for that day. It can categorise: > Employees at risk > Children at risk > Risk conditions based on complex changing environments
  • 11.
    Personalised and contextualinsight › Receive an objective, 360º view of your students. › Easily accessible data allows institutions to view interactions across the physical and virtual campus. › Track student progress against a particular cohort. › Add additional data sources with ease to meet future requirements.
  • 12.
    The student analyticsprocess › Student becomes involved in Freshers Week (off campus) and shows as a flatline. › An alert is sent to the tutor prompting intervention. › Notes are added to the system and the university witnesses an upturn in engagement.
  • 13.
    Benefits realisation 1. Improvedstudent and tutor engagement › Enriched conversations › Allows tutor to target those that need support › Time spent on activities that matter increases 2. Objective measurement of what matters to all students › Offers standardisation and insights to good practice › Centralisation of records for 360º view and single source of truth 3. Early interventions ensures better outcomes › Academic performance improvements › Reduction in ‘crisis’ recovery › Improved retention
  • 14.
    Contextualise the solutionto your function * Students = Employees * Student = Child in care › The same digital footprint from a student journey can similarly be related to a health care or employee journey › What care routes are most effective for certain people or circumstances? › What does the digital footprint for a successful, retained member of staff look like?