Download as PDF, PPTX


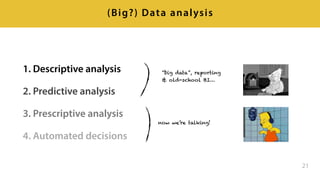


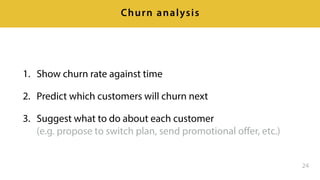
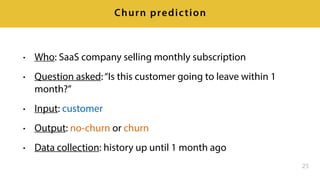
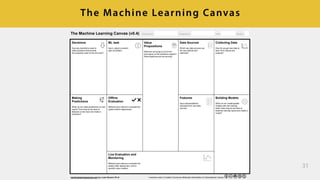
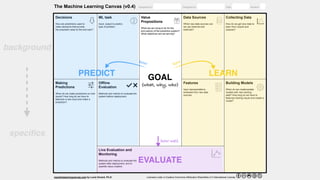
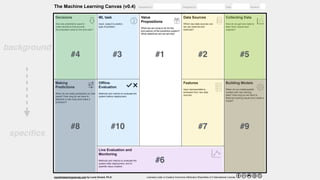
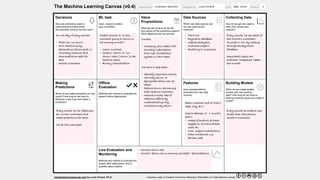
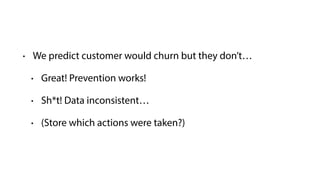

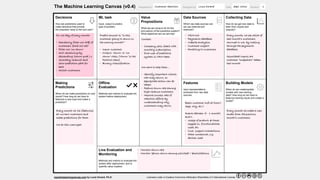
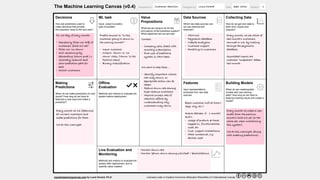
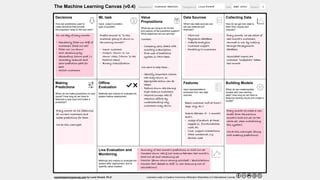
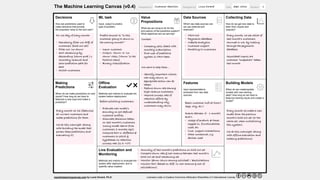
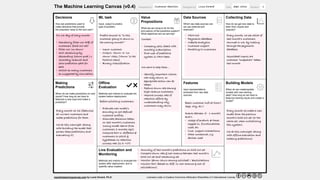
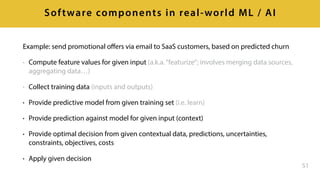

The document discusses the Machine Learning Canvas, a structured framework designed to enhance predictive application implementation and business value across various industries. It focuses on various machine learning tasks, including predictive analysis for customer churn in subscription-based businesses, and provides detailed steps for data collection, model building, and decision-making based on predictions. Additionally, it emphasizes the importance of monitoring and evaluating the effectiveness of the implemented models over time.


![[db tech showcase Tokyo 2017] D35: 何を基準に選定すべきなのか!? ~ビッグデータ×IoT×AI時代のデータベースのアー...](https://cdn.slidesharecdn.com/ss_thumbnails/d35-170912024713-thumbnail.jpg?width=640&height=640&fit=bounds)


