Download as PDF, PPTX


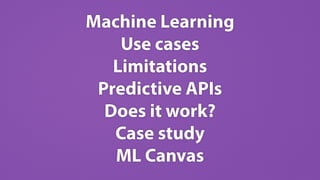
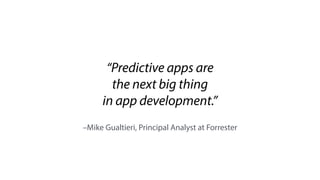


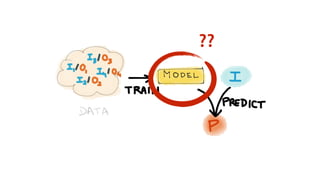


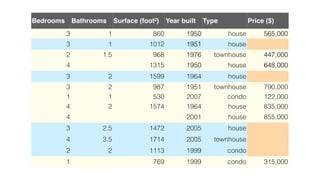
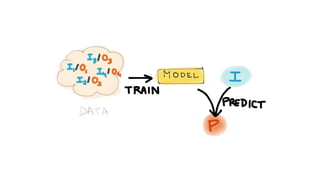
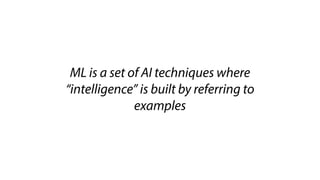


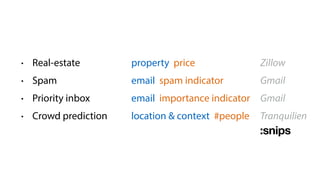


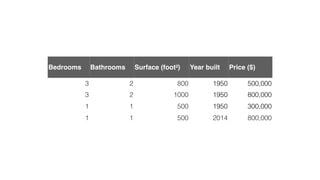


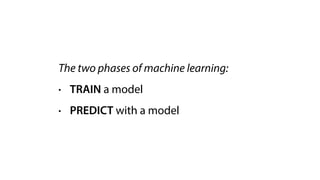
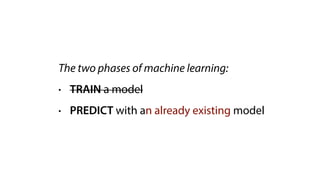


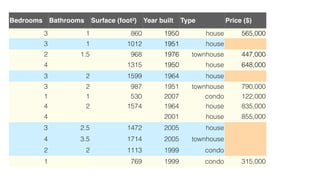
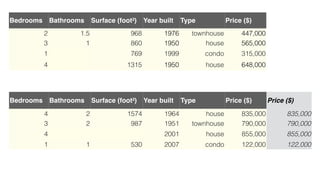


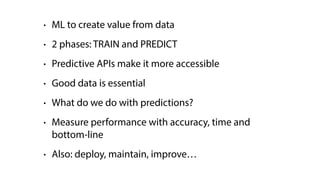


The document discusses the use of predictive APIs and machine learning, emphasizing their growing importance in app development and data utilization. It covers various applications, limitations, and phases of machine learning, specifically focusing on training models and making predictions, along with case studies illustrating churn analysis and real estate pricing. The need for quality data and strategic planning in deploying machine learning solutions is highlighted as crucial for successful outcomes.