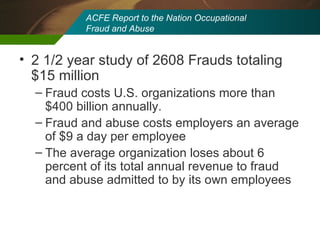
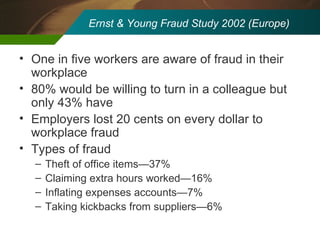
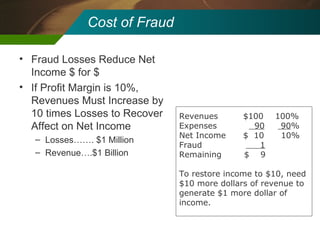
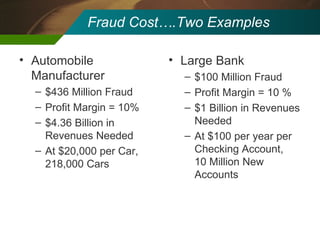
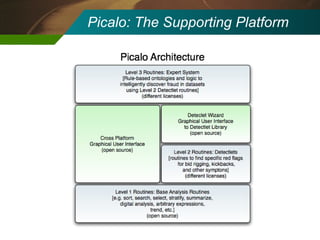
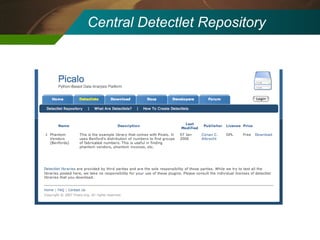
Detectlets for Better Fraud Detection Conan C. Albrecht, PhD Marriott School of Management Brigham Young University
Today’s Presentation Give a few fraud stories Outline the Detectlet vision and Picalo Architecture Show example code and working products Describe future research directions and solicit help
Two Types of Fraud Fraud  on behalf  of an organization Financial statement manipulation to make the company look better to stockholders Also called  management fraud Fraud  against  an organization Stealing assets, information, etc. Also called  employee  or  consumer fraud
ACFE Report to the Nation Occupational  Fraud and Abuse 2 1/2 year study of 2608 Frauds totaling $15 million Fraud costs U.S. organizations more than $400 billion annually. Fraud and abuse costs employers an average of $9 a day per employee The average organization loses about 6 percent of its total annual revenue to fraud and abuse admitted to by its own employees
Ernst & Young Fraud Study 2002 (Europe) One in five workers are aware of fraud in their workplace 80% would be willing to turn in a colleague but only 43% have Employers lost 20 cents on every dollar to workplace fraud Types of fraud Theft of office items—37% Claiming extra hours worked—16% Inflating expenses accounts—7% Taking kickbacks from suppliers—6%
Cost of Fraud Fraud Losses Reduce Net Income $ for $ If Profit Margin is 10%, Revenues Must Increase by 10 times Losses to Recover Affect on Net Income Losses……. $1 Million Revenue….$1 Billion  Revenues $100 100% Expenses   90   90 % Net Income $  10  10% Fraud   1 Remaining  $  9 To restore income to $10, need $10 more dollars of revenue to generate $1 more dollar of income.
Large Bank $100 Million Fraud Profit Margin = 10 % $1 Billion in Revenues Needed At $100 per year per Checking Account,  10 Million New Accounts  Fraud Cost….Two Examples  Automobile Manufacturer $436 Million Fraud Profit Margin = 10% $4.36 Billion in Revenues Needed At $20,000 per Car, 218,000 Cars
A Recent Fraud Large Fraud of $2.6 Billion over 9 years Year 1 $600K Year 3 $4 million Year 5 $80 million Year 7 $600 million Year 9 $2.6 billion In years 8 and 9, four of the world’s largest banks were involved and lost over $500 million Some of the organizations involved:  Merrill Lynch, Chase, J.P. Morgan,  Union Bank of Switzerland, Credit Lynnaise, Sumitomo, and others.
Every Person Has A Price Abraham Lincoln once threw a man out of his office, angrily turning down a substantial bribe.  “Every man has his price”, explained Lincoln, “and he was getting close to mine.”
Examples of Data-Based Detection
Superhuman Workers Summed all hours (normal, OT, DT) per two week period, regardless of invoice or timecard) Workers were logging hours on two timecards for simultaneous jobs
The Family Business Work Orders Authorized By Purchaser
The Family Business Invoice Charges Authorized By Purchaser
The Family Business Work Orders Given To Contractor Crew
The Family Business Tip stated that kickbacks were occurring with a certain company We researched the company and determined which purchaser authorized the work A contractor crew and company purchaser were family
Systematic Increases In Spending
Unexpected Peaks In Spending
Increases In Only Part Of A Trend
Caught by his Pool…
Research Background
Accounting History 1940 SEC Statement: “Accountants can be expected to detect gross overstatements of assets and profits whether resulting from collusive fraud or otherwise” (Accounting Series Release 1940) 1961: “If the ten (auditing) standards now accepted were satisfactory for their purpose we would not have the pleas for guidance on the extent of (auditors’) responsibility for the detection of irregularities we now find in our professional literature.” (Mautz & Sharaf 1961) 1997 - SAS 82 2002 - SAS 99 Expectation Gap
Historical Fraud Research Excellent literature review by Nieschwietz, Shultz, & Zimbelman (2000) Who commits fraud Red flags Expectation gap Auditor expectations Game theory between auditors and management Auditor-client relationships Risk assessment, decision aids Management factors affecting fraud
FS Fraud using Ratio Analysis Hansen, et. al (1996) developed a generalized qualitative-response model from internal sources Green and Choi (1997) used neural networks to classify fraudulent cases Summers and Sweeny (1998) identified FS fraud using external and internal information Benish (1999) developed a probit model using ratios for fraud identification Bell and Carcello (2000) developed a logistic regression model to identify fraud Current work by McKee and by Cecchini and by Albrecht None have found the “silver bullet” in using external information to identify fraud Management (FS) fraud is very difficult to find
What are the Big 4 Doing? Each firm seems to have different groups working on fraud detection No best practices model has emerged IT auditors perform control testing on company systems, not fraud detection Meeting with Bill Titera of EY
Why Don’t “They” Find Fraud? Limited time Our most precious resource is our attention History Heavy use of sampling - lack of detail Lack of historical fraud detection instruction Lack of fraud symptom expertise Lack of fraud-specific tools Lack of analysis skills Lack of expertise in technology Auditors do find 20-30 percent of fraud ACFE 2004 Report to the Nation
Isn’t there a better way? Reasonable time requirements Within reach of most auditors (highly technical skills not required) Cost effective Integrate easily into different database schemas Integrate AI and auto-detection
Initial Thoughts A small “manual” about frauds Cliff notes about different types of fraud Describes the scheme Describes the indicators of the scheme Worldwide repository wth contributions from many different industries Primary focus was training
Detectlets A detectlet encodes: Background information on a scheme Detail on a specific indicator of the scheme Wizard interface to walk the user through input selection Algorithm coded in standard format “ How to interpret results” follow-up Input is one or more table objects Output is one or more table objects
Detectlet Demonstration Bid rigging where one person prepares all bids
Potential Supporting Platforms MS Access ACL or IDEA Build ground up application Allows total control over platform Stays with open source rather than tying the program to a particular platform For example, consider PowerBuilder Supports Windows, Unix, Linux, Mac Allows embedded use within a greater platform Personal preference was Python
Picalo: The Supporting Platform
Central Detectlet Repository
How Detectlets Address the Problem Limited Time : Detectlets provide a wizard interface for quick execution; they can be chained and automated into a larger system High Cost : Detectlets are based in open source software, putting them within reach of small and large accounting firms; they also create a community environment for fraud detection
How Detectlets Address the Problem Lack of fraud symptom expertise : Detectlets provide a large library of available routines to both train and walk auditors through the detection process Lack of fraud-specific tools : Picalo provides an open solution that we can improve over time; it puts a fraud-specific toolkit in the hands of auditors
How Detectlets Address the Problem Lack of analysis skills : Detectlets encode full algorithms and code, allowing the auditor to stay at the conceptual level rather than the implementation level Lack of expertise in technology : Detectlets provide a wizard-based solution that are easy to use; Picalo provides an Excel-like user interface
Picalo Level 1 API
Data Structures The  Table  object is the basic data structure.  Nearly all routines both input and return tables, allowing them to be chained.  Its methods include sorting, column operations, row operations, import/export from delimited text and Excel formats. Column types include  Boolean, Integer, Floating Point, Date, DateTime, String,  etc.
Simple Module Provides joining, matching, fuzzy matching, and selection. col_join, col_left_join, col_right_join, col_match, col_match_same, col_match_diff, compare_records, custom_match, custom_match_same, custom_match_diff, describe, expression_match, find_duplicates, find_gaps, fuzzysearch, fuzzymatch, fuzzycoljoin, get_unordered, join, left_join, right_join, select, select_by_value, select_outliers, select_outliers_z, select_nonoutliers, select_nonoutliers_z, select_records, soundex, soundexcol , sort, etc.
Benfords Module calc_benford : Calculates probability for a single digit get_expected : Calculates probability for a full number analyze : Analyzes an entire data set and calculates summarized results
Crosstable Module pivot : Similar to Excel’s pivot table function pivot_table : Pivots and keeps detail in each cell pivot_map : Pivots and keeps results in a dictionary rather than a grid pivot_map_detail : Pivots and keeps results in a very detailed fashion using a dictionary
Database Module OdbcConnection : Connects to any ODBC-compliant database PostgreSQLConnection : Connects to PostgreSQL MySQLConnection : Connects to MySQL Also includes various query helper functions, such as query creation, results analysis, etc.
Financial Module Calculates various  financial ratios  to help in financial statement analysis: Current ratio Quick ratio Net working capital Return on assets Return on equity Return on common equity Profit margin Earnings per share Asset turnover Inventory turnover Debt to equity Price earnings
Grouping Module Stratification gives the details behind SQL GROUP BY. It keeps the detail tables rather than summarizing them. stratify : Stratifies a table into N number of tables stratify_by_expression : Stratifies a table using an arbitrary expression stratify_by_value : Stratifies on unique values stratify_by_step : Stratifies based on a set numerical range stratify_by_date : Stratifies based on a date range Summarizing  is similar to SQL GROUP BY, but it allows any type of function to be used for summarization (GROUP BY generally only allows sum, stdev, mean, etc.) This can by done in the same ways as stratification.
Trending Module Various ways of analyzing trends and patterns over time. cusum, highlow_slope, average_slope, regression, handshake_slope
Python Libraries Powerful yet easy  language  with a significant  online community Full  object-oriented  support (classes, inheritance, etc.) Text maniuplation  and  analysis  routines Web site  spidering routines Email  analysis routines Random number  generation Connection to nearly all  databases Web site development  and maintenance Countless  libraries  available online (almost all are open source)
Research Directions
Level 1 Research Foundation routines for fraud detection Development, testing, empirical use, field studies Connections to production software Standard SAP, Oracle, Peoplesoft, JD Edwards, etc. modules Application of CS, statistics, other techniques to fraud detection Time series analysis Pattern recognition for fraud detection
Level 2 Research Studies about detectlet presentation, user interface Creation and testing of detectlets for industries, data schemas, etc. Detectlets for financial statement fraud detection Testing of detectlet vs. traditional ACL-type fraud detection Patterns of detectlet development, best practices
Level 3 Research Automatic mapping of field schemas to a common schema Application of expert system, learning models for automatic detection Decision trees Classification models Meta-detectlets to combine various Level 2 detectlets into higher-level logic
Other Research Group-oriented processes for the central repository Searching, categorization Testing, rating systems Marketplaces for detectlets Development of Picalo itself
My Hope In 5 years we’ll have a large repository of detectlets to: Support both external and internal auditors Teach students in fraud classes Conduct theoretical and empirical research http://www.picalo.org/

Audit,fraud detection Using Picalo

  • 1.
    Detectlets for BetterFraud Detection Conan C. Albrecht, PhD Marriott School of Management Brigham Young University
  • 2.
    Today’s Presentation Givea few fraud stories Outline the Detectlet vision and Picalo Architecture Show example code and working products Describe future research directions and solicit help
  • 3.
    Two Types ofFraud Fraud on behalf of an organization Financial statement manipulation to make the company look better to stockholders Also called management fraud Fraud against an organization Stealing assets, information, etc. Also called employee or consumer fraud
  • 4.
    ACFE Report tothe Nation Occupational Fraud and Abuse 2 1/2 year study of 2608 Frauds totaling $15 million Fraud costs U.S. organizations more than $400 billion annually. Fraud and abuse costs employers an average of $9 a day per employee The average organization loses about 6 percent of its total annual revenue to fraud and abuse admitted to by its own employees
  • 5.
    Ernst & YoungFraud Study 2002 (Europe) One in five workers are aware of fraud in their workplace 80% would be willing to turn in a colleague but only 43% have Employers lost 20 cents on every dollar to workplace fraud Types of fraud Theft of office items—37% Claiming extra hours worked—16% Inflating expenses accounts—7% Taking kickbacks from suppliers—6%
  • 6.
    Cost of FraudFraud Losses Reduce Net Income $ for $ If Profit Margin is 10%, Revenues Must Increase by 10 times Losses to Recover Affect on Net Income Losses……. $1 Million Revenue….$1 Billion Revenues $100 100% Expenses 90 90 % Net Income $ 10 10% Fraud 1 Remaining $ 9 To restore income to $10, need $10 more dollars of revenue to generate $1 more dollar of income.
  • 7.
    Large Bank $100Million Fraud Profit Margin = 10 % $1 Billion in Revenues Needed At $100 per year per Checking Account, 10 Million New Accounts Fraud Cost….Two Examples Automobile Manufacturer $436 Million Fraud Profit Margin = 10% $4.36 Billion in Revenues Needed At $20,000 per Car, 218,000 Cars
  • 8.
    A Recent FraudLarge Fraud of $2.6 Billion over 9 years Year 1 $600K Year 3 $4 million Year 5 $80 million Year 7 $600 million Year 9 $2.6 billion In years 8 and 9, four of the world’s largest banks were involved and lost over $500 million Some of the organizations involved: Merrill Lynch, Chase, J.P. Morgan, Union Bank of Switzerland, Credit Lynnaise, Sumitomo, and others.
  • 9.
    Every Person HasA Price Abraham Lincoln once threw a man out of his office, angrily turning down a substantial bribe. “Every man has his price”, explained Lincoln, “and he was getting close to mine.”
  • 10.
  • 11.
    Superhuman Workers Summedall hours (normal, OT, DT) per two week period, regardless of invoice or timecard) Workers were logging hours on two timecards for simultaneous jobs
  • 12.
    The Family BusinessWork Orders Authorized By Purchaser
  • 13.
    The Family BusinessInvoice Charges Authorized By Purchaser
  • 14.
    The Family BusinessWork Orders Given To Contractor Crew
  • 15.
    The Family BusinessTip stated that kickbacks were occurring with a certain company We researched the company and determined which purchaser authorized the work A contractor crew and company purchaser were family
  • 16.
  • 17.
  • 18.
  • 19.
    Increases In OnlyPart Of A Trend
  • 20.
  • 21.
  • 22.
    Accounting History 1940SEC Statement: “Accountants can be expected to detect gross overstatements of assets and profits whether resulting from collusive fraud or otherwise” (Accounting Series Release 1940) 1961: “If the ten (auditing) standards now accepted were satisfactory for their purpose we would not have the pleas for guidance on the extent of (auditors’) responsibility for the detection of irregularities we now find in our professional literature.” (Mautz & Sharaf 1961) 1997 - SAS 82 2002 - SAS 99 Expectation Gap
  • 23.
    Historical Fraud ResearchExcellent literature review by Nieschwietz, Shultz, & Zimbelman (2000) Who commits fraud Red flags Expectation gap Auditor expectations Game theory between auditors and management Auditor-client relationships Risk assessment, decision aids Management factors affecting fraud
  • 24.
    FS Fraud usingRatio Analysis Hansen, et. al (1996) developed a generalized qualitative-response model from internal sources Green and Choi (1997) used neural networks to classify fraudulent cases Summers and Sweeny (1998) identified FS fraud using external and internal information Benish (1999) developed a probit model using ratios for fraud identification Bell and Carcello (2000) developed a logistic regression model to identify fraud Current work by McKee and by Cecchini and by Albrecht None have found the “silver bullet” in using external information to identify fraud Management (FS) fraud is very difficult to find
  • 25.
    What are theBig 4 Doing? Each firm seems to have different groups working on fraud detection No best practices model has emerged IT auditors perform control testing on company systems, not fraud detection Meeting with Bill Titera of EY
  • 26.
    Why Don’t “They”Find Fraud? Limited time Our most precious resource is our attention History Heavy use of sampling - lack of detail Lack of historical fraud detection instruction Lack of fraud symptom expertise Lack of fraud-specific tools Lack of analysis skills Lack of expertise in technology Auditors do find 20-30 percent of fraud ACFE 2004 Report to the Nation
  • 27.
    Isn’t there abetter way? Reasonable time requirements Within reach of most auditors (highly technical skills not required) Cost effective Integrate easily into different database schemas Integrate AI and auto-detection
  • 28.
    Initial Thoughts Asmall “manual” about frauds Cliff notes about different types of fraud Describes the scheme Describes the indicators of the scheme Worldwide repository wth contributions from many different industries Primary focus was training
  • 29.
    Detectlets A detectletencodes: Background information on a scheme Detail on a specific indicator of the scheme Wizard interface to walk the user through input selection Algorithm coded in standard format “ How to interpret results” follow-up Input is one or more table objects Output is one or more table objects
  • 30.
    Detectlet Demonstration Bidrigging where one person prepares all bids
  • 31.
    Potential Supporting PlatformsMS Access ACL or IDEA Build ground up application Allows total control over platform Stays with open source rather than tying the program to a particular platform For example, consider PowerBuilder Supports Windows, Unix, Linux, Mac Allows embedded use within a greater platform Personal preference was Python
  • 32.
  • 33.
  • 34.
    How Detectlets Addressthe Problem Limited Time : Detectlets provide a wizard interface for quick execution; they can be chained and automated into a larger system High Cost : Detectlets are based in open source software, putting them within reach of small and large accounting firms; they also create a community environment for fraud detection
  • 35.
    How Detectlets Addressthe Problem Lack of fraud symptom expertise : Detectlets provide a large library of available routines to both train and walk auditors through the detection process Lack of fraud-specific tools : Picalo provides an open solution that we can improve over time; it puts a fraud-specific toolkit in the hands of auditors
  • 36.
    How Detectlets Addressthe Problem Lack of analysis skills : Detectlets encode full algorithms and code, allowing the auditor to stay at the conceptual level rather than the implementation level Lack of expertise in technology : Detectlets provide a wizard-based solution that are easy to use; Picalo provides an Excel-like user interface
  • 37.
  • 38.
    Data Structures The Table object is the basic data structure. Nearly all routines both input and return tables, allowing them to be chained. Its methods include sorting, column operations, row operations, import/export from delimited text and Excel formats. Column types include Boolean, Integer, Floating Point, Date, DateTime, String, etc.
  • 39.
    Simple Module Providesjoining, matching, fuzzy matching, and selection. col_join, col_left_join, col_right_join, col_match, col_match_same, col_match_diff, compare_records, custom_match, custom_match_same, custom_match_diff, describe, expression_match, find_duplicates, find_gaps, fuzzysearch, fuzzymatch, fuzzycoljoin, get_unordered, join, left_join, right_join, select, select_by_value, select_outliers, select_outliers_z, select_nonoutliers, select_nonoutliers_z, select_records, soundex, soundexcol , sort, etc.
  • 40.
    Benfords Module calc_benford: Calculates probability for a single digit get_expected : Calculates probability for a full number analyze : Analyzes an entire data set and calculates summarized results
  • 41.
    Crosstable Module pivot: Similar to Excel’s pivot table function pivot_table : Pivots and keeps detail in each cell pivot_map : Pivots and keeps results in a dictionary rather than a grid pivot_map_detail : Pivots and keeps results in a very detailed fashion using a dictionary
  • 42.
    Database Module OdbcConnection: Connects to any ODBC-compliant database PostgreSQLConnection : Connects to PostgreSQL MySQLConnection : Connects to MySQL Also includes various query helper functions, such as query creation, results analysis, etc.
  • 43.
    Financial Module Calculatesvarious financial ratios to help in financial statement analysis: Current ratio Quick ratio Net working capital Return on assets Return on equity Return on common equity Profit margin Earnings per share Asset turnover Inventory turnover Debt to equity Price earnings
  • 44.
    Grouping Module Stratificationgives the details behind SQL GROUP BY. It keeps the detail tables rather than summarizing them. stratify : Stratifies a table into N number of tables stratify_by_expression : Stratifies a table using an arbitrary expression stratify_by_value : Stratifies on unique values stratify_by_step : Stratifies based on a set numerical range stratify_by_date : Stratifies based on a date range Summarizing is similar to SQL GROUP BY, but it allows any type of function to be used for summarization (GROUP BY generally only allows sum, stdev, mean, etc.) This can by done in the same ways as stratification.
  • 45.
    Trending Module Variousways of analyzing trends and patterns over time. cusum, highlow_slope, average_slope, regression, handshake_slope
  • 46.
    Python Libraries Powerfulyet easy language with a significant online community Full object-oriented support (classes, inheritance, etc.) Text maniuplation and analysis routines Web site spidering routines Email analysis routines Random number generation Connection to nearly all databases Web site development and maintenance Countless libraries available online (almost all are open source)
  • 47.
  • 48.
    Level 1 ResearchFoundation routines for fraud detection Development, testing, empirical use, field studies Connections to production software Standard SAP, Oracle, Peoplesoft, JD Edwards, etc. modules Application of CS, statistics, other techniques to fraud detection Time series analysis Pattern recognition for fraud detection
  • 49.
    Level 2 ResearchStudies about detectlet presentation, user interface Creation and testing of detectlets for industries, data schemas, etc. Detectlets for financial statement fraud detection Testing of detectlet vs. traditional ACL-type fraud detection Patterns of detectlet development, best practices
  • 50.
    Level 3 ResearchAutomatic mapping of field schemas to a common schema Application of expert system, learning models for automatic detection Decision trees Classification models Meta-detectlets to combine various Level 2 detectlets into higher-level logic
  • 51.
    Other Research Group-orientedprocesses for the central repository Searching, categorization Testing, rating systems Marketplaces for detectlets Development of Picalo itself
  • 52.
    My Hope In5 years we’ll have a large repository of detectlets to: Support both external and internal auditors Teach students in fraud classes Conduct theoretical and empirical research http://www.picalo.org/

Editor's Notes

  • #12 One search summed all hours worked by employees within two week periods. It ignored which project it was on, which plant it was at, what type of work it was, etc. We found people that were working over 100 hours per week. This could perceivably happen once or twice, but many workers did this consistently, month after month (as seen in the trend above). Investigation into these employees showed that they were clocking in under two time cards at different locations in the plant, effectively doubling their hours each week.
  • #13 The next few slides show the results of a specialized search. We stratefied the data by the amount of work orders that purchasers authorized during each period. As can be seen, purchaser F authorized considerably more work than other purchasers.
  • #14 Purchaser F is again shown in this spreadsheet, which is now stratefied by invoice charges. Again, he is authorizing considerably more charges.
  • #15 The picture became clearer as we stratefied by contractor crew. The company subcontracted with third-party companies for this type of work, and it is obvious which crew is getting the majority of the work. See the totals across the bottom.
  • #16 When we investigated these people on both sides of the transaction, the same last name was found on each side. The individuals came from the same immediate family, and the purchaser was funneling work to his family’s company.
  • #17 These next few slides show some sample data patterns that researchers can look for. They are not all-inclusive, but are just examples of what to look for and one way to visualize it. The above time engine results show employee (with names grayed out) trends in spending. The shown trend is increasing regularly.
  • #18 This slide shows another increase in spending. Note how the time engine flags the suspicious data points in red.
  • #19 This slide shows an unexpected peak in spending. The employee had normal spending until one month where he or she spent significantly more than expected. It is important to understand why this occurred.
  • #20 This data pattern illustrates how subtrends need to be analyzed. A simple average (or regression equation) of this trend would be very normal. However, a problem trend is flagged when only the first five data points are considered. The time engine ran repeated analyses on all parts of a trend.