FQ-haplotyper is an R script that analyzes haplotype data from FlexQTL and assigns haplotype alleles. It considers each haploblock separately in half-sibling families, imputing missing SNP data or removing conflicting data based on Mendelian inheritance. The output includes files for further analysis and visualization of original and imputed haplotype alleles in pedigrees.
This is the webinar presented on the 14th April as part of the Ensembl Online Webinar series. You can view the recorded webinar on the Ensembl Helpdesk youtube channel https://www.youtube.com/watch?v=blbhuqiiDoA
Research report (alternative splicing, protein structure; retinitis pigmentosa)avalgar
This presentation explains the two major scientific projects I have been involved in.
It extends way further than a CV, but shorter than an actual scientific paper.
As increasing numbers of people choose to have their genomes sequenced and made available for research, more genomic data is available for analysis by machine learning approaches. Single Nucleotide Polymorphisms (SNPs) are known to be a major factor influencing many physical traits, diseases and other phenotypes. Using publicly available data and tools we predict phenotype from genotype using SNP data (1 to 2 million SNPs). We utilize data analysis and machine learning approaches only, no domain knowledge, so that our automated approach may be generally used to predict different phenotypes from genotype. In the first application of our method we predicted eye color with 87% accuracy.
2015 TriCon - Clinical Grade Annotations - Public Data Resources for Interpre...Gabe Rudy
The availability and details of using public genomic annotation sources to do clinical grade genomic diagnosis, using the exomes of myself, wife and son as the case study.
Towards Precision Medicine: Tute Genomics, a cloud-based application for anal...Reid Robison
Tute Genomics is cloud-based software that can rapidly analyze entire human genomes. The cost of whole genome sequencing is dropping rapidly and we are in the middle of a genomic revolution. Tute is opening a new door for personalized medicine by helping researchers & healthcare organizations analyze human genomes.
Exploiting technical replicate variance in omics data analysis (RepExplore)Enrico Glaab
High-throughput omics datasets often contain technical replicates included to account for technical sources of noise in the measurement process. Although summarizing these replicate measurements by using robust averages may help to reduce the influence of noise on downstream data analysis, the information on the variance across the replicate measurements is lost in the averaging process and therefore typically disregarded in subsequent statistical analyses.
We introduce RepExplore, a web-service dedicated to exploit the information captured in the technical replicate variance to provide more reliable and informative differential expression and abundance statistics for omics datasets. The software builds on previously published statistical methods, which have been applied successfully to biomedical omics data but are difficult to use without prior experience in programming or scripting. RepExplore facilitates the analysis by providing a fully automated data processing and interactive ranking tables, whisker plot, heat map and principal component analysis visualizations to interpret omics data and derived statistics.
Availability and implementation: Freely available at http://www.repexplore.tk
Journal publication: http://bioinformatics.oxfordjournals.org/content/31/13/2235.long (Glaab, E., & Schneider, R. (2015). RepExplore: Addressing technical replicate variance in proteomics and metabolomics data analysis. Bioinformatics, 31 (13): 2235-2237)
The increasing availability of SNP (single nucleotide polymorphisms) genotype data in livestock is stimulating the development of new data analysis strategies, which can be applied in animal breeding. One possible application is the prediction of carriers of specific haplotypes, especially if they impact animal health. It is therefore convenient to have a practical and easy-to-implement statistical method for the accurate classification of individuals into carriers and non-carriers. In this paper, we present a procedure for the identification of carriers of the haplotype HH1 on BTA5 (Bos Taurus autosome 5), which is known to be associated with reduced cow fertility in Holstein-Friesian cattle. A population of 1104 Holstein bulls genotyped with the 54K SNP-chip was available for the analysis. There were 45 carriers (5.3%) and 1045 non-carriers (94.7%). Two complementary multivariate statistical techniques were used for the identification of haplotype carriers: Backward Stepwise Selection (BSS) to select the SNP that best fit the model, and Linear Discriminant Analysis (LDA) to classify observations, based on the selected SNP, into carriers and non-carriers. In order to explore the minimum-sized set of SNP that correctly identifies haplotype carriers, different proportions of SNP were tested: 2.5; 10; 15; 30; 50 and 100%. For each proportion of SNP, BSS and LDA were applied, and the classification error rate was estimated in a 10-fold cross-validation scheme. Data were split in 10 subsets. The first subset was treated as validation set, while the model was fit on the remaining nine subsets (the training set). The overall error rate for the prediction of haplotype carriers was on average very low (∼1%) both in the training and in the validation datasets. The error rate was found to depend on the number of SNPs in the model and their density around the region of the haplotype on BTA5. The minimum set of SNPs to achieve accurate predictions was 18, with a total test error rate of 1.27. This paper describes a procedure to accurately identify haplotype carriers from SNP genotypes in cattle populations. Very few misclassifications were observed, which indicates that this is a very reliable approach for potential applications in cattle breeding.
Dissecting human brain development at high resolution using RNA-seq lcolladotor
L. Collado-Torres' ENAR 2015 presentation about using `derfinder` to identify differentially expressed regions in the DLPFC across the lifespan of normal individuals. Described in Jaffe et al, Nature Neuroscience, 2014
Rphenoscape: Connecting the semantics of evolutionary morphology to comparat...Hilmar Lapp
Presentation of the software package RPhenoscape for the R platform for statistical computing. The package bridges between the ecosystem of packages for comparative phylogenetics in R and the data content and computational semantics services provided by the API of the Phenoscape Knowledgebase. Presented at the 2016 Evolution Meetings in Austin, TX.
Similar to Fq haplotyper poster-eucarpia-2015-fruit-section_bologna-june_14-18 (20)
Earliest Galaxies in the JADES Origins Field: Luminosity Function and Cosmic ...Sérgio Sacani
We characterize the earliest galaxy population in the JADES Origins Field (JOF), the deepest
imaging field observed with JWST. We make use of the ancillary Hubble optical images (5 filters
spanning 0.4−0.9µm) and novel JWST images with 14 filters spanning 0.8−5µm, including 7 mediumband filters, and reaching total exposure times of up to 46 hours per filter. We combine all our data
at > 2.3µm to construct an ultradeep image, reaching as deep as ≈ 31.4 AB mag in the stack and
30.3-31.0 AB mag (5σ, r = 0.1” circular aperture) in individual filters. We measure photometric
redshifts and use robust selection criteria to identify a sample of eight galaxy candidates at redshifts
z = 11.5 − 15. These objects show compact half-light radii of R1/2 ∼ 50 − 200pc, stellar masses of
M⋆ ∼ 107−108M⊙, and star-formation rates of SFR ∼ 0.1−1 M⊙ yr−1
. Our search finds no candidates
at 15 < z < 20, placing upper limits at these redshifts. We develop a forward modeling approach to
infer the properties of the evolving luminosity function without binning in redshift or luminosity that
marginalizes over the photometric redshift uncertainty of our candidate galaxies and incorporates the
impact of non-detections. We find a z = 12 luminosity function in good agreement with prior results,
and that the luminosity function normalization and UV luminosity density decline by a factor of ∼ 2.5
from z = 12 to z = 14. We discuss the possible implications of our results in the context of theoretical
models for evolution of the dark matter halo mass function.
Nutraceutical market, scope and growth: Herbal drug technologyLokesh Patil
As consumer awareness of health and wellness rises, the nutraceutical market—which includes goods like functional meals, drinks, and dietary supplements that provide health advantages beyond basic nutrition—is growing significantly. As healthcare expenses rise, the population ages, and people want natural and preventative health solutions more and more, this industry is increasing quickly. Further driving market expansion are product formulation innovations and the use of cutting-edge technology for customized nutrition. With its worldwide reach, the nutraceutical industry is expected to keep growing and provide significant chances for research and investment in a number of categories, including vitamins, minerals, probiotics, and herbal supplements.
Slide 1: Title Slide
Extrachromosomal Inheritance
Slide 2: Introduction to Extrachromosomal Inheritance
Definition: Extrachromosomal inheritance refers to the transmission of genetic material that is not found within the nucleus.
Key Components: Involves genes located in mitochondria, chloroplasts, and plasmids.
Slide 3: Mitochondrial Inheritance
Mitochondria: Organelles responsible for energy production.
Mitochondrial DNA (mtDNA): Circular DNA molecule found in mitochondria.
Inheritance Pattern: Maternally inherited, meaning it is passed from mothers to all their offspring.
Diseases: Examples include Leber’s hereditary optic neuropathy (LHON) and mitochondrial myopathy.
Slide 4: Chloroplast Inheritance
Chloroplasts: Organelles responsible for photosynthesis in plants.
Chloroplast DNA (cpDNA): Circular DNA molecule found in chloroplasts.
Inheritance Pattern: Often maternally inherited in most plants, but can vary in some species.
Examples: Variegation in plants, where leaf color patterns are determined by chloroplast DNA.
Slide 5: Plasmid Inheritance
Plasmids: Small, circular DNA molecules found in bacteria and some eukaryotes.
Features: Can carry antibiotic resistance genes and can be transferred between cells through processes like conjugation.
Significance: Important in biotechnology for gene cloning and genetic engineering.
Slide 6: Mechanisms of Extrachromosomal Inheritance
Non-Mendelian Patterns: Do not follow Mendel’s laws of inheritance.
Cytoplasmic Segregation: During cell division, organelles like mitochondria and chloroplasts are randomly distributed to daughter cells.
Heteroplasmy: Presence of more than one type of organellar genome within a cell, leading to variation in expression.
Slide 7: Examples of Extrachromosomal Inheritance
Four O’clock Plant (Mirabilis jalapa): Shows variegated leaves due to different cpDNA in leaf cells.
Petite Mutants in Yeast: Result from mutations in mitochondrial DNA affecting respiration.
Slide 8: Importance of Extrachromosomal Inheritance
Evolution: Provides insight into the evolution of eukaryotic cells.
Medicine: Understanding mitochondrial inheritance helps in diagnosing and treating mitochondrial diseases.
Agriculture: Chloroplast inheritance can be used in plant breeding and genetic modification.
Slide 9: Recent Research and Advances
Gene Editing: Techniques like CRISPR-Cas9 are being used to edit mitochondrial and chloroplast DNA.
Therapies: Development of mitochondrial replacement therapy (MRT) for preventing mitochondrial diseases.
Slide 10: Conclusion
Summary: Extrachromosomal inheritance involves the transmission of genetic material outside the nucleus and plays a crucial role in genetics, medicine, and biotechnology.
Future Directions: Continued research and technological advancements hold promise for new treatments and applications.
Slide 11: Questions and Discussion
Invite Audience: Open the floor for any questions or further discussion on the topic.
(May 29th, 2024) Advancements in Intravital Microscopy- Insights for Preclini...Scintica Instrumentation
Intravital microscopy (IVM) is a powerful tool utilized to study cellular behavior over time and space in vivo. Much of our understanding of cell biology has been accomplished using various in vitro and ex vivo methods; however, these studies do not necessarily reflect the natural dynamics of biological processes. Unlike traditional cell culture or fixed tissue imaging, IVM allows for the ultra-fast high-resolution imaging of cellular processes over time and space and were studied in its natural environment. Real-time visualization of biological processes in the context of an intact organism helps maintain physiological relevance and provide insights into the progression of disease, response to treatments or developmental processes.
In this webinar we give an overview of advanced applications of the IVM system in preclinical research. IVIM technology is a provider of all-in-one intravital microscopy systems and solutions optimized for in vivo imaging of live animal models at sub-micron resolution. The system’s unique features and user-friendly software enables researchers to probe fast dynamic biological processes such as immune cell tracking, cell-cell interaction as well as vascularization and tumor metastasis with exceptional detail. This webinar will also give an overview of IVM being utilized in drug development, offering a view into the intricate interaction between drugs/nanoparticles and tissues in vivo and allows for the evaluation of therapeutic intervention in a variety of tissues and organs. This interdisciplinary collaboration continues to drive the advancements of novel therapeutic strategies.
1. FQ-haplotyper is implemented as an R script. One function call is
sufficient to perform the total analysis. Almost all parameters have
default values, including the names of the input files that are
generated by FlexQTL.
The output consists of a number of data files, including a.o.
• Files in FlexQTL format (dat, map, par) ready to go for QTL
mapping, IBD analyses or further data curation
• Files in Pedimap (Voorrips et al 2012) format, for visualizing the
original and/or resulting SNP and haploblock alleles in parts of the
pedigree (see illustration on the right)
• Information and statistics on imputed SNP and haploblock alleles
Haplotype allele assignment and imputation
in pedigrees
Roeland E. Voorrips, Marco C.A.M. Bink, Johannes W. Kruisselbrink, Herma J.J. Koehorst - van Putten, W. Eric Van de Weg
• High-density SNP data are available for a 2000+ individuals apple
pedigree
• Individual SNPs are bi-allelic and carry little information
• Tightly linked sets of SNPs (“haploblocks”) may serve as multi-allelic
markers, provided that the haplotypes can be assigned correctly
• These multi-allelic haploblocks are much more informative than
single SNPs for QTL analysis and LD mapping, and their
compactness reduces required memory and computation time
Objective
Conclusions
Approach
This work has been co-funded by the EU seventh Framework Programme by the FruitBreedomics
project N°. 265582: Integrated Approach for increasing breeding efficiency in fruit tree crops
(http://fruitbreedomics.com) and by the USDA-NIFA-SCRI project RosBREED: Enabling marker-
assisted breeding in Rosaceae (2009-51181-05808; http://www.rosbreed.org).
Acknowledgements
We developed a three-step process to identify haploblocks and assign
haplotype alleles:
• The FlexQTLTM program (Bink et al 2014) performs SNP phasing
• Its interface VisualFlexQTL defines haploblocks automatically such
that recombinations occur between haploblocks and not within
• A new R-script “FQ-haplotyper” assigns haplotypes, performing
imputation and error correction based on Mendelian inheritance
rules
Here we present the approach of FQ-haplotyper and its application in
an apple pedigree.
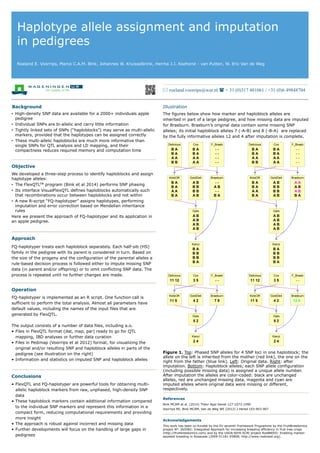
Illustration
The figures below show how marker and haploblock alleles are
inherited in part of a large pedigree, and how missing data are imputed
for Braeburn. Braeburn’s original data contain some missing SNP
alleles; its initial haploblock alleles 7 (-A-B) and 8 (-B-A) are replaced
by the fully informative alleles 12 and 4 after imputation is complete.
• FlexQTL and FQ-haplotyper are powerful tools for obtaining multi-
allelic haploblock markers from raw, unphased, high-density SNP
data
• These haploblock markers contain additional information compared
to the individual SNP markers and represent this information in a
compact form, reducing computational requirements and providing
more insight
• The approach is robust against incorrect and missing data
• Further developments will focus on the handling of large gaps in
pedigrees
* roeland.voorrips@wur.nl ( + 31 (0)317 481061 / +31 (0)6 49848704
FQ-haplotyper treats each haploblock separately. Each half-sib (HS)
family in the pedigree with its parent is considered in turn. Based on
the size of the progeny and the configuration of the parental alleles a
rule-based decision process is followed either to impute missing SNP
data (in parent and/or offspring) or to omit conflicting SNP data. The
process is repeated until no further changes are made.
Figure 1. Top: Phased SNP alleles for 4 SNP loci in one haploblock; the
allele on the left is inherited from the mother (red link), the one on the
right from the father (blue link). Left: Original data. Right: after
imputation. Bottom: Haploblock alleles; each SNP allele configuration
(including possible missing data) is assigned a unique allele number.
After imputation the alleles are color-coded: black are unchanged
alleles, red are unchanged missing data, magenta and cyan are
imputed alleles where original data were missing or different,
respectively.
Operation
References
Bink MCAM et al. (2014) Theor Appl Genet 127:1073-1090
Voorrips RE, Bink MCAM, Van de Weg WE (2012) J Hered 103:903-907
Background
Delicious
B A
B A
A A
B B
Cox
B A
B A
A A
A A
F_Braeb
- -
- -
- -
- -
KidsOR
B A
B A
A A
B A
GoldDeli
A B
B B
B B
A B
Braeburn
- -
A B
- -
B A
Gala
A B
A B
A B
A B
Kanzi
B A
B B
B B
B A
Delicious
B A
B A
A A
B B
Cox
B A
B A
A A
A A
F_Braeb
- -
- -
- -
- -
KidsOR
B A
B A
A A
B A
GoldDeli
A B
B B
B B
A B
Braeburn
A A
A B
A B
B A
Gala
A B
A B
A B
A B
Kanzi
B A
B B
B B
B A
Delicious
11 12
Cox
3 5
F_Braeb
- -
KidsOR
11 5
GoldDeli
4 2
Braeburn
7 8
Gala
5 2
Kanzi
2 4
Delicious
11 12
Cox
3 5
F_Braeb
- -
KidsOR
11 5
GoldDeli
4 2
Braeburn
12 4
Gala
5 2
Kanzi
2 4