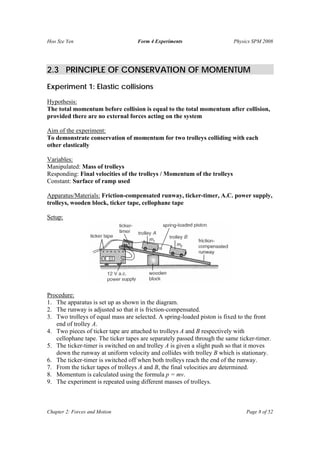
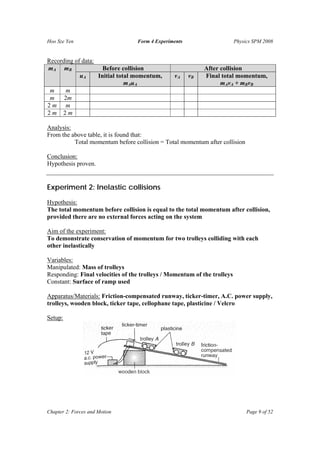
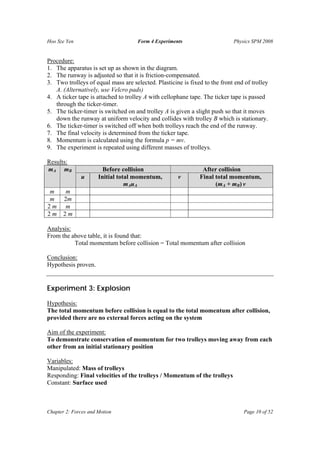
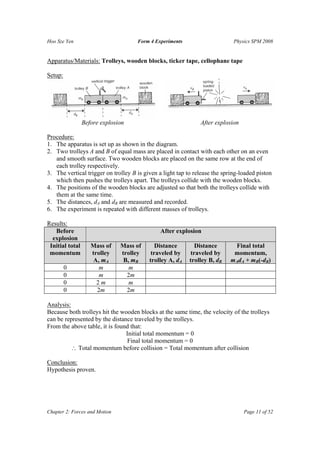
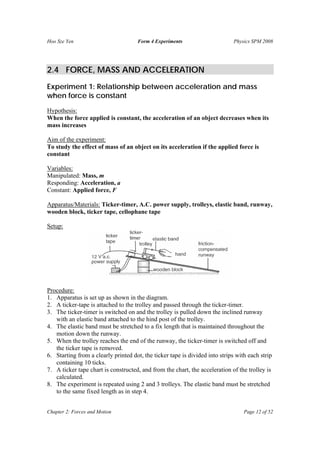
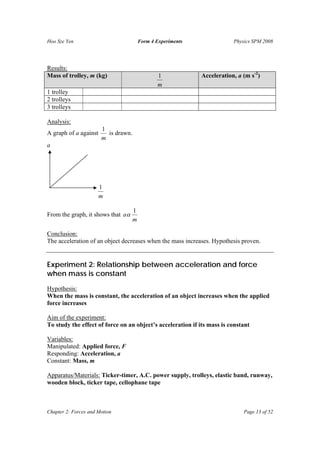
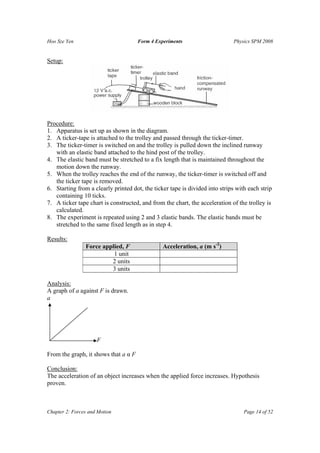
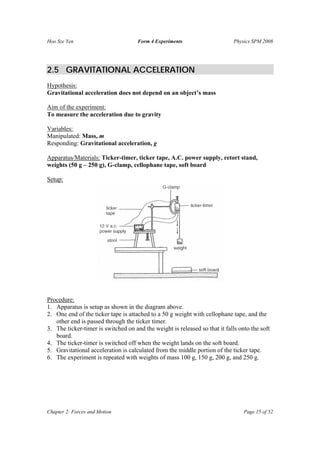
Hoo Sze Yen Form 4 Experiments Physics SPM 2008
Chapter 1: Introduction to Physics Page 1 of 52
CHAPTER 1:
INTRODUCTION TO PHYSICS
1.1 PENDULUM
Hypothesis:
The longer the length of a simple pendulum, the longer the period of oscillation.
Aim of the experiment:
To investigate how the period of a simple pendulum varies with its length.
Variables:
Manipulated: The length of the pendulum, l
Responding: The period of the pendulum, T
Constant: The mass of the pendulum bob, gravitational acceleration
Apparatus/Materials:
Pendulum bob, length of thread about 100 cm long, retort stand, stopwatch
Setup:
Procedure:
1. The thread is tied to the pendulum bob. The other end of the thread is tied around the
arm of the retort stand so that it can swing freely. The length of the pendulum, l is
measured to 80 cm as per the diagram.
Retort stand
Pendulum
Length, l
Thread
Hoo Sze Yen Form 4 Experiments Physics SPM 2008
Chapter 1: Introduction to Physics Page 2 of 52
2. With the thread taut and the bob at rest, the bob is lifted at a small amplitude (of not
more than 10°). Ensure that the pendulum swings in a single plane.
3. The time for ten complete oscillations of the pendulum is measured using the
stopwatch.
4. Step 3 is repeated, and the average of both readings are calculated.
5. The period of oscillation, T is calculated using the average reading divided by the
number of oscillations, i.e. 10.
6. T2
is calculated by squaring the value of T.
7. Steps 1 to 6 are repeated using l = 70 cm, 60 cm, 50 cm, and 40 cm.
8. A graph T2
versus l is plotted.
Recording of data:
Time of oscillations, t (s) Period of oscillation, TLength of
pendulum, l
(cm)
t1 t2 Average T = t/10 (s) T2
(s2
)
80
70
60
50
40
Graph of T2
vs l
Discussion:
The graph of T2
versus l shows a straight line passing through the origin. This means that
the period of oscillation increases with the length of the pendulum, with T2
directly
proportional to l.
Conclusion:
The longer the length of the pendulum, the longer the period of oscillation. The
hypothesis is proven valid.
Length of pendulum, l
T2
Hoo Sze Yen Form 4 Experiments Physics SPM 2008
Chapter 2: Forces and Motion Page 3 of 52
CHAPTER 2:
FORCES AND MOTION
2.1 INCLINED PLANES
Hypothesis:
The larger the angle of incline, the higher the velocity just before reaching the end
of the runway
Aim of the experiment:
To study the relationship between the velocity of motion and the angle of inclination
Variables:
Manipulated: Angle of incline
Responding: Velocity just before reaching the end of the runway
Constant: Length of runway
Apparatus/Materials: Trolley, protractor, wooden blocks, cellophane tape, ticker-
timer, ticker tape, power supply, friction-compensated runway
Setup:
Procedure:
1. The apparatus is set up as per the diagram, and the inclined angle of the plane is
measured using a protractor. An initial angle of 5° is used.
2. The ticker-timer is started up and at the same time the trolley is released to slide down
the plane.
3. The final velocity when the trolley reaches the end of the plane is calculated using the
distance of 10 ticks on the ticker tape.
4. The procedure is repeated by changing the angle of incline to 10°, 15°, 20° and 25°.
Hoo Sze Yen Form 4 Experiments Physics SPM 2008
Chapter 2: Forces and Motion Page 4 of 52
Results:
Angle of incline (˚) Final velocity (m s-1
)
5
10
15
20
25
Analysis:
A graph of the velocity of the trolley against the angle of incline is plotted as follows:
Conclusion:
A higher angle of incline will have a higher velocity at the end of the runway.
Hypothesis accepted.
Note: The experiment can be modified by making the angle constant and varying the
height and length of the runway. Changes must be made accordingly: hypothesis,
variable list, procedure, table, analysis, conclusion.
Angle of incline (°)
Velocity (m s-1
)
Hoo Sze Yen Form 4 Experiments Physics SPM 2008
Chapter 2: Forces and Motion Page 5 of 52
2.2 INERTIA
Option 1: Using a saw blade
Hypothesis:
The larger the mass, the larger the inertia
Aim of the experiment:
To study the effect of mass on the inertia of an object
Variables:
Manipulated: Mass, m
Responding: Period of oscillation, T
Constant: Stiffness of blade, distance of the centre of the plasticine from the clamp
Apparatus/Materials: Jigsaw blade, G-clamp, stopwatch, and plasticine spheres of
mass 20 g, 40 g, 60 g, 80 g, and 100 g
Setup:
Procedure:
1. One end of the jigsaw blade is clamped to the leg of a table with a G-clamp as per the
diagram drawn.
2. A 20 g plasticine ball is fixed at the free end of the blade.
3. The free end of the blade is displaced horizontally and released so that it oscillates.
The time for 10 complete oscillations is measured using a stopwatch. This step is
repeated. The average of 10 oscillations is calculated. Then, the period of oscillation
is determined.
4. Steps 2 and 3 are repeated using plasticine balls with masses 40 g, 60 g, 80 g, and 100
g.
5. A graph of T2
versus mass of load, m is drawn.
Hoo Sze Yen Form 4 Experiments Physics SPM 2008
Chapter 2: Forces and Motion Page 6 of 52
Results:
Time of oscillations, t (s) Period of oscillation, TMass of
load, m (g) t1 t2 Average T = t/10 (s) T2
(s2
)
20
40
60
80
100
Graph of T2
versus m:
Discussion:
The graph of T2
versus m shows a straight line passing through the origin. This means
that the period of oscillation increases with the mass of the load; that is, an object with a
large mass has a large inertia.
Conclusion:
Objects with a large mass have a large inertia. This is the reason why it is difficult to set
an object of large mass in motion or to stop it. The hypothesis is valid.
Option 2: Using an inertia balance
Hypothesis:
The larger the mass, the bigger the inertia
Aim of the experiment:
To study the effect of mass on the inertia of an object
Variables:
Manipulated: Mass, m
Responding: Period of oscillation, T
Constant: Stiffness of the inertia balance
Apparatus/Materials: Inertia balance, masses for the inertia balance, G-clamp,
stopwatch
Hoo Sze Yen Form 4 Experiments Physics SPM 2008
Chapter 2: Forces and Motion Page 7 of 52
Setup:
Procedure:
1. The inertia balance is set up by clamping it onto one end of the table as shown in the
figure above.
2. One mass is placed into the inertia balance. The inertia balance is displaced to one
side so that it oscillates in a horizontal plane.
3. The time for 10 complete oscillations is measured using a stopwatch. This step is
repeated. The average of 10 oscillations is calculated. Then, the period of oscillation
is determined.
4. Steps 2 and 3 are repeated using two and three masses on the inertia balance.
5. A graph of T2
versus number of masses, n is drawn.
Results:
Time of oscillations, t (s) Period of oscillation, TNumber of
masses, n t1 t2 Average T = t/10 (s) T2
(s2
)
1
2
3
Graph of T2
versus m:
Discussion:
The graph of T2
versus m shows a straight line passing through the origin. This means
that the period of oscillation increases with the mass of the load; that is, an object with a
large mass has a large inertia.
Conclusion:
Objects with a large mass have a large inertia. This is the reason why it is difficult to set
an object of large mass in motion or to stop it. The hypothesis is valid.
Hoo Sze Yen Form 4 Experiments Physics SPM 2008
Chapter 2: Forces and Motion Page 8 of 52
2.3 PRINCIPLE OF CONSERVATION OF MOMENTUM
Experiment 1: Elastic collisions
Hypothesis:
The total momentum before collision is equal to the total momentum after collision,
provided there are no external forces acting on the system
Aim of the experiment:
To demonstrate conservation of momentum for two trolleys colliding with each
other elastically
Variables:
Manipulated: Mass of trolleys
Responding: Final velocities of the trolleys / Momentum of the trolleys
Constant: Surface of ramp used
Apparatus/Materials: Friction-compensated runway, ticker-timer, A.C. power supply,
trolleys, wooden block, ticker tape, cellophane tape
Setup:
Procedure:
1. The apparatus is set up as shown in the diagram.
2. The runway is adjusted so that it is friction-compensated.
3. Two trolleys of equal mass are selected. A spring-loaded piston is fixed to the front
end of trolley A.
4. Two pieces of ticker tape are attached to trolleys A and B respectively with
cellophane tape. The ticker tapes are separately passed through the same ticker-timer.
5. The ticker-timer is switched on and trolley A is given a slight push so that it moves
down the runway at uniform velocity and collides with trolley B which is stationary.
6. The ticker-timer is switched off when both trolleys reach the end of the runway.
7. From the ticker tapes of trolleys A and B, the final velocities are determined.
8. Momentum is calculated using the formula p = mv.
9. The experiment is repeated using different masses of trolleys.
Hoo Sze Yen Form 4 Experiments Physics SPM 2008
Chapter 2: Forces and Motion Page 9 of 52
Recording of data:
Before collision After collisionmA mB
uA Initial total momentum,
mAuA
vA vB Final total momentum,
mAvA + mBvB
m m
m 2m
2 m m
2 m 2 m
Analysis:
From the above table, it is found that:
Total momentum before collision = Total momentum after collision
Conclusion:
Hypothesis proven.
Experiment 2: Inelastic collisions
Hypothesis:
The total momentum before collision is equal to the total momentum after collision,
provided there are no external forces acting on the system
Aim of the experiment:
To demonstrate conservation of momentum for two trolleys colliding with each
other inelastically
Variables:
Manipulated: Mass of trolleys
Responding: Final velocities of the trolleys / Momentum of the trolleys
Constant: Surface of ramp used
Apparatus/Materials: Friction-compensated runway, ticker-timer, A.C. power supply,
trolleys, wooden block, ticker tape, cellophane tape, plasticine / Velcro
Setup:
Hoo Sze Yen Form 4 Experiments Physics SPM 2008
Chapter 2: Forces and Motion Page 10 of 52
Procedure:
1. The apparatus is set up as shown in the diagram.
2. The runway is adjusted so that it is friction-compensated.
3. Two trolleys of equal mass are selected. Plasticine is fixed to the front end of trolley
A. (Alternatively, use Velcro pads)
4. A ticker tape is attached to trolley A with cellophane tape. The ticker tape is passed
through the ticker-timer.
5. The ticker-timer is switched on and trolley A is given a slight push so that it moves
down the runway at uniform velocity and collides with trolley B which is stationary.
6. The ticker-timer is switched off when both trolleys reach the end of the runway.
7. The final velocity is determined from the ticker tape.
8. Momentum is calculated using the formula p = mv.
9. The experiment is repeated using different masses of trolleys.
Results:
Before collision After collisionmA mB
u Initial total momentum,
mAuA
v Final total momentum,
(mA + mB) v
m m
m 2m
2 m m
2 m 2 m
Analysis:
From the above table, it is found that:
Total momentum before collision = Total momentum after collision
Conclusion:
Hypothesis proven.
Experiment 3: Explosion
Hypothesis:
The total momentum before collision is equal to the total momentum after collision,
provided there are no external forces acting on the system
Aim of the experiment:
To demonstrate conservation of momentum for two trolleys moving away from each
other from an initial stationary position
Variables:
Manipulated: Mass of trolleys
Responding: Final velocities of the trolleys / Momentum of the trolleys
Constant: Surface used
Hoo Sze Yen Form 4 Experiments Physics SPM 2008
Chapter 2: Forces and Motion Page 11 of 52
Apparatus/Materials: Trolleys, wooden blocks, ticker tape, cellophane tape
Setup:
Before explosion After explosion
Procedure:
1. The apparatus is set up as shown in the diagram.
2. Two trolleys A and B of equal mass are placed in contact with each other on an even
and smooth surface. Two wooden blocks are placed on the same row at the end of
each trolley respectively.
3. The vertical trigger on trolley B is given a light tap to release the spring-loaded piston
which then pushes the trolleys apart. The trolleys collide with the wooden blocks.
4. The positions of the wooden blocks are adjusted so that both the trolleys collide with
them at the same time.
5. The distances, dA and dB are measured and recorded.
6. The experiment is repeated with different masses of trolleys.
Results:
Before
explosion
After explosion
Initial total
momentum
Mass of
trolley
A, mA
Mass of
trolley
B, mB
Distance
traveled by
trolley A, dA
Distance
traveled by
trolley B, dB
Final total
momentum,
mAdA + mB(-dB)
0 m m
0 m 2m
0 2 m m
0 2m 2m
Analysis:
Because both trolleys hit the wooden blocks at the same time, the velocity of the trolleys
can be represented by the distance traveled by the trolleys.
From the above table, it is found that:
Initial total momentum = 0
Final total momentum = 0
∴ Total momentum before collision = Total momentum after collision
Conclusion:
Hypothesis proven.
Hoo Sze Yen Form 4 Experiments Physics SPM 2008
Chapter 2: Forces and Motion Page 12 of 52
2.4 FORCE, MASS AND ACCELERATION
Experiment 1: Relationship between acceleration and mass
when force is constant
Hypothesis:
When the force applied is constant, the acceleration of an object decreases when its
mass increases
Aim of the experiment:
To study the effect of mass of an object on its acceleration if the applied force is
constant
Variables:
Manipulated: Mass, m
Responding: Acceleration, a
Constant: Applied force, F
Apparatus/Materials: Ticker-timer, A.C. power supply, trolleys, elastic band, runway,
wooden block, ticker tape, cellophane tape
Setup:
Procedure:
1. Apparatus is set up as shown in the diagram.
2. A ticker-tape is attached to the trolley and passed through the ticker-timer.
3. The ticker-timer is switched on and the trolley is pulled down the inclined runway
with an elastic band attached to the hind post of the trolley.
4. The elastic band must be stretched to a fix length that is maintained throughout the
motion down the runway.
5. When the trolley reaches the end of the runway, the ticker-timer is switched off and
the ticker tape is removed.
6. Starting from a clearly printed dot, the ticker tape is divided into strips with each strip
containing 10 ticks.
7. A ticker tape chart is constructed, and from the chart, the acceleration of the trolley is
calculated.
8. The experiment is repeated using 2 and 3 trolleys. The elastic band must be stretched
to the same fixed length as in step 4.
Hoo Sze Yen Form 4 Experiments Physics SPM 2008
Chapter 2: Forces and Motion Page 13 of 52
Results:
Mass of trolley, m (kg)
m
1 Acceleration, a (m s-2
)
1 trolley
2 trolleys
3 trolleys
Analysis:
A graph of a against
m
1
is drawn.
From the graph, it shows that
m
a
1
α
Conclusion:
The acceleration of an object decreases when the mass increases. Hypothesis proven.
Experiment 2: Relationship between acceleration and force
when mass is constant
Hypothesis:
When the mass is constant, the acceleration of an object increases when the applied
force increases
Aim of the experiment:
To study the effect of force on an object’s acceleration if its mass is constant
Variables:
Manipulated: Applied force, F
Responding: Acceleration, a
Constant: Mass, m
Apparatus/Materials: Ticker-timer, A.C. power supply, trolleys, elastic band, runway,
wooden block, ticker tape, cellophane tape
m
1
a
Hoo Sze Yen Form 4 Experiments Physics SPM 2008
Chapter 2: Forces and Motion Page 14 of 52
Setup:
Procedure:
1. Apparatus is set up as shown in the diagram.
2. A ticker-tape is attached to the trolley and passed through the ticker-timer.
3. The ticker-timer is switched on and the trolley is pulled down the inclined runway
with an elastic band attached to the hind post of the trolley.
4. The elastic band must be stretched to a fix length that is maintained throughout the
motion down the runway.
5. When the trolley reaches the end of the runway, the ticker-timer is switched off and
the ticker tape is removed.
6. Starting from a clearly printed dot, the ticker tape is divided into strips with each strip
containing 10 ticks.
7. A ticker tape chart is constructed, and from the chart, the acceleration of the trolley is
calculated.
8. The experiment is repeated using 2 and 3 elastic bands. The elastic bands must be
stretched to the same fixed length as in step 4.
Results:
Force applied, F Acceleration, a (m s-2
)
1 unit
2 units
3 units
Analysis:
A graph of a against F is drawn.
From the graph, it shows that a α F
Conclusion:
The acceleration of an object increases when the applied force increases. Hypothesis
proven.
F
a
Hoo Sze Yen Form 4 Experiments Physics SPM 2008
Chapter 2: Forces and Motion Page 15 of 52
2.5 GRAVITATIONAL ACCELERATION
Hypothesis:
Gravitational acceleration does not depend on an object’s mass
Aim of the experiment:
To measure the acceleration due to gravity
Variables:
Manipulated: Mass, m
Responding: Gravitational acceleration, g
Apparatus/Materials: Ticker-timer, ticker tape, A.C. power supply, retort stand,
weights (50 g – 250 g), G-clamp, cellophane tape, soft board
Setup:
Procedure:
1. Apparatus is setup as shown in the diagram above.
2. One end of the ticker tape is attached to a 50 g weight with cellophane tape, and the
other end is passed through the ticker timer.
3. The ticker-timer is switched on and the weight is released so that it falls onto the soft
board.
4. The ticker-timer is switched off when the weight lands on the soft board.
5. Gravitational acceleration is calculated from the middle portion of the ticker tape.
6. The experiment is repeated with weights of mass 100 g, 150 g, 200 g, and 250 g.
Hoo Sze Yen Form 4 Experiments Physics SPM 2008
Chapter 2: Forces and Motion Page 16 of 52
Results:
Mass of weights (g) Free fall acceleration (m s-2
)
50
100
150
200
250
Analysis:
From the table above, it is found that the gravitational acceleration for all the weights of
different masses are the same.
Discussion:
• The value of the gravitational acceleration, g obtained is less than the standard value
of 9.81 m s-2
• This is because the weight is not falling freely. It is affected by:
o Air resistance
o Friction between ticker tape and ticker-timer
Conclusion
Gravitational acceleration is not dependent on the mass of the object. Hypothesis proven.
2.6 PRINCIPLE OF CONSERVATION OF ENERGY
Hypothesis:
Energy cannot be created or destroyed, it can only change form.
Aim of the experiment:
To investigate the conversion of gravitational potential energy to kinetic energy.
Variables:
Manipulated: Mass, m
Responding: Final velocity, v
Constant: Height, h
Apparatus/Materials: Ticker-timer, ticker tape, A.C. power supply, trolley, thread,
weights, smooth pulley, friction-compensated runway, soft board, cellophane tape
Hoo Sze Yen Form 4 Experiments Physics SPM 2008
Chapter 2: Forces and Motion Page 17 of 52
Setup:
Procedure:
1. Apparatus is setup as shown in the diagram above.
2. One end of the ticker tape is attached to the back of the trolley with cellophane tape
and the other end is passed through the ticker-timer.
3. The ticker-timer is switched on, and the trolley is released.
4. The final velocity of the trolley and the weight is determined from the ticker tape
obtained.
5. The experiment is repeated with different masses of trolleys and weights.
Results:
Mass of trolley = M kg
Mass of weight = m kg
Height of weight before release = h m
Final velocity of trolley and weight = v m s-1
Loss of potential energy of the weight = mgh
Final kinetic energy of the trolley and the weight = ½ (M + m) v2
It is found that ½ (M + m) v2
= mgh
Conclusion
The loss of potential energy is converted to kinetic energy. Hypothesis proven.
Note: The experiment can be modified by making the mass constant and changing the
height of the weight’s release. Changes must be made to the variables list and to the
last step of the procedure.
Hoo Sze Yen Form 4 Experiments Physics SPM 2008
Chapter 2: Forces and Motion Page 18 of 52
2.7 HOOKE’S LAW
Hypothesis:
The bigger the weight, the longer the spring extension
Aim of the experiment:
To determine the relationship between the weight and the spring extension
Variables:
Manipulated: Weight of the load
Responding: Spring extension
Constant: Spring constant
Apparatus and Materials: Spring, pin, weights, plasticine, retort stand, metre rule
Setup:
Procedure:
1. The apparatus is setup as shown in the diagram.
2. The length of the spring without any weights, l0 is measured using the metre rule with
the pin as reference.
3. A 50 g weight is hung from the bottom of the spring. The new length of the spring, l
is measured. The spring extension is l – l0.
4. Step 4 is repeated with weights 100 g, 150 g, 200 g, and 250 g.
Hoo Sze Yen Form 4 Experiments Physics SPM 2008
Chapter 2: Forces and Motion Page 19 of 52
Results:
Original length of spring = l0 = __________ cm
Load mass
(g)
Load weight
(N)
Spring length, l
(cm)
Spring extension, x = l – l0
(cm)
50 g 0.5 N
100 g 1.0 N
150 g 1.5 N
200 g 2.0 N
250 g 2.5 N
Analysis:
A graph of spring extension, x against weight, F is plotted.
The x-F graph is a linear graph which passes through the origin. This shows that the
extension of the spring is directly proportional to the stretching force.
Conclusion:
Hypothesis proven.
F
x
Hoo Sze Yen Form 4 Experiments Physics SPM 2008
Chapter 3: Forces and Pressure Page 20 of 52
CHAPTER 3:
FORCES AND PRESSURE
3.1 PRESSURE IN LIQUIDS
Experiment 1: Water pressure and depth
Hypothesis:
Water pressure increases with depth
Aim of the experiment:
To find the relationship between the pressure in a liquid according to its depth
Variables:
Manipulated: Depth of liquid
Responding: Pressure in liquid
Constant: Density of liquid
Apparatus and Materials: Measuring cylinder, thistle funnel, rubber tube,
manometer, metre rule
Setup:
Procedure:
1. Apparatus is set up as shown in the diagram.
2. The measuring cylinder is completely filled with water.
3. The thistle funnel is lowered into the water to a depth of 10.0 cm. The manometer
reading is measured. The difference in the liquid heights in the manometer represent
the pressure reading.
4. Step 3 is repeated with values of depth 20.0 cm, 30.0 cm, 40.0 cm and 50.0 cm.
Hoo Sze Yen Form 4 Experiments Physics SPM 2008
Chapter 3: Forces and Pressure Page 21 of 52
Results:
Depth (cm) Manometer reading (cm)
10.0
20.0
30.0
40.0
50.0
Analysis:
A graph of pressure against depth is drawn.
Conclusion:
It is observed that the manometer reading increases as the depth of the thistle funnel
increases. This shows that the pressure increases with the depth of the liquid.
Hypothesis proven.
Experiment 2: Water pressure and density
Hypothesis:
Pressure in liquid increases with its density
Aim of the experiment:
To find the relationship between the pressure in a liquid and its density
Variables:
Manipulated: Density of liquid
Responding: Pressure in liquid
Constant: Depth of liquid
Apparatus and Materials: Measuring cylinder, thistle funnel, rubber tube,
manometer, metre rule, water, glycerin, alcohol
Depth
Pressure
Hoo Sze Yen Form 4 Experiments Physics SPM 2008
Chapter 3: Forces and Pressure Page 22 of 52
Setup:
Procedure:
1. Apparatus is set up as shown in the diagram.
2. The measuring cylinder is completely filled with water.
3. The thistle funnel is lowered into the water to a depth of 50.0 cm. The manometer
reading is measured. The difference in the liquid heights in the manometer represent
the pressure reading.
4. The experiment is repeated by replacing the water with glycerin (density = 1300 kg
m-3
) and alcohol (density = 800 kg m-3
).
Results:
Depth within liquid = 50.0 cm
Liquid Density (kg m-3
) Manometer reading (cm)
Water 1000
Glycerin 1300
Alcohol 800
Conclusion:
It is observed that the manometer reading increases as the density of the liquid increases.
This shows that the pressure increases with the density of the liquid.
Hypothesis proven.
Hoo Sze Yen Form 4 Experiments Physics SPM 2008
Chapter 3: Forces and Pressure Page 23 of 52
3.2 ARCHIMEDES’ PRINCIPLE
Hypothesis:
The buoyant force on an object in a liquid is equal to the weight of the liquid
displaced
Aim of the experiment:
To find the relationship between the buoyant force acting upon an object in a liquid
and the weight of the liquid displaced
Variables:
Manipulated: Weight of the object
Responding: Buoyant force / Weight of liquid displaced
Constant: Density of liquid used
Apparatus and Materials: Eureka tin, spring balance, stone, thread, beaker, triple
beam balance
Setup:
Procedure:
1. A beaker is weighed with the triple beam balance and its mass, m1 is recorded.
2. The Eureka tin is filled with water right up to the level of the overflow hole. The
beaker is placed beneath the spout to catch any water that flows out.
3. A stone is suspended from the spring balance with thread and its weight in air, W1 is
read from the spring balance.
Hoo Sze Yen Form 4 Experiments Physics SPM 2008
Chapter 3: Forces and Pressure Page 24 of 52
4. The stone is lowered into the Eureka tin until it is completely immersed in water
without touching the bottom of the Eureka tin. The water will overflow into the
beaker.
5. The spring balance reading, W2 is recorded.
6. The beaker with water is weighed with the triple beam balance, and the mass, m2 is
recorded.
Results:
Weight of stone in air = W1
Weight of stone in water = W2
Buoyant force acting on the stone = W2 – W1
Weight of the empty beaker = m1g
Weight of the beaker and displaced water = m2g
Weight of the displaced water = (m2 – m1)g
It is found that W2 – W1 = (m2 – m1)g
Discussion:
The loss of weight of the stone immersed in water is due to the buoyant force of the water
acting upon it.
From the results, it is found that the loss in weight of the stone is equal to the weight of
water displaced.
Conclusion:
Buoyant force on the stone = Weight of the water displaced by the stone
Hypothesis proven.
Note: Experiment can be modified to compare the weight of different sized stones and the
values of buoyant force
3.3 PASCAL’S PRINCIPLE
Hypothesis:
The liquid pressure exerted on a small surface is equal to the liquid pressure exerted
on a large surface in a closed system
Aim of the experiment:
To find the relationship between the pressure in a small syringe and a large syringe
in a closed system
Variables:
Manipulated: Pressure acting on the small syringe
Responding: Pressure acting on the large syringe
Constant: Density of liquid within the system
Hoo Sze Yen Form 4 Experiments Physics SPM 2008
Chapter 3: Forces and Pressure Page 25 of 52
Apparatus and Materials: 5 ml syringe, 10 ml syringe, several weights, rubber tube,
two retort stands
Setup:
Procedure:
1. The diameters of the piston of both syringes are measured and their cross-sectional
areas are calculated.
2. The two syringes are each mounted on a retort stand.
3. The syringes are filled with water and are securely connected to each other with a
rubber tube as shown in the diagram.
4. A weight is placed on the piston of the small syringe.
5. Weights are added to the piston of the large syringe until the water levels in the two
syringes are the same (i.e. syringes are in equilibrium).
6. The forces, F1 and F2 on the syringes are calculated.
7. The pressure, P1 and P2 exerted on the syringes are compared.
Results:
Syringe
size
Cross-sectional
area, A
Mass of the
weight, m
Force exerted on the
syringe, F = mg
Pressure, P
=
A
F
Small A1 m1 F1 P1
Large A2 m2 F2 P2
Discussion:
It is found that the pressure, P1 exerted on the piston of the small syringe is equal to the
pressure, P2 exerted on the piston of the large syringe.
Conclusion:
The water pressure exerted on the piston of the small syringe is equal to the water
pressure exerted on the piston of the large syringe. This shows that the pressure applied to
the piston of the small syringe is transmitted to the piston of the large syringe.
Hypothesis proven.
Hoo Sze Yen Form 4 Experiments Physics SPM 2008
Chapter 3: Forces and Pressure Page 26 of 52
3.4 BERNOULLI’S PRINCIPLE
Hypothesis:
When the velocity of water increases, its pressure decreases and vice versa.
Aim of the experiment:
To find the effects of movement on the pressure exerted by a fluid
Variables:
Manipulated: Velocity of the water
Responding: Pressure of the water
Constant: Density of the water
Apparatus and Materials: Uniform glass tube, Venturi tube, rubber hose, water from
a tap
Procedure:
1. A uniform glass tube is connected to a tap with a rubber hose. The other end of the
tube is closed up with a stopper.
2. The tap is opened slowly so that water flows into it.
3. The levels of the vertical tubes are observed.
4. The stopper is then removed. The tap is adjusted so that the water flows through the
tube at a uniform rate.
5. The levels of the vertical tubes are observed.
6. The experiment is repeated by replacing the uniform glass tube with a Venturi tube.
Results:
Uniform glass tube:
With the stopper Without the stopper
Hoo Sze Yen Form 4 Experiments Physics SPM 2008
Chapter 3: Forces and Pressure Page 27 of 52
Venturi tube:
With the stopper Without the stopper
Discussion:
• The height of the water in the vertical tube represents the pressure at that point.
• When water is not flowing, the pressure along the entire tube is the same, therefore
the water levels in all three vertical tubes are the same.
• For the uniform glass tube:
o Water flows from high pressure to low pressure.
o Therefore, the water levels are decreasing because the pressure is decreasing.
• For the Venturi tube:
o The velocity at Y is higher because of the smaller cross-sectional area.
o Therefore, the pressure at Y is the lowest.
o Pressure still decreases from X to Z because water flows from high pressure to
low pressure.
Conclusion:
The higher the water velocity, the lower the pressure at that point. Hypothesis proven.
Hoo Sze Yen Form 4 Experiments Physics SPM 2008
Chapter 4: Heat and Energy Page 28 of 52
CHAPTER 4:
HEAT AND ENERGY
4.1 SPECIFIC HEAT CAPACITY
Experiment 1: Rise in temperature – varying mass, fixed amount
of heat
Hypothesis:
The bigger the mass of water, the smaller the rise in temperature when supplied
with the same amount of heat
Aim of the experiment:
To determine the rise in temperature of water with varying masses
Variables:
Manipulated: Mass of water, m
Responding: Rise in temperature, θ
Constant: Amount of heat supplied, Q
Apparatus and Materials: Beaker, electric heater, thermometer, stopwatch, triple
beam balance, stirrer, polystyrene sheet, felt cloth
Set up:
Procedure:
1. With the help of a triple beam balance, fill a beaker with water of mass 0.40 kg.
2. The apparatus is set up as shown in the diagram.
3. The initial temperature of the water, θ1 is measured using a thermometer and is
recorded.
4. The electric heater is placed into the water and is switched on for 1 minute. The water
is continuously stirred.
5. The water is continuously stirred even after the heater has been switched off. The
Hoo Sze Yen Form 4 Experiments Physics SPM 2008
Chapter 4: Heat and Energy Page 29 of 52
6. The highest temperature the water reaches, θ2 is measured and recorded. The rise in
temperature, θ = θ2 – θ1 is calculated.
7. The experiment is repeated with water of mass 0.50 kg, 0.60 kg, 0.70 kg, and 0.80 kg.
8. A graph of θ against m and a graph of θ against
m
1
are plotted.
Results:
Mass of water,
m (kg)
Initial
temperature,
θ1 (°C)
Final
temperature,
θ2 (°C)
Rise in
temperature, θ
= θ2 – θ1 (°C)
m
1
(kg-1
)
0.40
0.50
0.60
0.70
0.80
Analysis:
• The amount of heat supplied is made constant by using the same heater for the same
period of time.
• The following graphs are obtained:
Conclusion:
The rise in temperature is inversely proportional to the mass when a constant amount of
heat is supplied. Hypothesis proven.
Experiment 2: Rise in temperature – fixed mass, varying amount
of heat
Hypothesis:
When more heat is supplied to water of fixed mass, the rise in temperature is
greater
Aim of the experiment:
To determine the rise in temperature of water with varying amounts of heat
Variables:
Manipulated: Amount of heat supplied, Q
Responding: Rise in temperature, θ
Constant: Mass of water, m
Hoo Sze Yen Form 4 Experiments Physics SPM 2008
Chapter 4: Heat and Energy Page 30 of 52
Apparatus and Materials: Beaker, electric heater, thermometer, stopwatch, triple
beam balance, stirrer, polystyrene sheet, felt cloth
Set up:
Procedure:
1. With the help of a triple beam balance, fill a beaker with water of mass 0.50 kg.
2. The apparatus is set up as shown in the diagram.
3. The initial temperature of the water, θ1 is measured using a thermometer and is
recorded.
4. The electric heater is placed into the water and is switched on for 1 minute. The water
is continuously stirred.
5. The water is continuously stirred even after the heater has been switched off.
6. The highest temperature the water reaches, θ2 is measured and recorded. The rise in
temperature, θ = θ2 – θ1 is calculated.
7. The experiment is repeated with water of the same mass but with heating time of 2
minutes, 3 minutes, and 4 minutes.
8. A graph of θ against t is plotted.
Results:
Heating time
(minute)
Initial
temperature,
θ1 (°C)
Final
temperature,
θ2 (°C)
Rise in
temperature, θ
= θ2 – θ1 (°C)
1
2
3
4
Analysis:
• Because the same heater with fixed power is used, the heating time, t is defined
operationally as the heat quantity.
• The following graph is obtained:
Hoo Sze Yen Form 4 Experiments Physics SPM 2008
Chapter 4: Heat and Energy Page 31 of 52
Conclusion:
When an object of fixed mass is heated, the rise in temperature changes proportionally to
the amount of heat supplied. Hypothesis proven.
Experiment 3: Determining the specific heat capacity of
aluminium
Aim of the experiment:
To determine the specific heat capacity of aluminium
Apparatus and Materials: Aluminium cylinder, weighing scale, electric heater,
thermometer, power supply, felt cloth, polystyrene sheet, stopwatch, lubricating oil
Set up:
Procedure:
1. An aluminium cylinder with two cavities is weighed and its mass, m is recorded.
2. The electrical power of the heater, P is recorded.
3. The electrical heater is then placed inside the large cavity in the centre of the cylinder.
4. The thermometer is then placed in the small cavity of the aluminium cylinder.
5. A few drops of lubricating oil are added to both cavities to ensure good thermal
contact (better heat transfer).
6. The apparatus is set up as shown in the diagram above.
7. The initial temperature of the aluminium cylinder, θ1 is recorded.
8. The electric heater is switched on and the stopwatch is started simultaneously.
9. After heating for t seconds, the heater is switched off. The highest reading on the
thermometer, θ2 is recorded.
10. The experiment is repeated and an average value of c is calculated.
Hoo Sze Yen Form 4 Experiments Physics SPM 2008
Chapter 4: Heat and Energy Page 32 of 52
Results:
Electric power of heater = P Watt
Heating time = t seconds
Mass of aluminium cylinder = m kg
Initial temperature of the aluminium cylinder = θ1
Final temperature of the aluminium cylinder = θ2
Temperature rise = θ2 – θ1
Electrical energy supplied by the heater = Pt
Heat energy absorbed by the aluminium cylinder = mcθ
On the assumption that there is no heat loss to the surroundings:
Heat supplied = Heat absorbed
Pt = mcθ
Specific heat capacity, c =
θm
Pt
Discussion:
• The aluminium cylinder is wrapped with a felt cloth to reduce the heat loss to the
surroundings and the polystyrene sheet acts as a heat insulator to avoid heat loss to
the surface of the table.
• The value of the specific heat capacity of aluminium, c determined in the experiment
is larger than the standard value. This is because there will be some heat lost to the
surrounding.
• The temperature of the aluminium cylinder will continue to rise after the electrical
heater has been switched off because there is still some heat transfer from the heater
to the cylinder.
Conclusion:
The specific heat capacity of aluminium is a constant.
4.2 SPECIFIC LATENT HEAT
Experiment 1: Heating of naphthalene
Hypothesis:
During the change of state of naphthalene from solid to liquid, there is no change in
temperature when heat is continuously supplied
Aim of the experiment:
To observe the change in temperature when naphthalene is melting
Apparatus and Materials: Boiling tube, naphthalene powder, beaker, thermometer,
Bunsen burner, stopwatch, retort stand, tripod stand, wire gauze
Hoo Sze Yen Form 4 Experiments Physics SPM 2008
Chapter 4: Heat and Energy Page 33 of 52
Set up:
Procedure:
1. The apparatus is set up as shown in the diagram.
2. The initial temperature of the naphthalene is recorded.
3. The Bunsen burner is lighted and the stopwatch started.
4. The temperature of the naphthalene is recorded at 1 minute intervals until the
temperature reaches 100°C.
5. The state of the naphthalene is observed and tabulated throughout the heating process.
6. A graph of temperature against time is drawn.
Results:
Time, t (minute) Temperature of naphthalene, θ (°C)
0
1
2
3
…
Graph of temperature against time:
Discussion:
• The temperature-time graph shows that the temperature of naphthalene rises until the
naphthalene starts to melt.
• The naphthalene starts to melt at 80°C. The temperature remains constant at this value
for several minutes while the naphthalene continues to melt with the heat.
Hoo Sze Yen Form 4 Experiments Physics SPM 2008
Chapter 4: Heat and Energy Page 34 of 52
• After the naphthalene has completely melted, the temperature begins to rise with
continued heating.
Conclusion:
The temperature of the naphthalene remains constant during a change of state from solid
to liquid.
Experiment 2: Cooling of naphthalene
Hypothesis:
During the change of state of naphthalene from liquid to solid, there is no change in
temperature
Aim of the experiment:
To observe the change in temperature when naphthalene is freezing
Apparatus and Materials: Boiling tube, naphthalene powder, beaker, thermometer,
Bunsen burner, stopwatch, retort stand, tripod stand, wire gauze
Set up:
Procedure:
1. The apparatus is set up as shown in the diagram.
2. The naphthalene is heated until the temperature reaches 95°C.
3. The boiling tube is then removed from the water bath and the outer part of the tube is
dried.
4. The temperature of the naphthalene is recorded every minute until the temperature
drops to about 60°C.
5. A graph of temperature against time is drawn.
Hoo Sze Yen Form 4 Experiments Physics SPM 2008
Chapter 4: Heat and Energy Page 35 of 52
Results:
Time, t (minute) Temperature of naphthalene, θ (°C)
0
1
2
3
…
Graph of temperature against time:
Discussion:
• The temperature-time graph shows that the temperature of naphthalene drops until
80°C where it stays constant for several minutes as it freezes.
• After the naphthalene has completely frozen, the temperature continues to drop.
Conclusion:
The temperature of the naphthalene remains constant during a change of state from liquid
to solid.
Experiment 3: Latent heat of fusion (ice)
Aim of the experiment:
To determine the latent heat of fusion of ice
Apparatus and Materials: Pure ice, electric immersion heater, filter funnel, beaker,
stopwatch, weighing balance, power supply, retort stand, clamp
Hoo Sze Yen Form 4 Experiments Physics SPM 2008
Chapter 4: Heat and Energy Page 36 of 52
Set up:
Set A Set B
Procedure:
1. The mass of two empty beakers, A and B are determined using the weighing balance.
2. The apparatus is arranged as shown in the diagram above.
3. Each of the two filter funnels is filled with ice cubes.
4. The immersion heater in Set A, the control experiment, is not connected to the power
supply. The purpose of Set A is to determine the mass of the ice melted by the
surrounding heat. The heater in Set B is switched on.
5. When water starts to drip from the filter funnels at a steady rate, the stopwatch is
started and the empty beakers A and B are placed beneath the filter funnels.
6. After a period of t seconds, the heater B is switched off. The masses of both beakers,
A and B are determined using the weighing balance.
7. The experiment is repeated to get an average value.
Results:
Set A:
Mass of empty beaker = mA1 kg
Mass of beaker + water = mA2 kg
Mass of ice melted by surrounding heat, ma = mA2 – mA1 kg
Set B:
Mass of empty beaker = mB1 kg
Mass of beaker + water = mB2 kg
Mass of ice melted by surrounding heat & immersion heater, mb = mB2 – mB1 kg
Mass of ice melted by the electric immersion heater, m = mb – ma kg
Electrical energy supplied by the electrical immersion heater, E = Pt
Heat energy absorbed by the ice during melting, Q = mL
Assuming there is no heat loss to the surroundings:
Electrical energy supplied = Heat energy absorbed by the melting ice
Pt = mL
Specific latent heat of fusion of ice, L =
m
Pt
Hoo Sze Yen Form 4 Experiments Physics SPM 2008
Chapter 4: Heat and Energy Page 37 of 52
Discussion:
• The purpose of Set A, the control experiment, is to determine the mass of ice melted
by the surrounding heat.
• The immersion heater must be fully immersed in the ice cubes to avoid or reduce heat
loss.
• The stopwatch is not started simultaneously when the immersion heater is switched
on because the immersion heater requires a time period before reaching a steady
temperature. At this point, the rate of melting of ice will be steady.
• The value of the specific latent heat of fusion of ice, L obtained in this experiment is
higher than the standard value because part of the heat supplied by the heater is lost to
the surroundings.
Conclusion:
The specific latent heat of fusion of ice is a constant.
Experiment 4: Latent heat of vapourisation (water)
Aim of the experiment:
To determine the latent heat of vapourisation of water
Apparatus and Materials: Pure water, electric immersion heater, filter funnel, beaker,
stopwatch, weighing balance, power supply, retort stand, clamp
Set up:
Procedure:
1. The apparatus is set up as shown in the diagram above.
2. A beaker is placed on the platform of the electronic weighing balance.
3. The electric heater is fully immersed in the water and held in this position by being
clamped to a retort stand.
4. The electric heater is switched on to heat the water to its boiling point.
5. When the water starts to boil at a steady rate, the stopwatch is started and the reading
on the electronic balance, m1 is recorded.
6. The water is allowed to boil for a period of t seconds.
7. At the end of the period of t seconds, the reading on the electronic balance, m2 is
recorded.
Hoo Sze Yen Form 4 Experiments Physics SPM 2008
Chapter 4: Heat and Energy Page 38 of 52
Results:
Electrical power of heater = P Watt
Time period of boiling = t seconds
Electrical energy supplied by the electrical immersion heater, E = Pt
Mass of water vapourised = m2 – m1
Heat energy absorbed by the water during vapourisation, Q = mL
Assuming there is no heat loss to the surroundings:
Electrical energy supplied= Heat energy absorbed by the vapourized water
Pt = mL
Specific latent heat of vapourization of water, L =
m
Pt
Discussion:
• The immersion heater must be fully immersed in the water to avoid or reduce heat
loss.
• The stopwatch is not started simultaneously when the immersion heater is switched
on because the immersion heater requires a time period before reaching a steady
temperature. At this point, the rate of heating of water will be steady.
• The value of the specific latent heat of vapourization of water, L obtained in this
experiment is higher than the standard value because part of the heat supplied by the
heater is lost to the surroundings.
Conclusion:
The specific latent heat of vapourization of water is a constant.
4.3 BOYLE’S LAW
Option 1: Changing the volume of air to measure pressure
Hypothesis:
When the volume of air decreases, the pressure increases when its mass and
temperature is constant
Aim:
To investigate the relationship between the pressure and volume of air
Variables:
Manipulated: Volume of air within syringe
Responding: Pressure of air
Constant: Mass, temperature of air
Apparatus and Materials: Rubber hose, Bordon gauge, 100 cm3
syringe
Hoo Sze Yen Form 4 Experiments Physics SPM 2008
Chapter 4: Heat and Energy Page 39 of 52
Set up:
Procedure:
1. Apparatus is set up as per the diagram.
2. The nose of the syringe is fitted with a rubber hose and the piston is adjusted so that
air volume of 100 cm3
at atmospheric pressure is trapped in the syringe.
3. The rubber hose is connected to a Bourdon gauge and air pressure is read from the
gauge.
4. The piston of the syringe is pushed in until the trapped air volume becomes 90 cm3
and the air pressure is read from the Bourdon gauge.
5. Step 4 is repeated for air volume values 80, 70, and 60 cm3
.
Results:
Volume, V (cm3
)
V
1
(cm-3
)
Pressure, P (Pa)
100
90
80
70
60
Analysis:
• A graph of P against
V
1
is plotted.
• A linear graph going through the origin is obtained.
• This indicates that pressure is inversely proportional to
the volume of gas.
Conclusion:
Gas pressure of fixed mass is inversely proportional to its
volume.
Hoo Sze Yen Form 4 Experiments Physics SPM 2008
Chapter 4: Heat and Energy Page 40 of 52
Option 2: Changing the pressure of air to measure volume
Hypothesis:
When the pressure of air decreases, the volume increases when its mass and
temperature is constant
Aim:
To investigate the relationship between the pressure and volume of air
Variables:
Manipulated: Pressure of air
Responding: Volume of air trapped in the capillary tube
Constant: Mass, temperature of air
Apparatus and Materials: Bicycle pump, ruler, tank with oil, pressure gauge, glass
tube
Set up:
Procedure:
1. The apparatus is set up as shown in the diagram above.
2. The piston of the bicycle pump is pushed in to compress the air inside the glass tube
until the pressure is 10 kPa.
3. When the reading on the pressure gauge is P, the volume of the air column, V is
recorded.
4. Steps 1 and 2 are repeated for 5 pressure readings of 20 kPa, 30 kPa and 40 kPa.
Hoo Sze Yen Form 4 Experiments Physics SPM 2008
Chapter 4: Heat and Energy Page 41 of 52
Results:
Pressure, P (kPa)
P
1
(Pa-1
)
Volume, V (cm3
)
10
20
30
40
Analysis:
• A graph of V against
P
1
is plotted.
• A linear graph going through the origin is obtained.
• This indicates that pressure is inversely proportional to the
volume of gas.
Conclusion:
Volume of gas of fixed mass is inversely proportional to its pressure.
4.4 CHARLES’ LAW
Hypothesis:
When the temperature of air increases, the volume increases if the mass and
pressure is constant
Aim:
To investigate the relationship between the volume and the temperature of gas
Variables:
Manipulated: Air temperature
Responding: Air volume
Constant: Mass and pressure of the trapped air
Apparatus and Materials: Capillary tube, tall beaker, thermometer, Bunsen burner,
tripod, wire gauze, retort stand, mercury or concentrated sulphuric acid, stirrer,
ruler, ice, rubber band
Hoo Sze Yen Form 4 Experiments Physics SPM 2008
Chapter 4: Heat and Energy Page 42 of 52
Set up:
Procedure:
1. Apparatus is set up as per the diagram.
2. The air to be studied is trapped in a capillary tube by concentrated sulphuric acid.
3. The capillary tube is fitted to a ruler using two rubber bands and the bottom end of
the air column is ensured to match the zero marking on the ruler.
4. Water and ice is poured into the beaker until the whole air column is submerged.
Water is then stirred until the temperature rises to 10 °C. The length of the air column
and the temperature of the water are recorded.
5. Water is heated slowly while being stirred continuously. The length of the air column
is recorded every 10 °C until the water temperature reaches 90 °C.
Results:
Temperature, θ (°C) 10 20 30 40 50 60 70 80 90
Length of air column, x (cm)
Analysis:
• A graph of x against θ is plotted.
• A linear graph is obtained.
• When extrapolated, length x = 0 occurs when gas temperature, θ = -273 °C
• When the Celsius scale is replaced with the Kelvin scale, a linear graph that goes
through origin is obtained.
Hoo Sze Yen Form 4 Experiments Physics SPM 2008
Chapter 4: Heat and Energy Page 43 of 52
Discussion:
From the graph plotted, it is found that the length of the air column, x is directly
proportional to its temperature, T (K). Because gas volume is directly proportional to the
length of the column, it also indicates that gas volume is directly proportional to its
absolute temperature.
Conclusion:
Gas volume of fixed mass is directly proportional to its absolute temperature
4.5 PRESSURE LAW
Hypothesis:
When the temperature of air increases, the pressure increases if the mass and
volume is constant
Aim:
To investigate the relationship between the pressure and the temperature of gas
Variables:
Manipulated: Air temperature
Responding: Air pressure
Constant: Mass and volume of the trapped air
Apparatus and Materials: Round-bottomed flask, mercury thermometer, Bourdon
gauge, Bunsen burner, tripod, wire gauze, retort stand, stirrer, ice
Set up:
Hoo Sze Yen Form 4 Experiments Physics SPM 2008
Chapter 4: Heat and Energy Page 44 of 52
Procedure:
1. Apparatus is set up as per the diagram.
2. The round-bottomed flask is submerged in water and the water bath with ice is stirred
continuously until the temperature of the water bath is stable.
3. The temperature of the water is taken from the thermometer.
4. The reading from the Bourdon gauge is read at temperatures 30, 40, 50, 60, 70 and 80
°C.
Results:
Temperature, θ (°C) 30 40 50 60 70 80
Air pressure, P (Pa)
Analysis:
• A graph of P against θ is plotted.
• A linear graph is obtained.
• When extrapolated, pressure P = 0 occurs when gas temperature, θ = -273 °C
• When the Celsius scale is replaced with the Kelvin scale, a linear graph that goes
through origin is obtained.
Conclusion:
Gas pressure of fixed mass is directly proportional to its absolute temperature
Hoo Sze Yen Form 4 Experiments Physics SPM 2008
Chapter 5: Light and Vision Page 45 of 52
CHAPTER 5:
LIGHT AND VISION
5.1 REFLECTION
Hypothesis:
The angle of reflection is equal to the angle of incidence
Aim of the experiment:
To study the relationship between the angle of incidence and angle of reflection
Variables:
Manipulated: Angle of incidence, i
Responding: Angle of reflection, r
Constant: Plane mirror used
Apparatus/Materials: Light box, plane mirror, plasticine, paper, pencil, protractor
Setup:
Procedure:
9. A straight line, PQ is drawn on a sheet of white paper.
10. The normal line, ON is drawn from a point at the centre of PQ.
11. With the aid of a protractor, lines at angles of incidence 15°, 30°, 45°, 60° and 75° to
the normal line, are drawn to its left.
12. A plane mirror is erected along the line PQ. It is secured in this position with the aid
of plasticine.
13. A ray of light from the ray box is directed along the 15° line. Two positions are
marked with a pencil on the line of the reflected ray.
14. Step 5 is repeated for the other angles of incidence.
15. The plane mirror is removed. The reflected rays are drawn by joining the respective
marks.
16. The angles of reflection corresponding with all the angle of incidence are measured.
The results are tabulated.
Hoo Sze Yen Form 4 Experiments Physics SPM 2008
Chapter 5: Light and Vision Page 46 of 52
Results:
Incident angle (˚) Reflected angle (˚)
15
30
45
60
75
Conclusion:
The angle of incidence is equal to the angle of reflection.
5.2 CURVED MIRRORS
Aim of the experiment:
To study the characteristics of images formed by curved mirrors
Apparatus/Materials: Concave mirror, convex mirror, plasticine, light bulb mounted
on a wooden block, metre rule, white screen
Setup:
Procedure:
1. The apparatus is set up as shown in the diagram.
2. The focal length, f and the radius of curvature, r of the concave mirror, as supplied,
are recorded.
3. The light bulb is positioned at a distance greater than the radius of curvature of the
mirror, i.e. u > 2f. The white screen is moved between the concave mirror and the
light bulb until an image is clearly focused on the screen. The image distance, v is
measured by a metre rule and recorded.
4. Step 3 is repeated with the light bulb positioned at C (u = 2f), between C and F (f < u
< 2f), at F (u = f), and between F and P (u < f).
Hoo Sze Yen Form 4 Experiments Physics SPM 2008
Chapter 5: Light and Vision Page 47 of 52
5. The values of u, v, and the characteristics of the images formed are recorded in a
table.
6. The experiment is repeated by replacing the concave mirror with a convex mirror.
Results:
Concave mirror;
Characteristics of imagePosition of
object
Object
distance, u
(cm)
Image
distance, v
(cm)
Real /
Virtual
Upright /
Inverted
Diminished /
Magnified / Same
size
Beyond C
(u > 2f)
At C
(u = 2f)
Between C
and F
(f < u < 2f)
At F
(u = f)
Between F
and P
(u < 2f)
Convex mirrors:
For all positions, the image characteristics are: __________________________
Conclusion:
• For concave mirrors, images formed can be real or virtual, whereas for convex
mirrors, only virtual images are formed.
• The characteristics of images formed by the concave mirror depend on the position of
the object.
5.3 REFRACTION
Hypothesis:
The refracted light ray obeys Snell’s Law which states that the value of
r
i
sin
sin
is a
constant where i is the angle of incidence and r is the angle of refraction
Aim of the experiment:
To study the relationship between the angle of incidence and angle of refraction
Hoo Sze Yen Form 4 Experiments Physics SPM 2008
Chapter 5: Light and Vision Page 48 of 52
Variables:
Manipulated: Angle of incidence, i
Responding: Angle of refraction, r
Constant: Plane mirror used
Apparatus/Materials: Ray box, glass block, paper, pencil
Setup:
Procedure:
1. The outline of the glass block is traced on a sheet of white paper and labeled.
2. The glass block is removed. Point O is marked on one side of the glass block. With a
protractor, lines forming angles of incidence 20°, 30°, 40°, 50° and 60° are drawn and
marked.
3. The glass block is replaced on its outline on the paper.
4. A ray of light from the ray box is directed along 20° line. The ray emerging on the
other side of the block is drawn.
5. Step 4 is repeated for the other angles of incidence.
6. The glass slab is removed. The points of incidence and the corresponding points of
emergence are joined. The respective angles of refraction are measured with a
protractor.
7. The values of sin i, sin r, and
r
i
sin
sin
are calculated.
Results:
Angle of incidence, i (°) Angle of refraction, r (°) Sin i Sin r
n =
r
i
sin
sin
20
30
40
50
60
Conclusion:
It is found that
r
i
sin
sin
is a constant. Hypothesis valid.
Hoo Sze Yen Form 4 Experiments Physics SPM 2008
Chapter 5: Light and Vision Page 49 of 52
5.4 ACTUAL DEPTH & APPARENT DEPTH
Hypothesis:
The deeper the actual depth, the deeper the apparent depth
Aim of the experiment:
To study the relationship between the actual depth and apparent depth
Variables:
Manipulated: Actual depth, D
Responding: Apparent depth, d
Constant: Refractive index of medium (water), n
Apparatus/Materials: Tall beaker, 2 pins, ruler, metre rule, retort stand
Setup:
Procedure:
1. Apparatus is set up as shown in the diagram.
2. A pin is mounted on a movable clamp on a retort stand.
3. Another pin is placed at the base of the tall beaker. Water is filled as the actual depth
to D = 7.0 cm.
4. The object pin O is observed from the top, and pin I is adjusted vertically until it
appears to meet pin O. At this point, the position of pin I matches the apparent depth,
d of pin O. The apparent depth is measured from the top of the water level to the
position of pin I.
5. Step 4 is repeated by changing the actual depth to 9.0 cm, 11.0 cm, 13.0 cm and 15.0
cm.
6. The results are tabulated and a graph of D against d is plotted.
Hoo Sze Yen Form 4 Experiments Physics SPM 2008
Chapter 5: Light and Vision Page 50 of 52
Results:
Actual depth, D (cm) Apparent depth, d (cm)
7.0
9.0
11.0
13.0
15.0
Analysis:
A linear graph that goes through origin is obtained.
Discussion:
• The gradient of the graph is equal to the index of refraction of water.
Conclusion:
Hypothesis is valid
5.5 TOTAL INTERNAL REFLECTION
Aim of the experiment:
To determine the critical angle of glass
Apparatus/Materials: Semicircular glass block, ray box, protractor, white paper,
pencil
Setup:
Procedure:
1. A semicircular glass block is placed on a sheet of white paper. The outline of the
glass block is traced onto the paper with a sharp pencil.
d
D
Hoo Sze Yen Form 4 Experiments Physics SPM 2008
Chapter 5: Light and Vision Page 51 of 52
2. The glass block is put aside. A normal line, NN’ is drawn through the centre point, O
on the diameter.
3. The glass block is replaced on its outline.
4. A narrow beam of light from the ray box is directed at point O at a small angle of
incidence. The refracted and reflected rays are observed.
5. The angle of incidence, i measured from the normal line is adjusted until the light ray
is refracted along the length of the air-glass boundary. The point of entry of the light
ray is marked and measured with a protractor. At this point, the incident angle is
known as the critical angle, c.
6. The angle of incidence is increased and the resultant rays are observed.
7. The experiment is repeated by pointing the light ray through the other side of the
semicircle.
Results:
• When i < c, part of the light ray is refracted to the air, and part of it will be reflected
back within the glass block
• When i = c, the light ray will be refracted along the length of the glass-air boundary
• When i > c, no refraction occurs; all the light ray will be totally internally reflected
within the glass block
Analysis:
The critical angle, c is a constant.
Refractive index of glass, n =
csin
1
Conclusion:
The refractive index of glass, n =
csin
1
5.6 LENSES
Hypothesis:
The image produced by a convex lens is virtual or real depending on the position of
the object. The characteristics of an image produced by a concave lens is not
affected by the object distance.
Variables:
Manipulated: Object distance, u
Responding: Image distance, v
Constant: Focal length of lens, f
Apparatus/Materials: Cardboard with a cross-wire in triangular cut-out, light bulb,
lens holder, convex lens, concave lens, white screen
Hoo Sze Yen Form 4 Experiments Physics SPM 2008
Chapter 5: Light and Vision Page 52 of 52
Setup:
Procedure:
1. The apparatus is set up as shown in the diagram.
2. The focal length, f of the convex lens supplied is recorded.
3. The object (triangle with a cross-wire) is placed at a distance greater than 2f from the
convex lens.
4. The white screen is moved back and forth until a sharp image of the triangle is
formed on the screen. The image distance, v is measured. The characteristics of the
image are observed and recorded in a table.
5. Step 3 is repeated wit the object distances, u = 2f, f < u < 2f, u = f, and u < f.
6. For positions where the image cannot be formed on the screen, the screen is removed
and the image is viewed through the lens from the other side of the lens.
7. The experiment is repeated by replacing the convex lens with a concave lens.
Results:
Convex lens:
Characteristics of imagePosition
of object
Object
distance, u
(cm)
Image
distance, v
(cm)
Real /
Virtual
Upright /
Inverted
Diminished /
Magnified / Same
size
u > 2f
u = 2f
f < u < 2f
u = f
u < 2f
Concave lens:
For all positions, the image characteristics are: __________________________
Conclusion:
• For convex lenses, images formed can be real or virtual, whereas for concave lenses,
only virtual images are formed.
• The characteristics of images formed by the convex lens depend on the position of the
object.

Form 4 experiments all topics

  • 1.
    Hoo Sze YenForm 4 Experiments Physics SPM 2008 Chapter 1: Introduction to Physics Page 1 of 52 CHAPTER 1: INTRODUCTION TO PHYSICS 1.1 PENDULUM Hypothesis: The longer the length of a simple pendulum, the longer the period of oscillation. Aim of the experiment: To investigate how the period of a simple pendulum varies with its length. Variables: Manipulated: The length of the pendulum, l Responding: The period of the pendulum, T Constant: The mass of the pendulum bob, gravitational acceleration Apparatus/Materials: Pendulum bob, length of thread about 100 cm long, retort stand, stopwatch Setup: Procedure: 1. The thread is tied to the pendulum bob. The other end of the thread is tied around the arm of the retort stand so that it can swing freely. The length of the pendulum, l is measured to 80 cm as per the diagram. Retort stand Pendulum Length, l Thread
  • 2.
    Hoo Sze YenForm 4 Experiments Physics SPM 2008 Chapter 1: Introduction to Physics Page 2 of 52 2. With the thread taut and the bob at rest, the bob is lifted at a small amplitude (of not more than 10°). Ensure that the pendulum swings in a single plane. 3. The time for ten complete oscillations of the pendulum is measured using the stopwatch. 4. Step 3 is repeated, and the average of both readings are calculated. 5. The period of oscillation, T is calculated using the average reading divided by the number of oscillations, i.e. 10. 6. T2 is calculated by squaring the value of T. 7. Steps 1 to 6 are repeated using l = 70 cm, 60 cm, 50 cm, and 40 cm. 8. A graph T2 versus l is plotted. Recording of data: Time of oscillations, t (s) Period of oscillation, TLength of pendulum, l (cm) t1 t2 Average T = t/10 (s) T2 (s2 ) 80 70 60 50 40 Graph of T2 vs l Discussion: The graph of T2 versus l shows a straight line passing through the origin. This means that the period of oscillation increases with the length of the pendulum, with T2 directly proportional to l. Conclusion: The longer the length of the pendulum, the longer the period of oscillation. The hypothesis is proven valid. Length of pendulum, l T2
  • 3.
    Hoo Sze YenForm 4 Experiments Physics SPM 2008 Chapter 2: Forces and Motion Page 3 of 52 CHAPTER 2: FORCES AND MOTION 2.1 INCLINED PLANES Hypothesis: The larger the angle of incline, the higher the velocity just before reaching the end of the runway Aim of the experiment: To study the relationship between the velocity of motion and the angle of inclination Variables: Manipulated: Angle of incline Responding: Velocity just before reaching the end of the runway Constant: Length of runway Apparatus/Materials: Trolley, protractor, wooden blocks, cellophane tape, ticker- timer, ticker tape, power supply, friction-compensated runway Setup: Procedure: 1. The apparatus is set up as per the diagram, and the inclined angle of the plane is measured using a protractor. An initial angle of 5° is used. 2. The ticker-timer is started up and at the same time the trolley is released to slide down the plane. 3. The final velocity when the trolley reaches the end of the plane is calculated using the distance of 10 ticks on the ticker tape. 4. The procedure is repeated by changing the angle of incline to 10°, 15°, 20° and 25°.
  • 4.
    Hoo Sze YenForm 4 Experiments Physics SPM 2008 Chapter 2: Forces and Motion Page 4 of 52 Results: Angle of incline (˚) Final velocity (m s-1 ) 5 10 15 20 25 Analysis: A graph of the velocity of the trolley against the angle of incline is plotted as follows: Conclusion: A higher angle of incline will have a higher velocity at the end of the runway. Hypothesis accepted. Note: The experiment can be modified by making the angle constant and varying the height and length of the runway. Changes must be made accordingly: hypothesis, variable list, procedure, table, analysis, conclusion. Angle of incline (°) Velocity (m s-1 )
  • 5.
    Hoo Sze YenForm 4 Experiments Physics SPM 2008 Chapter 2: Forces and Motion Page 5 of 52 2.2 INERTIA Option 1: Using a saw blade Hypothesis: The larger the mass, the larger the inertia Aim of the experiment: To study the effect of mass on the inertia of an object Variables: Manipulated: Mass, m Responding: Period of oscillation, T Constant: Stiffness of blade, distance of the centre of the plasticine from the clamp Apparatus/Materials: Jigsaw blade, G-clamp, stopwatch, and plasticine spheres of mass 20 g, 40 g, 60 g, 80 g, and 100 g Setup: Procedure: 1. One end of the jigsaw blade is clamped to the leg of a table with a G-clamp as per the diagram drawn. 2. A 20 g plasticine ball is fixed at the free end of the blade. 3. The free end of the blade is displaced horizontally and released so that it oscillates. The time for 10 complete oscillations is measured using a stopwatch. This step is repeated. The average of 10 oscillations is calculated. Then, the period of oscillation is determined. 4. Steps 2 and 3 are repeated using plasticine balls with masses 40 g, 60 g, 80 g, and 100 g. 5. A graph of T2 versus mass of load, m is drawn.
  • 6.
    Hoo Sze YenForm 4 Experiments Physics SPM 2008 Chapter 2: Forces and Motion Page 6 of 52 Results: Time of oscillations, t (s) Period of oscillation, TMass of load, m (g) t1 t2 Average T = t/10 (s) T2 (s2 ) 20 40 60 80 100 Graph of T2 versus m: Discussion: The graph of T2 versus m shows a straight line passing through the origin. This means that the period of oscillation increases with the mass of the load; that is, an object with a large mass has a large inertia. Conclusion: Objects with a large mass have a large inertia. This is the reason why it is difficult to set an object of large mass in motion or to stop it. The hypothesis is valid. Option 2: Using an inertia balance Hypothesis: The larger the mass, the bigger the inertia Aim of the experiment: To study the effect of mass on the inertia of an object Variables: Manipulated: Mass, m Responding: Period of oscillation, T Constant: Stiffness of the inertia balance Apparatus/Materials: Inertia balance, masses for the inertia balance, G-clamp, stopwatch
  • 7.
    Hoo Sze YenForm 4 Experiments Physics SPM 2008 Chapter 2: Forces and Motion Page 7 of 52 Setup: Procedure: 1. The inertia balance is set up by clamping it onto one end of the table as shown in the figure above. 2. One mass is placed into the inertia balance. The inertia balance is displaced to one side so that it oscillates in a horizontal plane. 3. The time for 10 complete oscillations is measured using a stopwatch. This step is repeated. The average of 10 oscillations is calculated. Then, the period of oscillation is determined. 4. Steps 2 and 3 are repeated using two and three masses on the inertia balance. 5. A graph of T2 versus number of masses, n is drawn. Results: Time of oscillations, t (s) Period of oscillation, TNumber of masses, n t1 t2 Average T = t/10 (s) T2 (s2 ) 1 2 3 Graph of T2 versus m: Discussion: The graph of T2 versus m shows a straight line passing through the origin. This means that the period of oscillation increases with the mass of the load; that is, an object with a large mass has a large inertia. Conclusion: Objects with a large mass have a large inertia. This is the reason why it is difficult to set an object of large mass in motion or to stop it. The hypothesis is valid.
  • 8.
    Hoo Sze YenForm 4 Experiments Physics SPM 2008 Chapter 2: Forces and Motion Page 8 of 52 2.3 PRINCIPLE OF CONSERVATION OF MOMENTUM Experiment 1: Elastic collisions Hypothesis: The total momentum before collision is equal to the total momentum after collision, provided there are no external forces acting on the system Aim of the experiment: To demonstrate conservation of momentum for two trolleys colliding with each other elastically Variables: Manipulated: Mass of trolleys Responding: Final velocities of the trolleys / Momentum of the trolleys Constant: Surface of ramp used Apparatus/Materials: Friction-compensated runway, ticker-timer, A.C. power supply, trolleys, wooden block, ticker tape, cellophane tape Setup: Procedure: 1. The apparatus is set up as shown in the diagram. 2. The runway is adjusted so that it is friction-compensated. 3. Two trolleys of equal mass are selected. A spring-loaded piston is fixed to the front end of trolley A. 4. Two pieces of ticker tape are attached to trolleys A and B respectively with cellophane tape. The ticker tapes are separately passed through the same ticker-timer. 5. The ticker-timer is switched on and trolley A is given a slight push so that it moves down the runway at uniform velocity and collides with trolley B which is stationary. 6. The ticker-timer is switched off when both trolleys reach the end of the runway. 7. From the ticker tapes of trolleys A and B, the final velocities are determined. 8. Momentum is calculated using the formula p = mv. 9. The experiment is repeated using different masses of trolleys.
  • 9.
    Hoo Sze YenForm 4 Experiments Physics SPM 2008 Chapter 2: Forces and Motion Page 9 of 52 Recording of data: Before collision After collisionmA mB uA Initial total momentum, mAuA vA vB Final total momentum, mAvA + mBvB m m m 2m 2 m m 2 m 2 m Analysis: From the above table, it is found that: Total momentum before collision = Total momentum after collision Conclusion: Hypothesis proven. Experiment 2: Inelastic collisions Hypothesis: The total momentum before collision is equal to the total momentum after collision, provided there are no external forces acting on the system Aim of the experiment: To demonstrate conservation of momentum for two trolleys colliding with each other inelastically Variables: Manipulated: Mass of trolleys Responding: Final velocities of the trolleys / Momentum of the trolleys Constant: Surface of ramp used Apparatus/Materials: Friction-compensated runway, ticker-timer, A.C. power supply, trolleys, wooden block, ticker tape, cellophane tape, plasticine / Velcro Setup:
  • 10.
    Hoo Sze YenForm 4 Experiments Physics SPM 2008 Chapter 2: Forces and Motion Page 10 of 52 Procedure: 1. The apparatus is set up as shown in the diagram. 2. The runway is adjusted so that it is friction-compensated. 3. Two trolleys of equal mass are selected. Plasticine is fixed to the front end of trolley A. (Alternatively, use Velcro pads) 4. A ticker tape is attached to trolley A with cellophane tape. The ticker tape is passed through the ticker-timer. 5. The ticker-timer is switched on and trolley A is given a slight push so that it moves down the runway at uniform velocity and collides with trolley B which is stationary. 6. The ticker-timer is switched off when both trolleys reach the end of the runway. 7. The final velocity is determined from the ticker tape. 8. Momentum is calculated using the formula p = mv. 9. The experiment is repeated using different masses of trolleys. Results: Before collision After collisionmA mB u Initial total momentum, mAuA v Final total momentum, (mA + mB) v m m m 2m 2 m m 2 m 2 m Analysis: From the above table, it is found that: Total momentum before collision = Total momentum after collision Conclusion: Hypothesis proven. Experiment 3: Explosion Hypothesis: The total momentum before collision is equal to the total momentum after collision, provided there are no external forces acting on the system Aim of the experiment: To demonstrate conservation of momentum for two trolleys moving away from each other from an initial stationary position Variables: Manipulated: Mass of trolleys Responding: Final velocities of the trolleys / Momentum of the trolleys Constant: Surface used
  • 11.
    Hoo Sze YenForm 4 Experiments Physics SPM 2008 Chapter 2: Forces and Motion Page 11 of 52 Apparatus/Materials: Trolleys, wooden blocks, ticker tape, cellophane tape Setup: Before explosion After explosion Procedure: 1. The apparatus is set up as shown in the diagram. 2. Two trolleys A and B of equal mass are placed in contact with each other on an even and smooth surface. Two wooden blocks are placed on the same row at the end of each trolley respectively. 3. The vertical trigger on trolley B is given a light tap to release the spring-loaded piston which then pushes the trolleys apart. The trolleys collide with the wooden blocks. 4. The positions of the wooden blocks are adjusted so that both the trolleys collide with them at the same time. 5. The distances, dA and dB are measured and recorded. 6. The experiment is repeated with different masses of trolleys. Results: Before explosion After explosion Initial total momentum Mass of trolley A, mA Mass of trolley B, mB Distance traveled by trolley A, dA Distance traveled by trolley B, dB Final total momentum, mAdA + mB(-dB) 0 m m 0 m 2m 0 2 m m 0 2m 2m Analysis: Because both trolleys hit the wooden blocks at the same time, the velocity of the trolleys can be represented by the distance traveled by the trolleys. From the above table, it is found that: Initial total momentum = 0 Final total momentum = 0 ∴ Total momentum before collision = Total momentum after collision Conclusion: Hypothesis proven.
  • 12.
    Hoo Sze YenForm 4 Experiments Physics SPM 2008 Chapter 2: Forces and Motion Page 12 of 52 2.4 FORCE, MASS AND ACCELERATION Experiment 1: Relationship between acceleration and mass when force is constant Hypothesis: When the force applied is constant, the acceleration of an object decreases when its mass increases Aim of the experiment: To study the effect of mass of an object on its acceleration if the applied force is constant Variables: Manipulated: Mass, m Responding: Acceleration, a Constant: Applied force, F Apparatus/Materials: Ticker-timer, A.C. power supply, trolleys, elastic band, runway, wooden block, ticker tape, cellophane tape Setup: Procedure: 1. Apparatus is set up as shown in the diagram. 2. A ticker-tape is attached to the trolley and passed through the ticker-timer. 3. The ticker-timer is switched on and the trolley is pulled down the inclined runway with an elastic band attached to the hind post of the trolley. 4. The elastic band must be stretched to a fix length that is maintained throughout the motion down the runway. 5. When the trolley reaches the end of the runway, the ticker-timer is switched off and the ticker tape is removed. 6. Starting from a clearly printed dot, the ticker tape is divided into strips with each strip containing 10 ticks. 7. A ticker tape chart is constructed, and from the chart, the acceleration of the trolley is calculated. 8. The experiment is repeated using 2 and 3 trolleys. The elastic band must be stretched to the same fixed length as in step 4.
  • 13.
    Hoo Sze YenForm 4 Experiments Physics SPM 2008 Chapter 2: Forces and Motion Page 13 of 52 Results: Mass of trolley, m (kg) m 1 Acceleration, a (m s-2 ) 1 trolley 2 trolleys 3 trolleys Analysis: A graph of a against m 1 is drawn. From the graph, it shows that m a 1 α Conclusion: The acceleration of an object decreases when the mass increases. Hypothesis proven. Experiment 2: Relationship between acceleration and force when mass is constant Hypothesis: When the mass is constant, the acceleration of an object increases when the applied force increases Aim of the experiment: To study the effect of force on an object’s acceleration if its mass is constant Variables: Manipulated: Applied force, F Responding: Acceleration, a Constant: Mass, m Apparatus/Materials: Ticker-timer, A.C. power supply, trolleys, elastic band, runway, wooden block, ticker tape, cellophane tape m 1 a
  • 14.
    Hoo Sze YenForm 4 Experiments Physics SPM 2008 Chapter 2: Forces and Motion Page 14 of 52 Setup: Procedure: 1. Apparatus is set up as shown in the diagram. 2. A ticker-tape is attached to the trolley and passed through the ticker-timer. 3. The ticker-timer is switched on and the trolley is pulled down the inclined runway with an elastic band attached to the hind post of the trolley. 4. The elastic band must be stretched to a fix length that is maintained throughout the motion down the runway. 5. When the trolley reaches the end of the runway, the ticker-timer is switched off and the ticker tape is removed. 6. Starting from a clearly printed dot, the ticker tape is divided into strips with each strip containing 10 ticks. 7. A ticker tape chart is constructed, and from the chart, the acceleration of the trolley is calculated. 8. The experiment is repeated using 2 and 3 elastic bands. The elastic bands must be stretched to the same fixed length as in step 4. Results: Force applied, F Acceleration, a (m s-2 ) 1 unit 2 units 3 units Analysis: A graph of a against F is drawn. From the graph, it shows that a α F Conclusion: The acceleration of an object increases when the applied force increases. Hypothesis proven. F a
  • 15.
    Hoo Sze YenForm 4 Experiments Physics SPM 2008 Chapter 2: Forces and Motion Page 15 of 52 2.5 GRAVITATIONAL ACCELERATION Hypothesis: Gravitational acceleration does not depend on an object’s mass Aim of the experiment: To measure the acceleration due to gravity Variables: Manipulated: Mass, m Responding: Gravitational acceleration, g Apparatus/Materials: Ticker-timer, ticker tape, A.C. power supply, retort stand, weights (50 g – 250 g), G-clamp, cellophane tape, soft board Setup: Procedure: 1. Apparatus is setup as shown in the diagram above. 2. One end of the ticker tape is attached to a 50 g weight with cellophane tape, and the other end is passed through the ticker timer. 3. The ticker-timer is switched on and the weight is released so that it falls onto the soft board. 4. The ticker-timer is switched off when the weight lands on the soft board. 5. Gravitational acceleration is calculated from the middle portion of the ticker tape. 6. The experiment is repeated with weights of mass 100 g, 150 g, 200 g, and 250 g.
  • 16.
    Hoo Sze YenForm 4 Experiments Physics SPM 2008 Chapter 2: Forces and Motion Page 16 of 52 Results: Mass of weights (g) Free fall acceleration (m s-2 ) 50 100 150 200 250 Analysis: From the table above, it is found that the gravitational acceleration for all the weights of different masses are the same. Discussion: • The value of the gravitational acceleration, g obtained is less than the standard value of 9.81 m s-2 • This is because the weight is not falling freely. It is affected by: o Air resistance o Friction between ticker tape and ticker-timer Conclusion Gravitational acceleration is not dependent on the mass of the object. Hypothesis proven. 2.6 PRINCIPLE OF CONSERVATION OF ENERGY Hypothesis: Energy cannot be created or destroyed, it can only change form. Aim of the experiment: To investigate the conversion of gravitational potential energy to kinetic energy. Variables: Manipulated: Mass, m Responding: Final velocity, v Constant: Height, h Apparatus/Materials: Ticker-timer, ticker tape, A.C. power supply, trolley, thread, weights, smooth pulley, friction-compensated runway, soft board, cellophane tape
  • 17.
    Hoo Sze YenForm 4 Experiments Physics SPM 2008 Chapter 2: Forces and Motion Page 17 of 52 Setup: Procedure: 1. Apparatus is setup as shown in the diagram above. 2. One end of the ticker tape is attached to the back of the trolley with cellophane tape and the other end is passed through the ticker-timer. 3. The ticker-timer is switched on, and the trolley is released. 4. The final velocity of the trolley and the weight is determined from the ticker tape obtained. 5. The experiment is repeated with different masses of trolleys and weights. Results: Mass of trolley = M kg Mass of weight = m kg Height of weight before release = h m Final velocity of trolley and weight = v m s-1 Loss of potential energy of the weight = mgh Final kinetic energy of the trolley and the weight = ½ (M + m) v2 It is found that ½ (M + m) v2 = mgh Conclusion The loss of potential energy is converted to kinetic energy. Hypothesis proven. Note: The experiment can be modified by making the mass constant and changing the height of the weight’s release. Changes must be made to the variables list and to the last step of the procedure.
  • 18.
    Hoo Sze YenForm 4 Experiments Physics SPM 2008 Chapter 2: Forces and Motion Page 18 of 52 2.7 HOOKE’S LAW Hypothesis: The bigger the weight, the longer the spring extension Aim of the experiment: To determine the relationship between the weight and the spring extension Variables: Manipulated: Weight of the load Responding: Spring extension Constant: Spring constant Apparatus and Materials: Spring, pin, weights, plasticine, retort stand, metre rule Setup: Procedure: 1. The apparatus is setup as shown in the diagram. 2. The length of the spring without any weights, l0 is measured using the metre rule with the pin as reference. 3. A 50 g weight is hung from the bottom of the spring. The new length of the spring, l is measured. The spring extension is l – l0. 4. Step 4 is repeated with weights 100 g, 150 g, 200 g, and 250 g.
  • 19.
    Hoo Sze YenForm 4 Experiments Physics SPM 2008 Chapter 2: Forces and Motion Page 19 of 52 Results: Original length of spring = l0 = __________ cm Load mass (g) Load weight (N) Spring length, l (cm) Spring extension, x = l – l0 (cm) 50 g 0.5 N 100 g 1.0 N 150 g 1.5 N 200 g 2.0 N 250 g 2.5 N Analysis: A graph of spring extension, x against weight, F is plotted. The x-F graph is a linear graph which passes through the origin. This shows that the extension of the spring is directly proportional to the stretching force. Conclusion: Hypothesis proven. F x
  • 20.
    Hoo Sze YenForm 4 Experiments Physics SPM 2008 Chapter 3: Forces and Pressure Page 20 of 52 CHAPTER 3: FORCES AND PRESSURE 3.1 PRESSURE IN LIQUIDS Experiment 1: Water pressure and depth Hypothesis: Water pressure increases with depth Aim of the experiment: To find the relationship between the pressure in a liquid according to its depth Variables: Manipulated: Depth of liquid Responding: Pressure in liquid Constant: Density of liquid Apparatus and Materials: Measuring cylinder, thistle funnel, rubber tube, manometer, metre rule Setup: Procedure: 1. Apparatus is set up as shown in the diagram. 2. The measuring cylinder is completely filled with water. 3. The thistle funnel is lowered into the water to a depth of 10.0 cm. The manometer reading is measured. The difference in the liquid heights in the manometer represent the pressure reading. 4. Step 3 is repeated with values of depth 20.0 cm, 30.0 cm, 40.0 cm and 50.0 cm.
  • 21.
    Hoo Sze YenForm 4 Experiments Physics SPM 2008 Chapter 3: Forces and Pressure Page 21 of 52 Results: Depth (cm) Manometer reading (cm) 10.0 20.0 30.0 40.0 50.0 Analysis: A graph of pressure against depth is drawn. Conclusion: It is observed that the manometer reading increases as the depth of the thistle funnel increases. This shows that the pressure increases with the depth of the liquid. Hypothesis proven. Experiment 2: Water pressure and density Hypothesis: Pressure in liquid increases with its density Aim of the experiment: To find the relationship between the pressure in a liquid and its density Variables: Manipulated: Density of liquid Responding: Pressure in liquid Constant: Depth of liquid Apparatus and Materials: Measuring cylinder, thistle funnel, rubber tube, manometer, metre rule, water, glycerin, alcohol Depth Pressure
  • 22.
    Hoo Sze YenForm 4 Experiments Physics SPM 2008 Chapter 3: Forces and Pressure Page 22 of 52 Setup: Procedure: 1. Apparatus is set up as shown in the diagram. 2. The measuring cylinder is completely filled with water. 3. The thistle funnel is lowered into the water to a depth of 50.0 cm. The manometer reading is measured. The difference in the liquid heights in the manometer represent the pressure reading. 4. The experiment is repeated by replacing the water with glycerin (density = 1300 kg m-3 ) and alcohol (density = 800 kg m-3 ). Results: Depth within liquid = 50.0 cm Liquid Density (kg m-3 ) Manometer reading (cm) Water 1000 Glycerin 1300 Alcohol 800 Conclusion: It is observed that the manometer reading increases as the density of the liquid increases. This shows that the pressure increases with the density of the liquid. Hypothesis proven.
  • 23.
    Hoo Sze YenForm 4 Experiments Physics SPM 2008 Chapter 3: Forces and Pressure Page 23 of 52 3.2 ARCHIMEDES’ PRINCIPLE Hypothesis: The buoyant force on an object in a liquid is equal to the weight of the liquid displaced Aim of the experiment: To find the relationship between the buoyant force acting upon an object in a liquid and the weight of the liquid displaced Variables: Manipulated: Weight of the object Responding: Buoyant force / Weight of liquid displaced Constant: Density of liquid used Apparatus and Materials: Eureka tin, spring balance, stone, thread, beaker, triple beam balance Setup: Procedure: 1. A beaker is weighed with the triple beam balance and its mass, m1 is recorded. 2. The Eureka tin is filled with water right up to the level of the overflow hole. The beaker is placed beneath the spout to catch any water that flows out. 3. A stone is suspended from the spring balance with thread and its weight in air, W1 is read from the spring balance.
  • 24.
    Hoo Sze YenForm 4 Experiments Physics SPM 2008 Chapter 3: Forces and Pressure Page 24 of 52 4. The stone is lowered into the Eureka tin until it is completely immersed in water without touching the bottom of the Eureka tin. The water will overflow into the beaker. 5. The spring balance reading, W2 is recorded. 6. The beaker with water is weighed with the triple beam balance, and the mass, m2 is recorded. Results: Weight of stone in air = W1 Weight of stone in water = W2 Buoyant force acting on the stone = W2 – W1 Weight of the empty beaker = m1g Weight of the beaker and displaced water = m2g Weight of the displaced water = (m2 – m1)g It is found that W2 – W1 = (m2 – m1)g Discussion: The loss of weight of the stone immersed in water is due to the buoyant force of the water acting upon it. From the results, it is found that the loss in weight of the stone is equal to the weight of water displaced. Conclusion: Buoyant force on the stone = Weight of the water displaced by the stone Hypothesis proven. Note: Experiment can be modified to compare the weight of different sized stones and the values of buoyant force 3.3 PASCAL’S PRINCIPLE Hypothesis: The liquid pressure exerted on a small surface is equal to the liquid pressure exerted on a large surface in a closed system Aim of the experiment: To find the relationship between the pressure in a small syringe and a large syringe in a closed system Variables: Manipulated: Pressure acting on the small syringe Responding: Pressure acting on the large syringe Constant: Density of liquid within the system
  • 25.
    Hoo Sze YenForm 4 Experiments Physics SPM 2008 Chapter 3: Forces and Pressure Page 25 of 52 Apparatus and Materials: 5 ml syringe, 10 ml syringe, several weights, rubber tube, two retort stands Setup: Procedure: 1. The diameters of the piston of both syringes are measured and their cross-sectional areas are calculated. 2. The two syringes are each mounted on a retort stand. 3. The syringes are filled with water and are securely connected to each other with a rubber tube as shown in the diagram. 4. A weight is placed on the piston of the small syringe. 5. Weights are added to the piston of the large syringe until the water levels in the two syringes are the same (i.e. syringes are in equilibrium). 6. The forces, F1 and F2 on the syringes are calculated. 7. The pressure, P1 and P2 exerted on the syringes are compared. Results: Syringe size Cross-sectional area, A Mass of the weight, m Force exerted on the syringe, F = mg Pressure, P = A F Small A1 m1 F1 P1 Large A2 m2 F2 P2 Discussion: It is found that the pressure, P1 exerted on the piston of the small syringe is equal to the pressure, P2 exerted on the piston of the large syringe. Conclusion: The water pressure exerted on the piston of the small syringe is equal to the water pressure exerted on the piston of the large syringe. This shows that the pressure applied to the piston of the small syringe is transmitted to the piston of the large syringe. Hypothesis proven.
  • 26.
    Hoo Sze YenForm 4 Experiments Physics SPM 2008 Chapter 3: Forces and Pressure Page 26 of 52 3.4 BERNOULLI’S PRINCIPLE Hypothesis: When the velocity of water increases, its pressure decreases and vice versa. Aim of the experiment: To find the effects of movement on the pressure exerted by a fluid Variables: Manipulated: Velocity of the water Responding: Pressure of the water Constant: Density of the water Apparatus and Materials: Uniform glass tube, Venturi tube, rubber hose, water from a tap Procedure: 1. A uniform glass tube is connected to a tap with a rubber hose. The other end of the tube is closed up with a stopper. 2. The tap is opened slowly so that water flows into it. 3. The levels of the vertical tubes are observed. 4. The stopper is then removed. The tap is adjusted so that the water flows through the tube at a uniform rate. 5. The levels of the vertical tubes are observed. 6. The experiment is repeated by replacing the uniform glass tube with a Venturi tube. Results: Uniform glass tube: With the stopper Without the stopper
  • 27.
    Hoo Sze YenForm 4 Experiments Physics SPM 2008 Chapter 3: Forces and Pressure Page 27 of 52 Venturi tube: With the stopper Without the stopper Discussion: • The height of the water in the vertical tube represents the pressure at that point. • When water is not flowing, the pressure along the entire tube is the same, therefore the water levels in all three vertical tubes are the same. • For the uniform glass tube: o Water flows from high pressure to low pressure. o Therefore, the water levels are decreasing because the pressure is decreasing. • For the Venturi tube: o The velocity at Y is higher because of the smaller cross-sectional area. o Therefore, the pressure at Y is the lowest. o Pressure still decreases from X to Z because water flows from high pressure to low pressure. Conclusion: The higher the water velocity, the lower the pressure at that point. Hypothesis proven.
  • 28.
    Hoo Sze YenForm 4 Experiments Physics SPM 2008 Chapter 4: Heat and Energy Page 28 of 52 CHAPTER 4: HEAT AND ENERGY 4.1 SPECIFIC HEAT CAPACITY Experiment 1: Rise in temperature – varying mass, fixed amount of heat Hypothesis: The bigger the mass of water, the smaller the rise in temperature when supplied with the same amount of heat Aim of the experiment: To determine the rise in temperature of water with varying masses Variables: Manipulated: Mass of water, m Responding: Rise in temperature, θ Constant: Amount of heat supplied, Q Apparatus and Materials: Beaker, electric heater, thermometer, stopwatch, triple beam balance, stirrer, polystyrene sheet, felt cloth Set up: Procedure: 1. With the help of a triple beam balance, fill a beaker with water of mass 0.40 kg. 2. The apparatus is set up as shown in the diagram. 3. The initial temperature of the water, θ1 is measured using a thermometer and is recorded. 4. The electric heater is placed into the water and is switched on for 1 minute. The water is continuously stirred. 5. The water is continuously stirred even after the heater has been switched off. The
  • 29.
    Hoo Sze YenForm 4 Experiments Physics SPM 2008 Chapter 4: Heat and Energy Page 29 of 52 6. The highest temperature the water reaches, θ2 is measured and recorded. The rise in temperature, θ = θ2 – θ1 is calculated. 7. The experiment is repeated with water of mass 0.50 kg, 0.60 kg, 0.70 kg, and 0.80 kg. 8. A graph of θ against m and a graph of θ against m 1 are plotted. Results: Mass of water, m (kg) Initial temperature, θ1 (°C) Final temperature, θ2 (°C) Rise in temperature, θ = θ2 – θ1 (°C) m 1 (kg-1 ) 0.40 0.50 0.60 0.70 0.80 Analysis: • The amount of heat supplied is made constant by using the same heater for the same period of time. • The following graphs are obtained: Conclusion: The rise in temperature is inversely proportional to the mass when a constant amount of heat is supplied. Hypothesis proven. Experiment 2: Rise in temperature – fixed mass, varying amount of heat Hypothesis: When more heat is supplied to water of fixed mass, the rise in temperature is greater Aim of the experiment: To determine the rise in temperature of water with varying amounts of heat Variables: Manipulated: Amount of heat supplied, Q Responding: Rise in temperature, θ Constant: Mass of water, m
  • 30.
    Hoo Sze YenForm 4 Experiments Physics SPM 2008 Chapter 4: Heat and Energy Page 30 of 52 Apparatus and Materials: Beaker, electric heater, thermometer, stopwatch, triple beam balance, stirrer, polystyrene sheet, felt cloth Set up: Procedure: 1. With the help of a triple beam balance, fill a beaker with water of mass 0.50 kg. 2. The apparatus is set up as shown in the diagram. 3. The initial temperature of the water, θ1 is measured using a thermometer and is recorded. 4. The electric heater is placed into the water and is switched on for 1 minute. The water is continuously stirred. 5. The water is continuously stirred even after the heater has been switched off. 6. The highest temperature the water reaches, θ2 is measured and recorded. The rise in temperature, θ = θ2 – θ1 is calculated. 7. The experiment is repeated with water of the same mass but with heating time of 2 minutes, 3 minutes, and 4 minutes. 8. A graph of θ against t is plotted. Results: Heating time (minute) Initial temperature, θ1 (°C) Final temperature, θ2 (°C) Rise in temperature, θ = θ2 – θ1 (°C) 1 2 3 4 Analysis: • Because the same heater with fixed power is used, the heating time, t is defined operationally as the heat quantity. • The following graph is obtained:
  • 31.
    Hoo Sze YenForm 4 Experiments Physics SPM 2008 Chapter 4: Heat and Energy Page 31 of 52 Conclusion: When an object of fixed mass is heated, the rise in temperature changes proportionally to the amount of heat supplied. Hypothesis proven. Experiment 3: Determining the specific heat capacity of aluminium Aim of the experiment: To determine the specific heat capacity of aluminium Apparatus and Materials: Aluminium cylinder, weighing scale, electric heater, thermometer, power supply, felt cloth, polystyrene sheet, stopwatch, lubricating oil Set up: Procedure: 1. An aluminium cylinder with two cavities is weighed and its mass, m is recorded. 2. The electrical power of the heater, P is recorded. 3. The electrical heater is then placed inside the large cavity in the centre of the cylinder. 4. The thermometer is then placed in the small cavity of the aluminium cylinder. 5. A few drops of lubricating oil are added to both cavities to ensure good thermal contact (better heat transfer). 6. The apparatus is set up as shown in the diagram above. 7. The initial temperature of the aluminium cylinder, θ1 is recorded. 8. The electric heater is switched on and the stopwatch is started simultaneously. 9. After heating for t seconds, the heater is switched off. The highest reading on the thermometer, θ2 is recorded. 10. The experiment is repeated and an average value of c is calculated.
  • 32.
    Hoo Sze YenForm 4 Experiments Physics SPM 2008 Chapter 4: Heat and Energy Page 32 of 52 Results: Electric power of heater = P Watt Heating time = t seconds Mass of aluminium cylinder = m kg Initial temperature of the aluminium cylinder = θ1 Final temperature of the aluminium cylinder = θ2 Temperature rise = θ2 – θ1 Electrical energy supplied by the heater = Pt Heat energy absorbed by the aluminium cylinder = mcθ On the assumption that there is no heat loss to the surroundings: Heat supplied = Heat absorbed Pt = mcθ Specific heat capacity, c = θm Pt Discussion: • The aluminium cylinder is wrapped with a felt cloth to reduce the heat loss to the surroundings and the polystyrene sheet acts as a heat insulator to avoid heat loss to the surface of the table. • The value of the specific heat capacity of aluminium, c determined in the experiment is larger than the standard value. This is because there will be some heat lost to the surrounding. • The temperature of the aluminium cylinder will continue to rise after the electrical heater has been switched off because there is still some heat transfer from the heater to the cylinder. Conclusion: The specific heat capacity of aluminium is a constant. 4.2 SPECIFIC LATENT HEAT Experiment 1: Heating of naphthalene Hypothesis: During the change of state of naphthalene from solid to liquid, there is no change in temperature when heat is continuously supplied Aim of the experiment: To observe the change in temperature when naphthalene is melting Apparatus and Materials: Boiling tube, naphthalene powder, beaker, thermometer, Bunsen burner, stopwatch, retort stand, tripod stand, wire gauze
  • 33.
    Hoo Sze YenForm 4 Experiments Physics SPM 2008 Chapter 4: Heat and Energy Page 33 of 52 Set up: Procedure: 1. The apparatus is set up as shown in the diagram. 2. The initial temperature of the naphthalene is recorded. 3. The Bunsen burner is lighted and the stopwatch started. 4. The temperature of the naphthalene is recorded at 1 minute intervals until the temperature reaches 100°C. 5. The state of the naphthalene is observed and tabulated throughout the heating process. 6. A graph of temperature against time is drawn. Results: Time, t (minute) Temperature of naphthalene, θ (°C) 0 1 2 3 … Graph of temperature against time: Discussion: • The temperature-time graph shows that the temperature of naphthalene rises until the naphthalene starts to melt. • The naphthalene starts to melt at 80°C. The temperature remains constant at this value for several minutes while the naphthalene continues to melt with the heat.
  • 34.
    Hoo Sze YenForm 4 Experiments Physics SPM 2008 Chapter 4: Heat and Energy Page 34 of 52 • After the naphthalene has completely melted, the temperature begins to rise with continued heating. Conclusion: The temperature of the naphthalene remains constant during a change of state from solid to liquid. Experiment 2: Cooling of naphthalene Hypothesis: During the change of state of naphthalene from liquid to solid, there is no change in temperature Aim of the experiment: To observe the change in temperature when naphthalene is freezing Apparatus and Materials: Boiling tube, naphthalene powder, beaker, thermometer, Bunsen burner, stopwatch, retort stand, tripod stand, wire gauze Set up: Procedure: 1. The apparatus is set up as shown in the diagram. 2. The naphthalene is heated until the temperature reaches 95°C. 3. The boiling tube is then removed from the water bath and the outer part of the tube is dried. 4. The temperature of the naphthalene is recorded every minute until the temperature drops to about 60°C. 5. A graph of temperature against time is drawn.
  • 35.
    Hoo Sze YenForm 4 Experiments Physics SPM 2008 Chapter 4: Heat and Energy Page 35 of 52 Results: Time, t (minute) Temperature of naphthalene, θ (°C) 0 1 2 3 … Graph of temperature against time: Discussion: • The temperature-time graph shows that the temperature of naphthalene drops until 80°C where it stays constant for several minutes as it freezes. • After the naphthalene has completely frozen, the temperature continues to drop. Conclusion: The temperature of the naphthalene remains constant during a change of state from liquid to solid. Experiment 3: Latent heat of fusion (ice) Aim of the experiment: To determine the latent heat of fusion of ice Apparatus and Materials: Pure ice, electric immersion heater, filter funnel, beaker, stopwatch, weighing balance, power supply, retort stand, clamp
  • 36.
    Hoo Sze YenForm 4 Experiments Physics SPM 2008 Chapter 4: Heat and Energy Page 36 of 52 Set up: Set A Set B Procedure: 1. The mass of two empty beakers, A and B are determined using the weighing balance. 2. The apparatus is arranged as shown in the diagram above. 3. Each of the two filter funnels is filled with ice cubes. 4. The immersion heater in Set A, the control experiment, is not connected to the power supply. The purpose of Set A is to determine the mass of the ice melted by the surrounding heat. The heater in Set B is switched on. 5. When water starts to drip from the filter funnels at a steady rate, the stopwatch is started and the empty beakers A and B are placed beneath the filter funnels. 6. After a period of t seconds, the heater B is switched off. The masses of both beakers, A and B are determined using the weighing balance. 7. The experiment is repeated to get an average value. Results: Set A: Mass of empty beaker = mA1 kg Mass of beaker + water = mA2 kg Mass of ice melted by surrounding heat, ma = mA2 – mA1 kg Set B: Mass of empty beaker = mB1 kg Mass of beaker + water = mB2 kg Mass of ice melted by surrounding heat & immersion heater, mb = mB2 – mB1 kg Mass of ice melted by the electric immersion heater, m = mb – ma kg Electrical energy supplied by the electrical immersion heater, E = Pt Heat energy absorbed by the ice during melting, Q = mL Assuming there is no heat loss to the surroundings: Electrical energy supplied = Heat energy absorbed by the melting ice Pt = mL Specific latent heat of fusion of ice, L = m Pt
  • 37.
    Hoo Sze YenForm 4 Experiments Physics SPM 2008 Chapter 4: Heat and Energy Page 37 of 52 Discussion: • The purpose of Set A, the control experiment, is to determine the mass of ice melted by the surrounding heat. • The immersion heater must be fully immersed in the ice cubes to avoid or reduce heat loss. • The stopwatch is not started simultaneously when the immersion heater is switched on because the immersion heater requires a time period before reaching a steady temperature. At this point, the rate of melting of ice will be steady. • The value of the specific latent heat of fusion of ice, L obtained in this experiment is higher than the standard value because part of the heat supplied by the heater is lost to the surroundings. Conclusion: The specific latent heat of fusion of ice is a constant. Experiment 4: Latent heat of vapourisation (water) Aim of the experiment: To determine the latent heat of vapourisation of water Apparatus and Materials: Pure water, electric immersion heater, filter funnel, beaker, stopwatch, weighing balance, power supply, retort stand, clamp Set up: Procedure: 1. The apparatus is set up as shown in the diagram above. 2. A beaker is placed on the platform of the electronic weighing balance. 3. The electric heater is fully immersed in the water and held in this position by being clamped to a retort stand. 4. The electric heater is switched on to heat the water to its boiling point. 5. When the water starts to boil at a steady rate, the stopwatch is started and the reading on the electronic balance, m1 is recorded. 6. The water is allowed to boil for a period of t seconds. 7. At the end of the period of t seconds, the reading on the electronic balance, m2 is recorded.
  • 38.
    Hoo Sze YenForm 4 Experiments Physics SPM 2008 Chapter 4: Heat and Energy Page 38 of 52 Results: Electrical power of heater = P Watt Time period of boiling = t seconds Electrical energy supplied by the electrical immersion heater, E = Pt Mass of water vapourised = m2 – m1 Heat energy absorbed by the water during vapourisation, Q = mL Assuming there is no heat loss to the surroundings: Electrical energy supplied= Heat energy absorbed by the vapourized water Pt = mL Specific latent heat of vapourization of water, L = m Pt Discussion: • The immersion heater must be fully immersed in the water to avoid or reduce heat loss. • The stopwatch is not started simultaneously when the immersion heater is switched on because the immersion heater requires a time period before reaching a steady temperature. At this point, the rate of heating of water will be steady. • The value of the specific latent heat of vapourization of water, L obtained in this experiment is higher than the standard value because part of the heat supplied by the heater is lost to the surroundings. Conclusion: The specific latent heat of vapourization of water is a constant. 4.3 BOYLE’S LAW Option 1: Changing the volume of air to measure pressure Hypothesis: When the volume of air decreases, the pressure increases when its mass and temperature is constant Aim: To investigate the relationship between the pressure and volume of air Variables: Manipulated: Volume of air within syringe Responding: Pressure of air Constant: Mass, temperature of air Apparatus and Materials: Rubber hose, Bordon gauge, 100 cm3 syringe
  • 39.
    Hoo Sze YenForm 4 Experiments Physics SPM 2008 Chapter 4: Heat and Energy Page 39 of 52 Set up: Procedure: 1. Apparatus is set up as per the diagram. 2. The nose of the syringe is fitted with a rubber hose and the piston is adjusted so that air volume of 100 cm3 at atmospheric pressure is trapped in the syringe. 3. The rubber hose is connected to a Bourdon gauge and air pressure is read from the gauge. 4. The piston of the syringe is pushed in until the trapped air volume becomes 90 cm3 and the air pressure is read from the Bourdon gauge. 5. Step 4 is repeated for air volume values 80, 70, and 60 cm3 . Results: Volume, V (cm3 ) V 1 (cm-3 ) Pressure, P (Pa) 100 90 80 70 60 Analysis: • A graph of P against V 1 is plotted. • A linear graph going through the origin is obtained. • This indicates that pressure is inversely proportional to the volume of gas. Conclusion: Gas pressure of fixed mass is inversely proportional to its volume.
  • 40.
    Hoo Sze YenForm 4 Experiments Physics SPM 2008 Chapter 4: Heat and Energy Page 40 of 52 Option 2: Changing the pressure of air to measure volume Hypothesis: When the pressure of air decreases, the volume increases when its mass and temperature is constant Aim: To investigate the relationship between the pressure and volume of air Variables: Manipulated: Pressure of air Responding: Volume of air trapped in the capillary tube Constant: Mass, temperature of air Apparatus and Materials: Bicycle pump, ruler, tank with oil, pressure gauge, glass tube Set up: Procedure: 1. The apparatus is set up as shown in the diagram above. 2. The piston of the bicycle pump is pushed in to compress the air inside the glass tube until the pressure is 10 kPa. 3. When the reading on the pressure gauge is P, the volume of the air column, V is recorded. 4. Steps 1 and 2 are repeated for 5 pressure readings of 20 kPa, 30 kPa and 40 kPa.
  • 41.
    Hoo Sze YenForm 4 Experiments Physics SPM 2008 Chapter 4: Heat and Energy Page 41 of 52 Results: Pressure, P (kPa) P 1 (Pa-1 ) Volume, V (cm3 ) 10 20 30 40 Analysis: • A graph of V against P 1 is plotted. • A linear graph going through the origin is obtained. • This indicates that pressure is inversely proportional to the volume of gas. Conclusion: Volume of gas of fixed mass is inversely proportional to its pressure. 4.4 CHARLES’ LAW Hypothesis: When the temperature of air increases, the volume increases if the mass and pressure is constant Aim: To investigate the relationship between the volume and the temperature of gas Variables: Manipulated: Air temperature Responding: Air volume Constant: Mass and pressure of the trapped air Apparatus and Materials: Capillary tube, tall beaker, thermometer, Bunsen burner, tripod, wire gauze, retort stand, mercury or concentrated sulphuric acid, stirrer, ruler, ice, rubber band
  • 42.
    Hoo Sze YenForm 4 Experiments Physics SPM 2008 Chapter 4: Heat and Energy Page 42 of 52 Set up: Procedure: 1. Apparatus is set up as per the diagram. 2. The air to be studied is trapped in a capillary tube by concentrated sulphuric acid. 3. The capillary tube is fitted to a ruler using two rubber bands and the bottom end of the air column is ensured to match the zero marking on the ruler. 4. Water and ice is poured into the beaker until the whole air column is submerged. Water is then stirred until the temperature rises to 10 °C. The length of the air column and the temperature of the water are recorded. 5. Water is heated slowly while being stirred continuously. The length of the air column is recorded every 10 °C until the water temperature reaches 90 °C. Results: Temperature, θ (°C) 10 20 30 40 50 60 70 80 90 Length of air column, x (cm) Analysis: • A graph of x against θ is plotted. • A linear graph is obtained. • When extrapolated, length x = 0 occurs when gas temperature, θ = -273 °C • When the Celsius scale is replaced with the Kelvin scale, a linear graph that goes through origin is obtained.
  • 43.
    Hoo Sze YenForm 4 Experiments Physics SPM 2008 Chapter 4: Heat and Energy Page 43 of 52 Discussion: From the graph plotted, it is found that the length of the air column, x is directly proportional to its temperature, T (K). Because gas volume is directly proportional to the length of the column, it also indicates that gas volume is directly proportional to its absolute temperature. Conclusion: Gas volume of fixed mass is directly proportional to its absolute temperature 4.5 PRESSURE LAW Hypothesis: When the temperature of air increases, the pressure increases if the mass and volume is constant Aim: To investigate the relationship between the pressure and the temperature of gas Variables: Manipulated: Air temperature Responding: Air pressure Constant: Mass and volume of the trapped air Apparatus and Materials: Round-bottomed flask, mercury thermometer, Bourdon gauge, Bunsen burner, tripod, wire gauze, retort stand, stirrer, ice Set up:
  • 44.
    Hoo Sze YenForm 4 Experiments Physics SPM 2008 Chapter 4: Heat and Energy Page 44 of 52 Procedure: 1. Apparatus is set up as per the diagram. 2. The round-bottomed flask is submerged in water and the water bath with ice is stirred continuously until the temperature of the water bath is stable. 3. The temperature of the water is taken from the thermometer. 4. The reading from the Bourdon gauge is read at temperatures 30, 40, 50, 60, 70 and 80 °C. Results: Temperature, θ (°C) 30 40 50 60 70 80 Air pressure, P (Pa) Analysis: • A graph of P against θ is plotted. • A linear graph is obtained. • When extrapolated, pressure P = 0 occurs when gas temperature, θ = -273 °C • When the Celsius scale is replaced with the Kelvin scale, a linear graph that goes through origin is obtained. Conclusion: Gas pressure of fixed mass is directly proportional to its absolute temperature
  • 45.
    Hoo Sze YenForm 4 Experiments Physics SPM 2008 Chapter 5: Light and Vision Page 45 of 52 CHAPTER 5: LIGHT AND VISION 5.1 REFLECTION Hypothesis: The angle of reflection is equal to the angle of incidence Aim of the experiment: To study the relationship between the angle of incidence and angle of reflection Variables: Manipulated: Angle of incidence, i Responding: Angle of reflection, r Constant: Plane mirror used Apparatus/Materials: Light box, plane mirror, plasticine, paper, pencil, protractor Setup: Procedure: 9. A straight line, PQ is drawn on a sheet of white paper. 10. The normal line, ON is drawn from a point at the centre of PQ. 11. With the aid of a protractor, lines at angles of incidence 15°, 30°, 45°, 60° and 75° to the normal line, are drawn to its left. 12. A plane mirror is erected along the line PQ. It is secured in this position with the aid of plasticine. 13. A ray of light from the ray box is directed along the 15° line. Two positions are marked with a pencil on the line of the reflected ray. 14. Step 5 is repeated for the other angles of incidence. 15. The plane mirror is removed. The reflected rays are drawn by joining the respective marks. 16. The angles of reflection corresponding with all the angle of incidence are measured. The results are tabulated.
  • 46.
    Hoo Sze YenForm 4 Experiments Physics SPM 2008 Chapter 5: Light and Vision Page 46 of 52 Results: Incident angle (˚) Reflected angle (˚) 15 30 45 60 75 Conclusion: The angle of incidence is equal to the angle of reflection. 5.2 CURVED MIRRORS Aim of the experiment: To study the characteristics of images formed by curved mirrors Apparatus/Materials: Concave mirror, convex mirror, plasticine, light bulb mounted on a wooden block, metre rule, white screen Setup: Procedure: 1. The apparatus is set up as shown in the diagram. 2. The focal length, f and the radius of curvature, r of the concave mirror, as supplied, are recorded. 3. The light bulb is positioned at a distance greater than the radius of curvature of the mirror, i.e. u > 2f. The white screen is moved between the concave mirror and the light bulb until an image is clearly focused on the screen. The image distance, v is measured by a metre rule and recorded. 4. Step 3 is repeated with the light bulb positioned at C (u = 2f), between C and F (f < u < 2f), at F (u = f), and between F and P (u < f).
  • 47.
    Hoo Sze YenForm 4 Experiments Physics SPM 2008 Chapter 5: Light and Vision Page 47 of 52 5. The values of u, v, and the characteristics of the images formed are recorded in a table. 6. The experiment is repeated by replacing the concave mirror with a convex mirror. Results: Concave mirror; Characteristics of imagePosition of object Object distance, u (cm) Image distance, v (cm) Real / Virtual Upright / Inverted Diminished / Magnified / Same size Beyond C (u > 2f) At C (u = 2f) Between C and F (f < u < 2f) At F (u = f) Between F and P (u < 2f) Convex mirrors: For all positions, the image characteristics are: __________________________ Conclusion: • For concave mirrors, images formed can be real or virtual, whereas for convex mirrors, only virtual images are formed. • The characteristics of images formed by the concave mirror depend on the position of the object. 5.3 REFRACTION Hypothesis: The refracted light ray obeys Snell’s Law which states that the value of r i sin sin is a constant where i is the angle of incidence and r is the angle of refraction Aim of the experiment: To study the relationship between the angle of incidence and angle of refraction
  • 48.
    Hoo Sze YenForm 4 Experiments Physics SPM 2008 Chapter 5: Light and Vision Page 48 of 52 Variables: Manipulated: Angle of incidence, i Responding: Angle of refraction, r Constant: Plane mirror used Apparatus/Materials: Ray box, glass block, paper, pencil Setup: Procedure: 1. The outline of the glass block is traced on a sheet of white paper and labeled. 2. The glass block is removed. Point O is marked on one side of the glass block. With a protractor, lines forming angles of incidence 20°, 30°, 40°, 50° and 60° are drawn and marked. 3. The glass block is replaced on its outline on the paper. 4. A ray of light from the ray box is directed along 20° line. The ray emerging on the other side of the block is drawn. 5. Step 4 is repeated for the other angles of incidence. 6. The glass slab is removed. The points of incidence and the corresponding points of emergence are joined. The respective angles of refraction are measured with a protractor. 7. The values of sin i, sin r, and r i sin sin are calculated. Results: Angle of incidence, i (°) Angle of refraction, r (°) Sin i Sin r n = r i sin sin 20 30 40 50 60 Conclusion: It is found that r i sin sin is a constant. Hypothesis valid.
  • 49.
    Hoo Sze YenForm 4 Experiments Physics SPM 2008 Chapter 5: Light and Vision Page 49 of 52 5.4 ACTUAL DEPTH & APPARENT DEPTH Hypothesis: The deeper the actual depth, the deeper the apparent depth Aim of the experiment: To study the relationship between the actual depth and apparent depth Variables: Manipulated: Actual depth, D Responding: Apparent depth, d Constant: Refractive index of medium (water), n Apparatus/Materials: Tall beaker, 2 pins, ruler, metre rule, retort stand Setup: Procedure: 1. Apparatus is set up as shown in the diagram. 2. A pin is mounted on a movable clamp on a retort stand. 3. Another pin is placed at the base of the tall beaker. Water is filled as the actual depth to D = 7.0 cm. 4. The object pin O is observed from the top, and pin I is adjusted vertically until it appears to meet pin O. At this point, the position of pin I matches the apparent depth, d of pin O. The apparent depth is measured from the top of the water level to the position of pin I. 5. Step 4 is repeated by changing the actual depth to 9.0 cm, 11.0 cm, 13.0 cm and 15.0 cm. 6. The results are tabulated and a graph of D against d is plotted.
  • 50.
    Hoo Sze YenForm 4 Experiments Physics SPM 2008 Chapter 5: Light and Vision Page 50 of 52 Results: Actual depth, D (cm) Apparent depth, d (cm) 7.0 9.0 11.0 13.0 15.0 Analysis: A linear graph that goes through origin is obtained. Discussion: • The gradient of the graph is equal to the index of refraction of water. Conclusion: Hypothesis is valid 5.5 TOTAL INTERNAL REFLECTION Aim of the experiment: To determine the critical angle of glass Apparatus/Materials: Semicircular glass block, ray box, protractor, white paper, pencil Setup: Procedure: 1. A semicircular glass block is placed on a sheet of white paper. The outline of the glass block is traced onto the paper with a sharp pencil. d D
  • 51.
    Hoo Sze YenForm 4 Experiments Physics SPM 2008 Chapter 5: Light and Vision Page 51 of 52 2. The glass block is put aside. A normal line, NN’ is drawn through the centre point, O on the diameter. 3. The glass block is replaced on its outline. 4. A narrow beam of light from the ray box is directed at point O at a small angle of incidence. The refracted and reflected rays are observed. 5. The angle of incidence, i measured from the normal line is adjusted until the light ray is refracted along the length of the air-glass boundary. The point of entry of the light ray is marked and measured with a protractor. At this point, the incident angle is known as the critical angle, c. 6. The angle of incidence is increased and the resultant rays are observed. 7. The experiment is repeated by pointing the light ray through the other side of the semicircle. Results: • When i < c, part of the light ray is refracted to the air, and part of it will be reflected back within the glass block • When i = c, the light ray will be refracted along the length of the glass-air boundary • When i > c, no refraction occurs; all the light ray will be totally internally reflected within the glass block Analysis: The critical angle, c is a constant. Refractive index of glass, n = csin 1 Conclusion: The refractive index of glass, n = csin 1 5.6 LENSES Hypothesis: The image produced by a convex lens is virtual or real depending on the position of the object. The characteristics of an image produced by a concave lens is not affected by the object distance. Variables: Manipulated: Object distance, u Responding: Image distance, v Constant: Focal length of lens, f Apparatus/Materials: Cardboard with a cross-wire in triangular cut-out, light bulb, lens holder, convex lens, concave lens, white screen
  • 52.
    Hoo Sze YenForm 4 Experiments Physics SPM 2008 Chapter 5: Light and Vision Page 52 of 52 Setup: Procedure: 1. The apparatus is set up as shown in the diagram. 2. The focal length, f of the convex lens supplied is recorded. 3. The object (triangle with a cross-wire) is placed at a distance greater than 2f from the convex lens. 4. The white screen is moved back and forth until a sharp image of the triangle is formed on the screen. The image distance, v is measured. The characteristics of the image are observed and recorded in a table. 5. Step 3 is repeated wit the object distances, u = 2f, f < u < 2f, u = f, and u < f. 6. For positions where the image cannot be formed on the screen, the screen is removed and the image is viewed through the lens from the other side of the lens. 7. The experiment is repeated by replacing the convex lens with a concave lens. Results: Convex lens: Characteristics of imagePosition of object Object distance, u (cm) Image distance, v (cm) Real / Virtual Upright / Inverted Diminished / Magnified / Same size u > 2f u = 2f f < u < 2f u = f u < 2f Concave lens: For all positions, the image characteristics are: __________________________ Conclusion: • For convex lenses, images formed can be real or virtual, whereas for concave lenses, only virtual images are formed. • The characteristics of images formed by the convex lens depend on the position of the object.