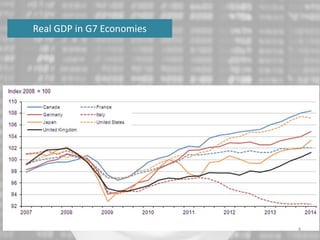
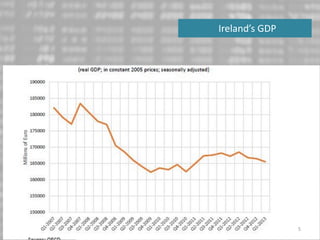
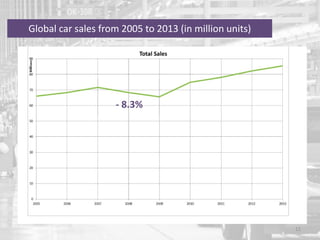
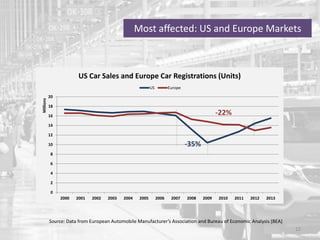
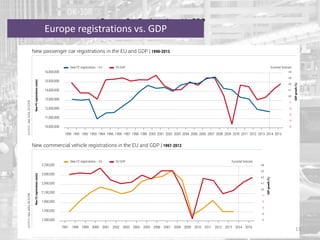
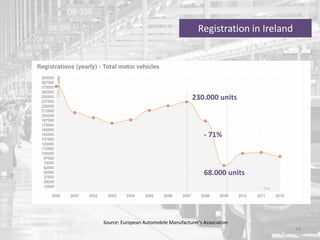
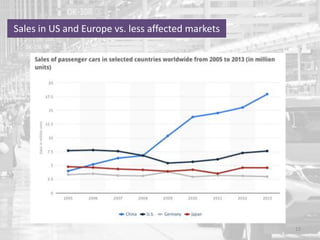
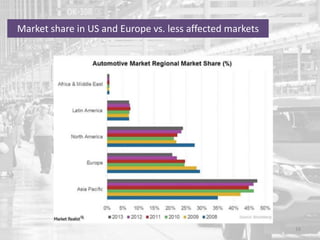
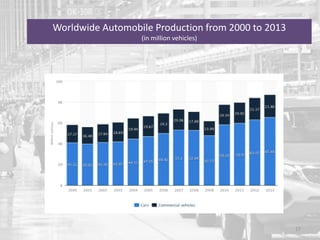
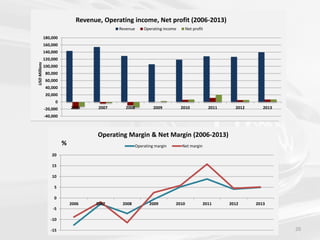
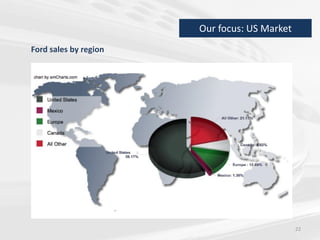
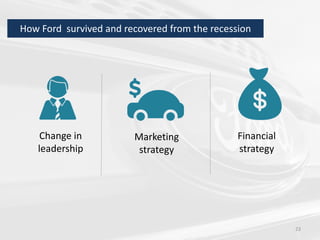
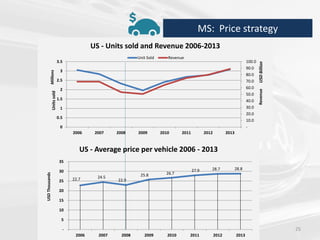
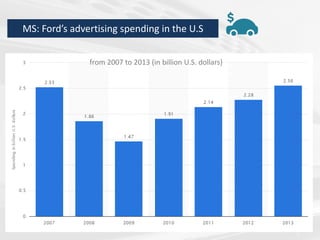
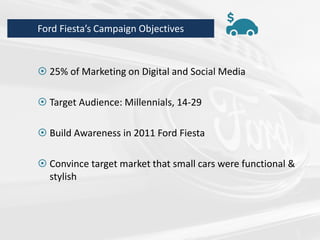
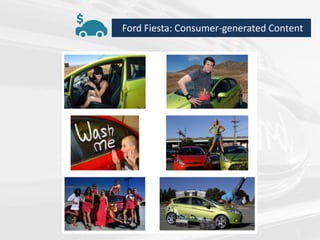
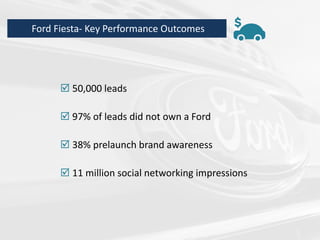
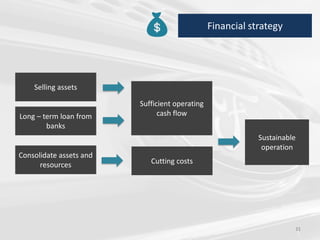
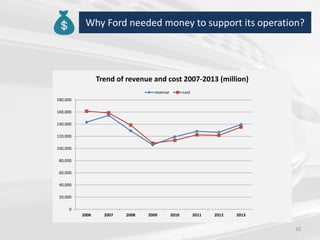
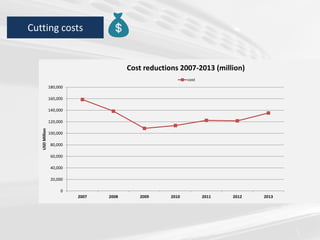
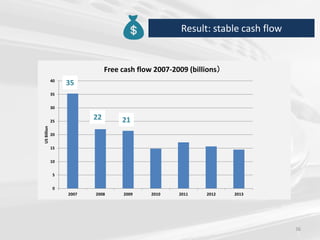
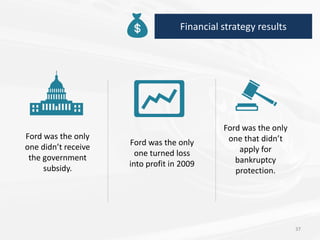
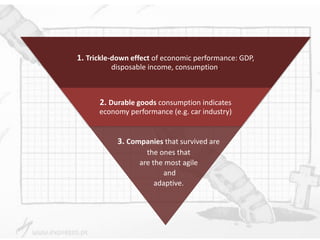
The Impact of Recession in the Automotive Market
Mai Pham, Jing Sun, Kelly Buck, Xiaowei Gong, Natalia Vargas February 2, 2015
The case of
1
Content
1.The global recession
2.The car industry during the global recession
3.Case Study: Ford
4.Conclusions
2
1. The global recession 2007 -2010
3
Real GDP in G7 Economies
4
Ireland’s GDP
5
Consumer confidence weakened
6
7
Drop in disposable income and private consumption (USA)
Ireland
8
Consumption trends during recession
9
2. Industry overview during the recession
10
Global car sales from 2005 to 2013 (in million units)
11
- 8.3%
Source: Data from European Automobile Manufacturer’s Association and Bureau of Economic Analysis (BEA)
Most affected: US and Europe Markets
12
0
2
4
6
8
10
12
14
16
18
20
2000 2001 2002 2003 2004 2005 2006 2007 2008 2009 2010 2011 2012 2013
Millions
US Car Sales and Europe Car Registrations (Units)
US Europe
-22%
-35%
Europe Car Registrations Vs GDP
Source: European Automobile Manufacturer’s Association
Europe registrations vs. GDP
13
Source: European Automobile Manufacturer’s Association
Registration in Ireland
14
230.000 units
68.000 units
- 71%
Sales in US and Europe vs. less affected markets
15
Market share in US and Europe vs. less affected markets
16
Worldwide Automobile Production from 2000 to 2013
(in million vehicles)
17
3. Ford: surviving and recovering from
the recession
18
19
Part I:
What happened to Ford during the
recession?
20
-40,000
-20,000
0
20,000
40,000
60,000
80,000
100,000
120,000
140,000
160,000
180,000
2006 2007 2008 2009 2010 2011 2012 2013
USDMillions
Revenue, Operating income, Net profit (2006-2013)
Revenue Operating income Net profit
-15
-10
-5
0
5
10
15
20
2006 2007 2008 2009 2010 2011 2012 2013
Operating Margin & Net Margin (2006-2013)
Operating margin Net margin%
21
Part II:
How Ford survived and recovered from the
recession?
22
Our focus: US Market
Ford sales by region
How Ford survived and recovered from the recession
Change in
leadership
23
Marketing
strategy
Financial
strategy
CEO, Alan Mulally, 2006 – 2014
Change in leadership
25
22.7 24.5
22.9
25.8 26.7
27.9 28.7 28.8
-
5
10
15
20
25
30
35
2006 2007 2008 2009 2010 2011 2012 2013
USDThousands
US - Average price per vehicle 2006 - 2013
-
10.0
20.0
30.0
40.0
50.0
60.0
70.0
80.0
90.0
100.0
0
0.5
1
1.5
2
2.5
3
3.5
2006 2007 2008 2009 2010 2011 2012 2013
Revenue
UnitssoldMillions
US - Units sold and Revenue 2006-2013
Unit Sold Revenue
MS: Price strategy
USDBillion
.
from 2007 to 2013 (in billion U.S. dollars)
MS: Ford’s advertising spending in the U.S
MS: Product - The “Ford Fiesta Movement”
 25% of Marketing on Digital and Social Media
 Target Audience: Millennials, 14-29
 Build Awareness in 2011 Ford Fiesta
 Convince target market that small cars were functional &
stylish
Ford Fiesta’s Campaign Objectives
Ford Fiesta: Consumer-generated Content
 50,000 leads
 97% of leads did not own a Ford
 38% prelaunch brand awareness
 11 million social networking impressions
Ford Fiesta- Key Performance Outcomes
31
Financial strategy
Selling assets
Long – term loan from
banks
Consolidate assets and
resources
Sufficient operating
cash flow
Sustainable
operation
Cutting costs
32
Why Ford needed money to support its operation?
0
20,000
40,000
60,000
80,000
100,000
120,000
140,000
160,000
180,000
2006 2007 2008 2009 2010 2011 2012 2013
Trend of revenue and cost 2007-2013 (million)
revenue cost
33
23.5
USD billion
Long term loan -2006
34
Sales of Rover and Jaguar
2.3
USD billion
+
Cutting costs
0
20,000
40,000
60,000
80,000
100,000
120,000
140,000
160,000
180,000
2007 2008 2009 2010 2011 2012 2013
USDMillion
Cost reductions 2007-2013 (million)
cost
36
Result: stable cash flow
0
5
10
15
20
25
30
35
40
2007 2008 2009 2010 2011 2012 2013
USBillion
Free cash flow 2007-2009 (billions)
35
22 21
37
Financial strategy results
Ford was the only
one didn’t receive
the government
subsidy.
Ford was the only
one turned loss
into profit in 2009
Ford was the only
one that didn’t
apply for
bankruptcy
protection.
38
Video:
Allan Mulally and Ford’s turnaround
4. Conclusions
39
1. Trickle-down effect of economic performance: GDP,
disposable income, consumption.
2. Durable goods consumption indicates
economy performance (e.g. car industry)
3. Companies that survived are
the ones that
are the most agile
and
adaptive.
The Impact of Recession in the Automotive Market
Mai Pham, Jing Sun, Kelly Buck, Xiaowei Gong, Natalia Vargas February 2, 2015
The case of
41

Ford_Auto Industry Case Study