1. Male Female Male Female
Male Female
2023-2024
2022-2023
2021-2022
2020-2021
2019-2020
2. Female
2023-2024
2022-2023
2021-2022
2020-2021
2019-2020
Male
SCHOOL YEAR TOTAL INCREASE
792 904 1696 -10.03%
881 1004 1885 -16.94%
1054 1216 2270 12.70%
906 1108 2014
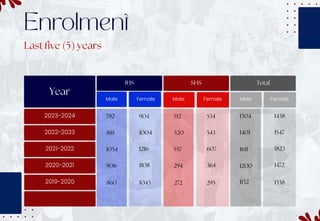
The analysis of enrolment data from 2020-2021 to 2023-
2024 reveals fluctuating trends in student numbers.
There was a significant increase of approximately 12.70%
in enrollment from 2020-2021 to 2021-2022, suggesting
successful recruitment efforts or the introduction of
appealing programs. However, this growth was followed
by a substantial decline of around 16.94% in enrollment
from 2021-2022 to 2022-2023, indicating potential
challenges such as economic factors or shifts in
educational policies. The trend continued with a further
decrease of approximately 10.03% from 2022-2023 to
2023-2024, underscoring ongoing difficulties in
maintaining enrollment levels. These findings emphasize
the importance of understanding and addressing the
underlying factors influencing enrollment fluctuations to
sustainably manage student populations and support
institutional goals.
12.70%
-16.70%
-10.03%
-20.00%
-15.00%
-10.00%
-5.00%
0.00%
5.00%
10.00%
15.00%
2020-2021 2021-2022 2022-2023 2023-2024
INCREASE (%)
3. Female
2023-2024
2022-2023
2021-2022
2020-2021
2019-2020
Male
SCHOOL YEAR TOTAL INCREASE
512 534 1046 -1.60%
520 543 1063 -8.67%
557 607 1164 76.90%
314 394 658
The enrollment data from the years 2020 to 2024 reveals a
fluctuating pattern in student numbers. Initially, there was a
substantial surge in enrollment, with a remarkable 76.90%
increase from 2020-2021 to 2021-2022. However, this upward
trend was followed by a notable decline, evidenced by an
8.67% decrease in enrollment from 2021-2022 to 2022-2023,
and a further 1.60% decrease from 2022-2023 to 2023-2024.
These fluctuations suggest a complex interplay of factors
influencing student enrollment, potentially including
demographic shifts, economic conditions, and educational
policies. While the initial growth may indicate successful
recruitment efforts or increased demand for educational
programs, the subsequent declines underscore the need for
institutions to adapt and respond strategically to changing
enrollment dynamics, emphasizing the importance of
ongoing analysis and proactive planning to ensure long-
term sustainability and effectiveness in meeting educational
goals.
76.90%
-8.67%
-1.60%
-20.00%
0.00%
20.00%
40.00%
60.00%
80.00%
100.00%
2020-2021 2021-2022 2022-2023 2023-2024
INCREASE (%)
4. Death/ Health
Early Pregnancy
Change of Residence
Financial
2019-2020
CAUSES
The data highlights a significant increase in dropout
cases from 2020-2021 to 2021-2022, primarily driven
by financial constraints and family problems. Early
pregnancy also emerged as a notable factor during
this period. However, in 2022-2023, there was a
decrease in total dropouts to 50, with reductions
seen in financial and family-related reasons. While
challenges persist, the decline suggests potential
effectiveness of interventions, emphasizing the
need for continued support to address various
socio-economic and personal factors contributing
to dropout rates
0.14%
10.71%
2.86%
0.00%
5.00%
10.00%
15.00%
2020-
2021
2021-
2022
2022-
2023
RATE (%)
Family Problem/ Dysfunction
S.Y 2021-2022 S.Y 2022-2023
Change of Residence
Financial
Family Problem
S.Y 2020-2021
2 2
1
57 21
0
24 7
0
70 15
0
49 5
0
202 50
1
TOTAL
5. Financial
2019-2020
The data illustrates the distribution of students into three categories—promoted, conditional, and
retained—across the past three years. In the academic year 2020-2021, the majority of students were
promoted (1920), indicating satisfactory academic progress, with a small number in the conditional
(71) and retained (24) categories. In the following year, 2021-2022, the number of promoted students
increased (2008), while there was a decrease in conditional (36) and a slight increase in retained (24)
students. However, in the most recent academic year, 2022-2023, there was a decrease in promoted
students (1728), accompanied by an increase in conditional (57) and retained (51) students. These
trends suggest fluctuations in academic performance and retention efforts, with variations across the
years reflecting ongoing adjustments in support strategies.
Family Problem/ Dysfunction
1728
57 51
2008
36 24
1920
71 24
0
500
1000
1500
2000
2500
PROMOTED CONDITIONAL RETAINED
Trend on Promoted, Conditional & Retained Students
2022-2023 2021-2022 2020-2021
Source: https://lis.deped.gov.ph/sf6
6. Financial
2019-2020
The provided data outlines the distribution of students across three categories—promoted,
conditional, and retained—over the past three academic years. In the academic year 2020-2021,
there was a significant increase in promoted students (640), accompanied by a smaller number in
the conditional (13) and retained (2) categories. The subsequent year, 2021-2022, saw a continued
rise in promoted students (973), with a slight increase in conditional (18) and a notable increase in
retained (30) students. However, in the most recent academic year, 2022-2023, there was a
decrease in promoted students (1004), while both conditional (47) and retained (11) students also
decreased. These fluctuations suggest varying academic performance and retention efforts over
the years, with potential adjustments in support strategies. Despite the fluctuations, efforts seem to
have been made to maintain students' progress and address academic challenges.
Family Problem/ Dysfunction
1004
47 11
973
18 30
640
13 2
0
200
400
600
800
1000
1200
PROMOTED CONDITIONAL RETAINED
Trend on Promoted, Conditional & Retained Students
2022-2023 2021-2022 2020-2021
Source: https://lis.deped.gov.ph/sf6
7. 2019-2020
Based on the data provided over three consecutive school years, there is a consistent trend of
cohort survival rate (CSR) improvement, indicating a positive retention of students from 7th to 10th
grade. In the 2020-2021 school year, the CSR stood at 64.8%, which increased to 68.20% in 2021-2022,
and further rose to 71.00% in 2022-2023. Despite this upward trajectory, spillage, representing the
proportion of students lost during the specified time period, has remained relatively stable.
Additionally, the number of students who graduated each year seems to fluctuate slightly, with a
corresponding completion rate showing slight variations but maintaining above 64%. These data
suggest a commendable effort in retaining students within the school system, with ongoing
opportunities for improvement to ensure sustained growth in graduation rates.
SCHOOL YEAR GRADE 7
ENROLLMENT
(3 YEARS AGO)
G10
ENROLLMENT
COHORT
SURVIVAL RATE
SPILLAGE GRADUATED COMPLETION
RATE
2022-2023 569 404 71.01% 165 400 70.30%
2021-2022 566 386 68.20% 180 384 67.84%
2020-2021 500 324 64.8% 176 323 64.6%
60.00%
62.00%
64.00%
66.00%
68.00%
70.00%
72.00%
COHORT COMPLETION
SY 2020-2021 SY 2021-2022 SY 2022-2023
8. Financial
2019-2020
Analyzing the promotion rates by sex across the school years reveals several notable trends. Firstly,
there is a consistent increase in the total number of students promoted each year, reflecting
potential growth or changes in enrollment. Regarding gender disparities, while the absolute
numbers of promoted males and females differ, both groups generally show an upward trajectory,
indicating an overall positive trend in promotion rates. However, it's essential to note the consistent
gap between male and female promotion figures, with females consistently outnumbering males in
terms of promotions each year. This could suggest potential areas for further investigation into
factors influencing promotion rates, such as academic performance, support systems, or cultural
norms within the school environment. Overall, these insights underscore the importance of ongoing
efforts to ensure equitable opportunities and support for all students in their educational journeys.
Family Problem/ Dysfunction
234
299
457
433
489
100
129
202 195
213
124
170
255
238
276
0
100
200
300
400
500
600
2018-2019 2019-2020 2020-2021 2021-2022 2022-2023
TOTAL MALE FEMALE
9. Financial
2019-2020
The data provided indicates positive trends in student retention at the institution. Despite a
consistent enrollment level over the three years, there was a notable increase in the number of
students retained from 2021-2022 to 2022-2023, jumping from 58 to 141 students. This increase
coincided with a slight rise in the retention rate from 1.04% to 1.11% over the same period, suggesting
an improvement in the institution's ability to retain students. These findings suggest effective
retention efforts or enhancements in support services, ultimately contributing to a more robust
student body continuity and potentially indicative of a healthier institutional environment.
SCHOOL YEAR NO. OF ENROLEES PROMOTION RETENTION
2022-2023 1340 1199 1.11%
(141 students retained)
2021-2022 1340 1295
1.04%
(58 students retained)
2020-2021 1499 1520
0.98%
(21 students retained)
JUNIOR HIGH SCHOOL
SCHOOL YEAR NO. OF ENROLEES PROMOTION RETENTION
2022-2023 1876 2231 0.84%
(355 students retained)
2021-2022 1883 1795
1.04%
(88 students retained)
2020-2021 1737 2413
0.71%
(676 students retained)
SENIOR HIGH SCHOOL
10. Financial
2019-2020
The data for the school year 2023-2024 reveals varying enrollment numbers across different academic strands. The
Humanities and Social Sciences (HUMSS) strand emerges as the most popular choice, constituting approximately 57.67%
of the total enrollees, with 282 students opting for this track. Following HUMSS, the Technical Vocational Livelihood -
Shielded Metal Arc Welding (TVL-SMAW) strand attracts the second highest number of enrollees, comprising around
23.89% of the total enrollment, with 99 students. The other academic strands, including Accountancy, Business, and
Management (ABM), General Academic Strand (GAS), Science, Technology, Engineering, and Mathematics (STEM), and
Technical Vocational Livelihood - Cookery (TVL-Cookery), show relatively lower enrollment numbers, constituting 9.31%,
5.79%, 4.41%, and 3.43% of the total enrollment, respectively. These percentages provide insights into the distribution of
student preferences across different academic tracks for the specified school year.
Academi
c Track,
412, 76%
TVL Track,
133, 24%
SHS by Track
SY 2023-2024
Academic Track
TVL Track
ABM, 53, 10%
GAS, 33, 6%
HUMSS, 282, 52%
STEM, 42, 8%
TVL-Cookery, 34,
6%
TVL-SMAW, 99,
18%
SHS by Track
SY 2023-2024
ABM
GAS
HUMSS
STEM
TVL-Cookery
TVL-SMAW
11. Financial
2019-2020
Beginning(60-74)
Developing(75-
80)
Approaching
Proficiency(81-85)
Proficient(86-89)
Advanced(90-
100)
FILIPINO 157 377 373 395 394
ENGLISH 109 415 410 423 339
MATH 211 296 353 488 348
SCIENCE 249 416 372 377 282
AP 185 185 509 395 380
TLE 228 240 370 474 384
MAPEH 148 254 345 441 508
ESP 42 101 378 613 562
0
100
200
300
400
500
600
700
CMSS INTERPRETATION-JHS
FILIPINO ENGLISH MATH SCIENCE AP TLE MAPEH ESP
The data provides insights into the proficiency levels of junior high school students across different subjects. It
indicates that while there is a range of proficiency levels among students, significant proportions are
demonstrating progress towards proficiency. The majority of students fall within the Developing and
Approaching Proficiency levels, accounting for approximately 47.97% and 61.48% of the total population,
respectively. Subjects like Filipino, English, and Math exhibit a substantial number of students reaching Proficient
and Advanced levels, reflecting notable achievements in these areas. However, there are variations across
subjects, with some subjects having fewer students reaching higher proficiency levels. These findings highlight
both areas of strength and opportunities for improvement in the academic performance of junior high school
students, guiding educators in implementing targeted interventions to support student learning and overall
academic achievement.