The document is a laboratory report that examines how altering the particle size of glass powder compacts affects their density after sintering. Samples of glass powder with different particle size distributions were created, slip-cast into compacts, and sintered at 815°C for 7 minutes. The density of each compact was then calculated. It was found that the sample made of only the finest <200 μm glass powder had the lowest density of 0.184 g/cm3, indicating that smaller particle sizes lead to lower densities after sintering. However, the densities were found to vary within individual compacts, undermining the results. Water absorption tests also showed that more foaming led to a lower density, open-p
![Christopher Parsonson CID 00952857 2
Abstract
The aim of this experiment was to examine the optimum powder size composition needed for the lowest possible density glass
to be produced, preferably lower that 0.12 g cm-3
[3], by varying the particle size within a glass powder compact. This was done
through sintering soda-lime glass compacts of different powder size at a high temperature of 815 °C for 7 and 5 minutes so as to
cause foaming, allowing for each sample’s density to be calculated and porous microstructure to be examined. Overall, it was
found that altering the particle size within the compact changed the final density in that the smaller the powder diameter, the
lower the density, with the sample made of only the finest <200 µm having the lowest density at 0.184 g cm-3
. However, by
looking at the compacts’ cross-sections and by measuring the densities of different parts, it was also found that the density of the
compacts varied throughout their structure, possibly due to the heating inconsistencies in the furnace, the water draining
mechanism during slip casting or simply the experimental error, therefore possibly undermining these results. Additionally,
through recording water absorption, it was found that a greater degree of foaming led to a low-density open-pore structure in
which water may be trapped, therefore reaffirming the established theory.
Introduction
Throughout history, the science of materials and of their properties has been extremely useful in engineering applications, and
this only becomes increasingly apparent with modern technological advances. One such family of materials that have shaped
the world around us is that of glass. Glass is a particularly interesting material because although it has a local order, its general
structure is that of an amorphous brittle solid [1]. This amorphous characteristic makes it easier to remove and replace atoms
and ions in order to manipulate its properties than it would otherwise be in a crystalline material. Indeed, it is this fact that
enables glass to be used across a broad range of engineering applications. Be it in the corrosion resistant “self-cleaning” glass of
the shard, the scratch-immune high strength gorilla glass of the modern day iPhone or the low-density to high-strength ratio
3MTM
Glass Bubble technology of undersea gas recovery operations [2], glass is a fundamental part of society, and an
understanding of how it may be processed to acquire various properties is crucial for materials engineers in order to continue to
advance this exciting area of science.
There are three primary methods for glass processing: molten casting, glass blowing and sintering [3]. This report shall focus
on the use of sintering in low-density sol-gel derived glass production. A sol-gel is simply a dispersion of colloidal particles
within an interconnected rigid open network swollen by water. A fine-powder glass is mixed with water to create a slip/sol-gel
through polymerisation condensation, a process known as “gelation”. During this process, a catalyst is often added to adjust the
pH of the solution and thus determine the type of powder produced. An acidic catalyst will lower the pH of the solution below
the isoelectric point (the point at which the effective charge in the solution is 0 [4]), causing the particles to be attracted to
oneanother and creating a glass powder of “large” particles. A basic catalyst will cause the pH to rise above the isoelectric
point, resulting in the particles repelling oneanother and creating a glass powder of very small nano-sized particles [5]. The
sample is then slip-cast and dried in order to evaporate water droplets and leave pores where water was once present. During
drying, the weak bonds formed by mechanical interlocking and van der Waals forces during condensation shrink and the
porosity reduces, forming a “glass powder compact”.
The final stage in this method of glass production is sintering. Sintering is a process whereby the glass compact is heated
above its transition temperature (Tg ≈ 575-650 °C), causing the structure to relax and undergo viscous flow (the continuous
steady motion of particles within a material [6]). In a sol-gel derived glass, this allows for tertiary particles (that have formed as
a result of the aggregation of secondary particles within the wet gel) to fuse together, increasing the density of the glass. The
high temperatures used during sintering evaporate much of the remaining water within the gel structure, leading to further
shrinkage of bonds and reduction in porosity and thus an additional increase in density. If the sintering conditions are suitable,
however, the compact will undergo glass foaming.
Glass foaming allows for the production of very low-density glass. To foam a glass, the compact must be heated to very high
temperatures in order for rapid sintering to occur at the surface of the compact before the centre has time to undergo much
viscous flow, forming what is referred to as a primary melt; essentially a surface layer of liquid glass phase [7]. This primary
melt traps or “seals” the air present within the compact’s pores that formed during drying, preventing it from escaping and
creating “gas bubbles”. As the sample is heated and the glass melts, these air particles gain energy and increase the internal
pressure of the glass through collisions with the pore walls as they “try” to escape into the atmosphere, thus expanding the
pores through gas bubble expansion. As these pores grow in size, the volume of the glass increases and therefore the density
decreases, thus producing a low-density glass. This process is shown in Figure 1.](https://image.slidesharecdn.com/736f8379-bbed-49f0-86a2-fe3fa5e3d3b7-161018135028/85/Foamed-Glass-Extended-Lab-Report-2-320.jpg)
![Christopher Parsonson CID 00952857 3
As is shown in Table 1, if sintering is carried out at the usual aforementioned temperature range, no foaming occurs and the
density increases. If, however, it is carried out at a higher temperature range, a degree of foaming is observed through the
reduction in density. For a glass to be amorphous, it must not exceed its crystallisation temperature (Tc ≈ 775 °C) shown by the
general differential thermal analysis (DTA) scan in Figure 2, therefore care must be taken not to make the sintering temperature
too high so as to cause crystallisation or too low so as to prevent foaming.
Figure 2: General glass DTA trace showing
the glass transition (Tg), the crystallisation
temperature (Tc) and the window in which
sintering/foaming of the glass may operate
[1].
Figure 1: Schematic
showing the process of
glass foaming [7].
Table 1: Observations made of the
influence of temperature on glass powder
compact samples [3].](https://image.slidesharecdn.com/736f8379-bbed-49f0-86a2-fe3fa5e3d3b7-161018135028/85/Foamed-Glass-Extended-Lab-Report-3-320.jpg)
![Christopher Parsonson CID 00952857 4
During low-density glass production, the degree of foaming that takes places is very important in determining the quality
and the properties of the final product. The density may be reduced to a point where the sealed air inside the pores of the
compact is at thermal equilibrium with the surrounding environment, thus maintaining closed pores within the structure. At
this point, the strength to density ratio of the glass will be at its greatest, therefore if a low-density glass with high compressive
strength is required, the sample should be removed from the furnace. Continued heating at a necessarily elevated temperature
will result in the internal pressure exerted by the expanding gas bubbles of the pores becoming great enough for them to burst
open, allowing the air to escape and essentially causing the pores to join up and create larger pores, therefore further decreasing
the density. Continued expansion will form an open structure of channels through which air may exit into the atmosphere. This
is a process known as piercing [3]. Glass that has undergone piercing will have a lower thermal conductivity due to greater pore
size and therefore will have greater insulating properties, however this will be at the cost of a lower compressive strength.
Additionally, too many open channels allowing air to escape may impede insulation. Therefore, it is essential for the foaming
process to be adequately tailored to produce a product that meets the properties required for its application.
Three simple ways to vary the foaming process are through varying the sintering temperature, the sintering time and the glass
particle size [7]. This report shall focus on the latter. If three glass powder compacts are considered; one (sample a) consisting of
100% “large” particle size (>200 µm in diameter), one (sample c) consisting of 100% “small” particle size (<200 µm in
diameter) and finally one (sample b) consisting of a mixture of large and small particle sizes, a diagram of what their structures
might look like may be drawn, as shown in Figure 3.
Figure 3: Diagram of glass powder
compacts with varying particle size
[7]:
a) 100% large (>200 µm in
diameter) particle size.
b) Mixture of large & small
particle size.
c) 100% small (<200 µm in
diameter) particle size.
Figure 3 shows that the stacking of the large particle size in a results in the biggest vacancies being present. The stacking of
the smaller particles in c is closer and therefore creates smaller vacancies, and the stacking in mixed sample b is closer still, with
the smaller particles filling the large vacancies created by the larger particles. Thus, in terms of vacancy size, b < c < a. It would
therefore be expected for the larger particle compacts to have the lowest density at 0 minutes of sintering and for the mixed
particle compacts to have the highest density, as shown in Figure 4. The same relationship applies for the respective maximum
densities. Additionally, as discussed in an experiment carried out by AZO Materials [8], due to the initial vacancies after foaming
the final frequency of pores within the smaller samples would be the greatest, followed by the mixed powders and finally by the
large compacts (holding the lowest number of pores). Due to the stacking shown in Figure 3, the large particles would be
expected to have the largest pore diameters.
Figure 4 also shows that during the sintering process, a constant density is eventually reached, which occurs when either (as
previously explained) the pores are at equilibrium with their environment or if the maximum amount of piercing has occurred
so that no expanding air/gas bubbles are left trapped within the pores. As this is the point of lowest density during the foaming
process, it is this part of the process that will be focused on in this report.
Interestingly, Figure 4 also shows that despite the mixed particle size compact having the greatest initial and maximum
density, it would be expected for it to have the lowest final (constant) density after foaming. According to X. Song’s 2014 student
thesis [7], this occurs because the pores in the mixed particle compact are able to expand to a greater extent than in the other
compacts. Additionally, the minimum density is reached in the mixed compact after a shorter sintering time than the other two
compacts. This is perhaps due to the wall strength of the pores/vacancies being greater due to the presence of small particles
within the large vacancies created by the large particles. This report will aim to further clarify this theory of somewhat limited
reliability.](https://image.slidesharecdn.com/736f8379-bbed-49f0-86a2-fe3fa5e3d3b7-161018135028/85/Foamed-Glass-Extended-Lab-Report-4-320.jpg)
![Christopher Parsonson CID 00952857 5
Figure 4: Graph of recorded
bulk density vs.
heating/sintering time for
compacts of varying particle
size [7].
Up to this point, it has been (roughly) established that a general mixture of particle size within a compact enables for a
foamed glass to have the lowest density. What has not been clearly determined, however, is the optimum variation in particle
size within the composition needed for the absolute lowest density to be reached (below 0.12 g cm-3
[3]), which is an important
question to answer when considering the use of low-density glass in low-quality recycled glass products, and this is therefore
what this report shall specifically look into.](https://image.slidesharecdn.com/736f8379-bbed-49f0-86a2-fe3fa5e3d3b7-161018135028/85/Foamed-Glass-Extended-Lab-Report-5-320.jpg)
![Christopher Parsonson CID 00952857 6
Experimental
The experiment began by taking a series of fine to coarse soda-lime glass powders of diameters 1,000-600 µm, 600-400 µm, 400-
200 µm and <200 µm. The powders were a raw material made from commercial recycled glass aggregates using a vibratory mill
containing aluminium oxide milling cylinders. As shown in Table 2, slips of varying composition were prepared by using the
approximate ratio of 5 g of powder to 2 g of water. For 3 mixed powders, around 10% of the compact consisted of >200 µm
powder with the rest being made up of <200 µm powder. The pure powders contained 100% of just one powder, and the final
mixed powders contained an incrementally increasing % 200-400 µm powder in bulk <200 µm. Note that no catalyst was used.
The slips were then cast by placing them in an open mould with a plasterboard base used to absorb the water, as shown in
Figure(s) 5. The casts were left to dry for 7 days, after which they were carefully removed so as not to break the weak
mechanical interlocking and van der Waals forces holding them together, and placed in a furnace to sinter and foam at varying
conditions, as shown in Table 3 and Table 6. Using the prior observations made in Table 1, a sintering temperature of 815 °C for
7 and 5 minutes were chosen. To spread the available powder resources, the 7-minute sintering time data were used from
another student’s experiment [9].
The green body density was then calculated by breaking off part of a given sintered glass compact sample, grinding it to a
regular cubic/rectangular shape and measuring its dimensions using a Vernier calliper. The samples were left to re-dry for 2
hours before their masses were measured and Equation 1 was used to calculate the density, as is shown in Table 3.
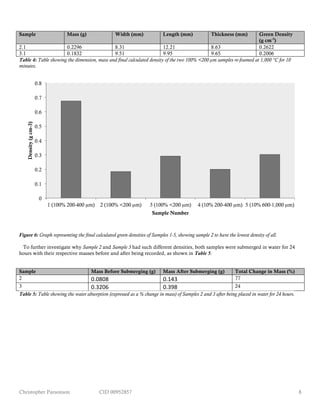
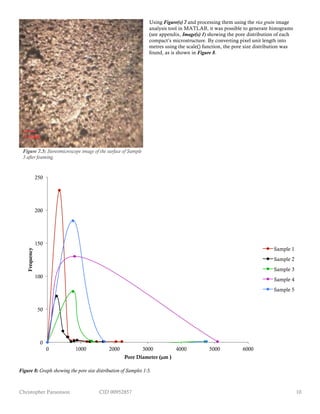
Finally, using the ground glass compact samples and a stereomicroscope (used because the optical microscope struggled to
focus on individual pores due to focal length issues), the pore size/distribution of the glass was examined and calculated using
MATLAB in order to observe the degree of foaming that had occurred during sintering. Additionally, two samples (the two
100% <200 µm glass powders) were submerged in water for 24 hours and re-weighed in order to observe the amount of water
absorption that would occur. Samples of the same <200 µm composition that had been sintered but not submerged were then
placed back in the furnace at 1,000 °C for a further 10 minutes to see if there was any additional foaming/change in density
and, if so, by how much this changed.
Results
As outlined in the experimental section of this report, slips of varying composition were mixed, as shown in Table 2.
Sample <200 µm Powder
(g)
200-400 µm
Powder (g)
400-600 µm
Powder (g)
600-1,000 µm
Powder (g)
Water (g)
X 0.00 0.00 0.00 5.02 2.15
1 0.00 5.00 0.00 0.00 2.24
2 5.07 0.00 0.00 0.00 2.02
3 5.04 0.00 0.00 0.00 2.10
4 4.53 0.685 0.00 0.00 2.10
5 4.63 0.00 0.00 0.53 2.00
Table 2: Table showing the composition of each glass compact sample made for 7 minute sintering at 815 °C.
The glass compacts were then slip-cast and left to dry for 7 days on a plasterboard, as shown in Figure(s) 5.](https://image.slidesharecdn.com/736f8379-bbed-49f0-86a2-fe3fa5e3d3b7-161018135028/85/Foamed-Glass-Extended-Lab-Report-6-320.jpg)
![Christopher Parsonson CID 00952857 7
Due to its crumbling after removal from the mould, Sample X could no longer be used for the duration of the experiment.
As mentioned in the experimental, Samples 1-5 were placed in a furnace set at 815 °C and left for 7 minutes to sinter and foam
before being removed, cooled and ground into a cubic/rectangular shape, allowing for their densities to be calculated as shown
in Table 3. Defining the glass compacts as green bodies (meaning a weakly-bonded ceramic material often in the form of a
powder [10]), the “green” or “bulk” density (which is inclusive of solid particle, liquid and empty pore/vacancy volume [11])
could be calculated using Equation 1.
𝐷𝑒𝑛𝑠𝑖𝑡𝑦 =
!"##
!"#$%&
(Equation 1)
Sample Mass (g) Width (mm) Length (mm) Thickness (mm) Green Density
(g cm-3
)
1 0.5289 10.52 11.66 6.39 0.6748
2 0.0808 8.47 7.36 7.04 0.1841
3 0.3206 12.64 11.68 7.45 0.2915
4 0.2301 11.71 10.44 9.43 0.1996
5 0.3780 12.26 10.26 9.93 0.3026
Table 3: Table showing the dimension, mass and final calculated density of each compact sample after foaming at 815 °C for 7 minutes.
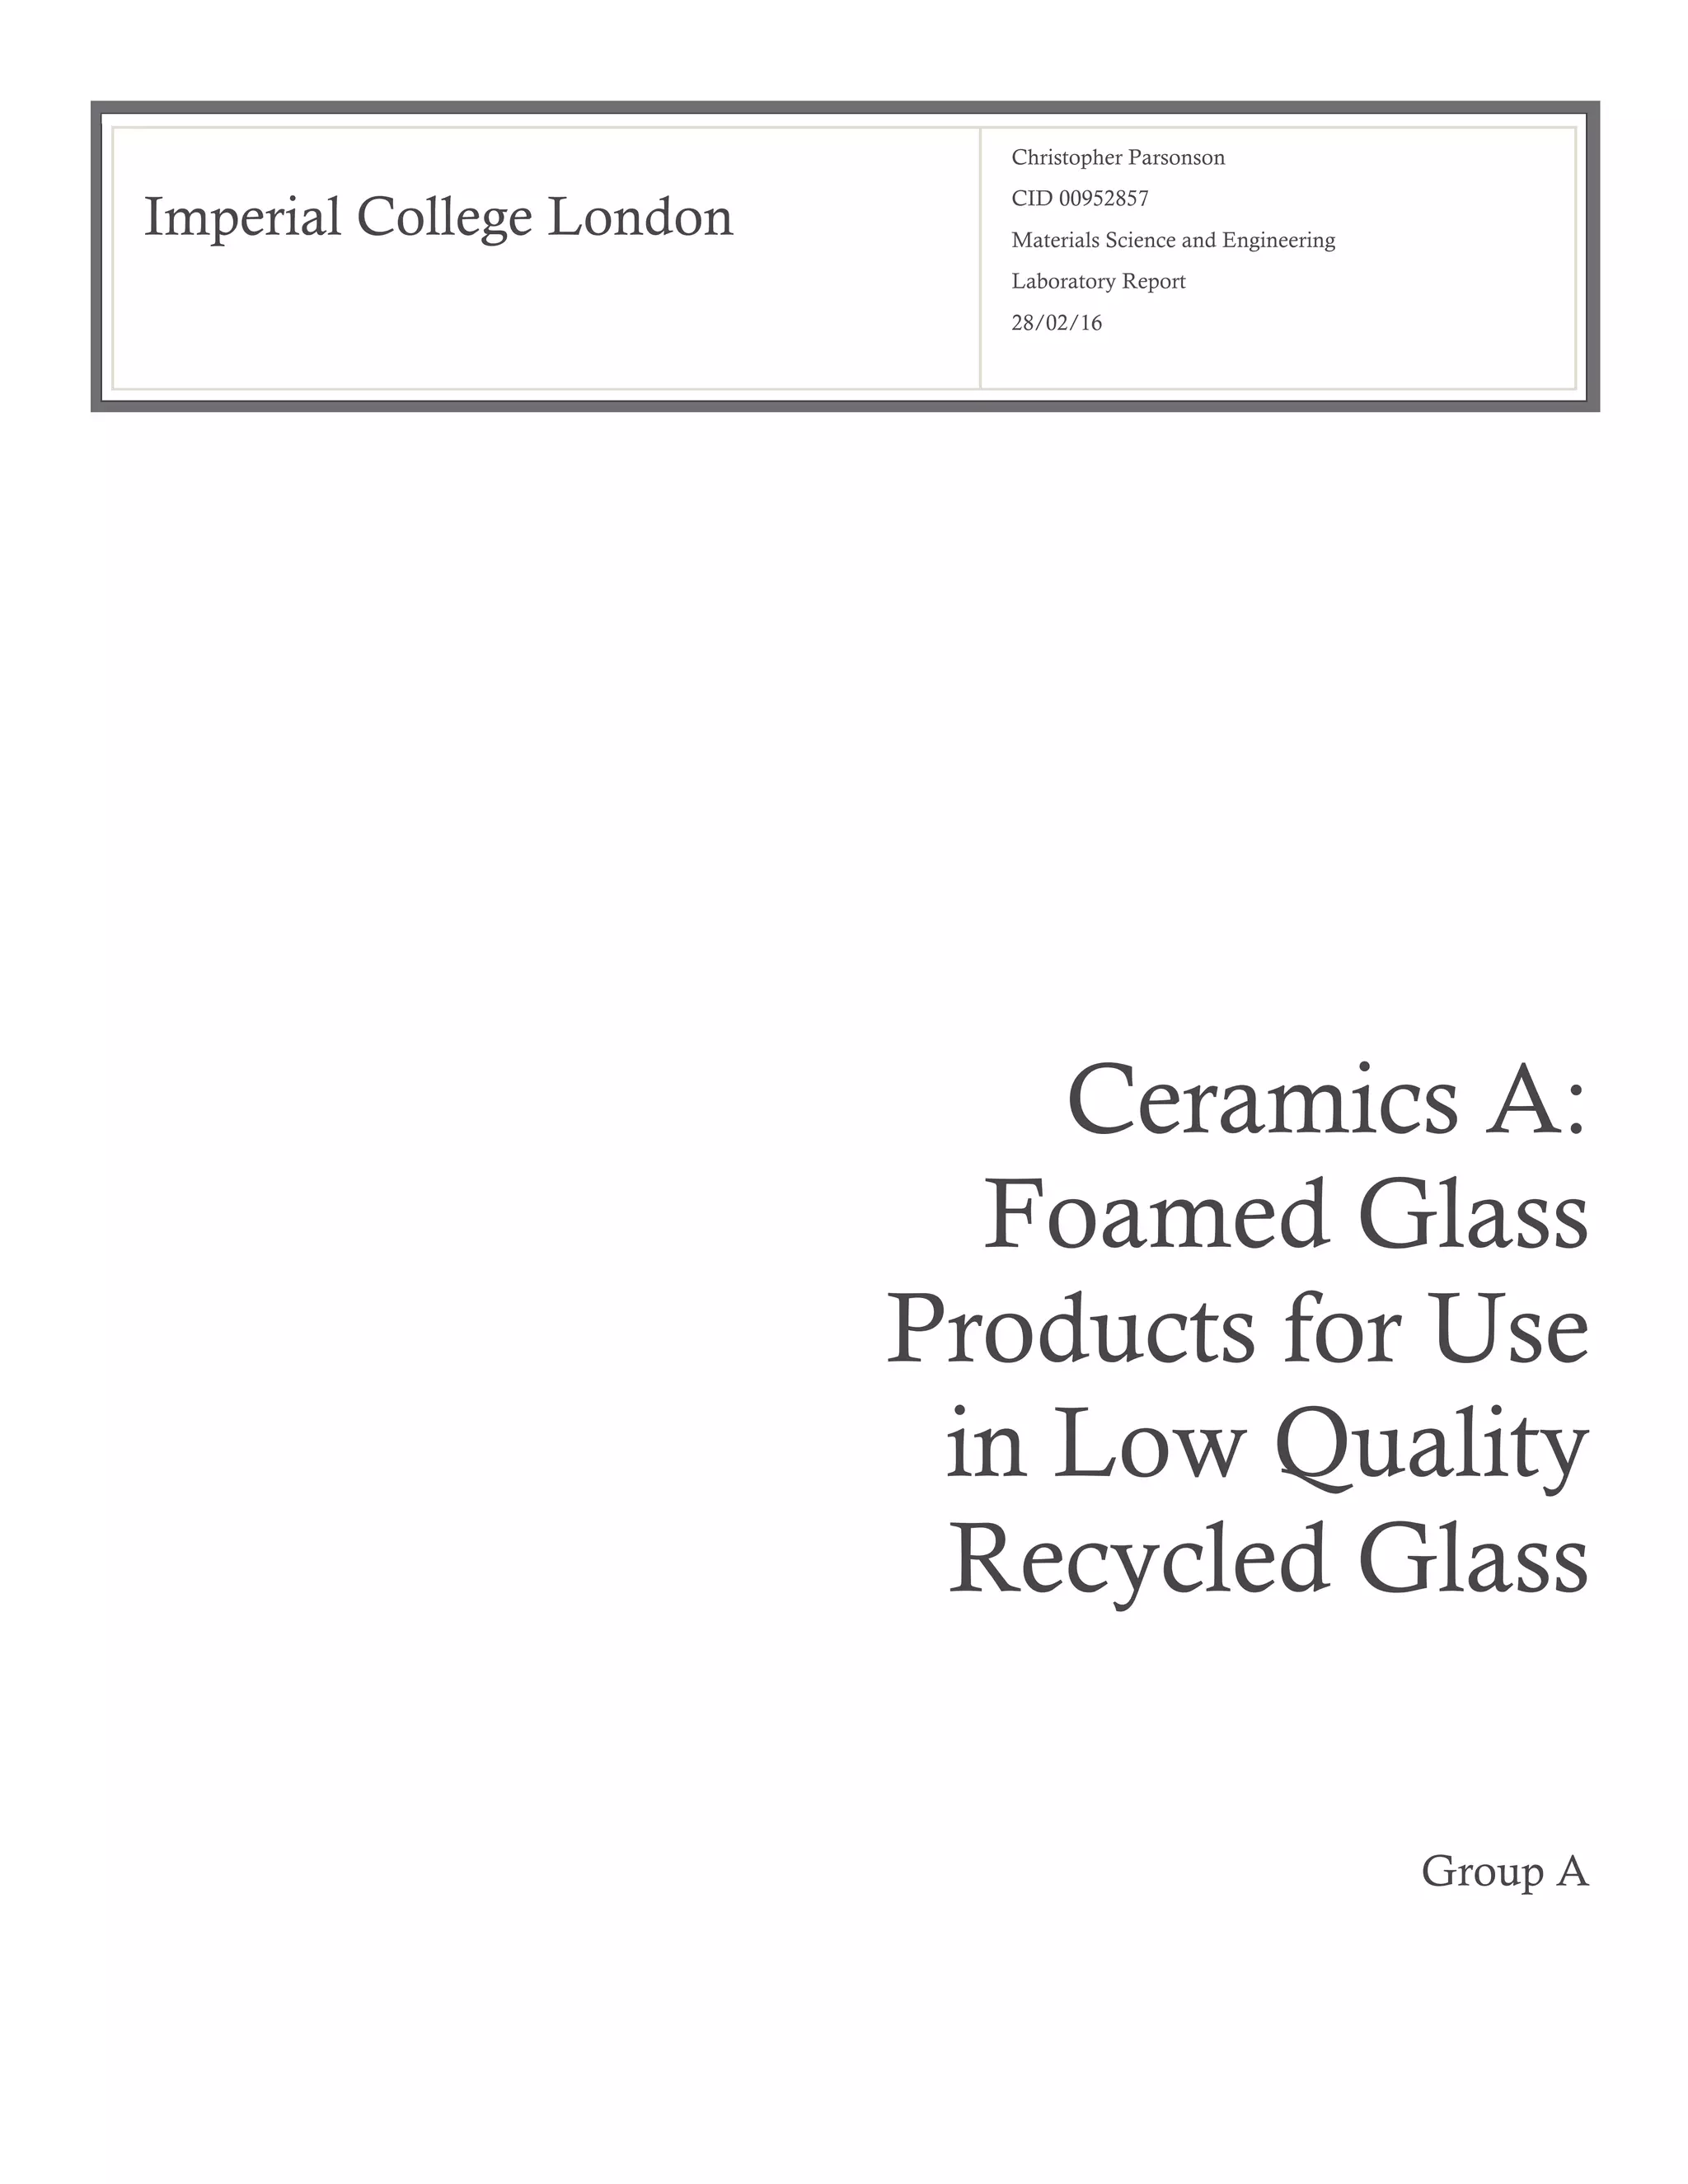
These data may be easily represented and compared graphically using a bar chart to give the lowest density compact as being
Sample 2, as shown in Figure 6. With Samples 2 & 3 having the same composition but with a density that differed by ≈60% (in
that Sample 2 had a significantly lower density than Sample 3), it was decided for further testing to be carried out. As stated in
the experimental, another part of the already sintered Samples 2 & 3 were broken off and foamed for a further 10 minutes at
1,000 °C to see if perhaps Sample 3 had not foamed as much as it could have otherwise. These new versions of Sample 2 and
Sample 3 were named Sample 2.1 and Sample 3.1 respectively, and the density calculations after further foaming are shown in
Table 4.
Figure 5.1: Image showing the samples in their cast having
been dried by the water draining into the plasterboard lying
below.
Figure 5.2: Image showing the samples having been removed
from their cast, leaving a green body glass compact.](https://image.slidesharecdn.com/736f8379-bbed-49f0-86a2-fe3fa5e3d3b7-161018135028/85/Foamed-Glass-Extended-Lab-Report-7-320.jpg)
![Christopher Parsonson CID 00952857 12
Discussion
Before analysing the results of this experiment, it is important to look at potential sources of uncertainty and unreliability in the
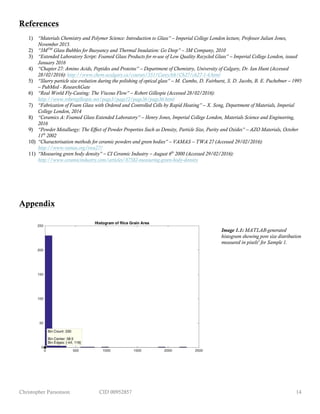
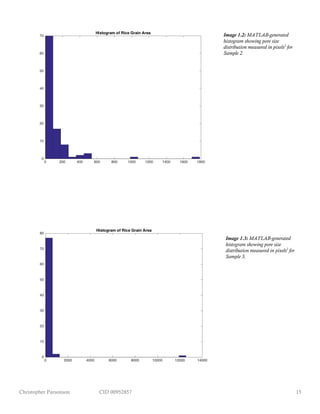
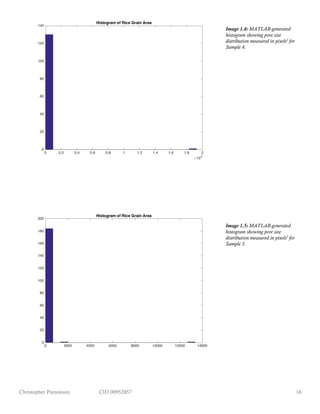
data. To begin with, the pore diameter distribution in Figure 8 will likely be somewhat inaccurate due to the presence of bright
light anomalies in Figure(s) 7 as a result of the light source used in stereomicroscopy. These bright patches will distort the
detection of pores by MATLAB, therefore affecting diameter measurements. As optical microscopy gave unclear images due to
the difficulties in focusing on a very porous material, a more accurate method to examine the microstructure and subsequently
the pore size and distribution of the compacts would be SEM, which (with its high-quality images) would be useful for image
analysis in MATLAB.
Furthermore, human error led to the time for each sample to be put in and removed from the furnace to vary, therefore
resulting in some samples to be foamed for longer than others. Additionally, having the furnace open before sintering to place
the glass compacts inside led to temperature drops, which subsequently took time for the desired 815 °C to be reached again
when the furnace was shut. This would have meant that although the quoted sintering times for the compacts were 5 and 7
minutes at 815 °C, in reality the time spent sintering at 815 °C would have been less.
Finally, the samples were left to dry for just a few hours after grinding (in the presence of water) before being reweighed. This
may not have given enough time for the water to drain completely, therefore the calculated green densities will have been
slightly higher than those of the actual glass powder compacts. A more effective drying method would have been to place the
samples back in the furnace at ≈100 °C, which would not have affected the soda-lime samples because it is much below any
transition temperature (see introduction), but would have evaporated the leftover water properly.
It is worth noting the failure of Sample X (100% 600-1,000 µm powder compact) in that it crumbled immediately when
removed from the mould. This was most likely due to the powder having a density of 2.52 Mg m-3
compared to that of water at
1 Mg m-3
. The larger the particles, the greater their masses and the harder it will be for water to aid in the formation of weak
bonds to hold the heavy structure together. Future experiments should take this into consideration and perhaps mitigate against
it by arranging the powder within the mould first before pouring water over the top to ensure that the water slowly drains
through the compact, forming as many bonds as it can before being absorbed at the base by the plasterboard [3]. Alternatively,
as outlined in the introduction of this report, including an acidic catalyst would attract the particles to oneanother; therefore its
addition should be considered when trying to keep the coarse powders from breaking apart.
By the end of the experiment, the sample with the lowest density was Sample 2 at 0.1841 g cm-3
, as is shown in Figure 6. Figure
6 also shows, however, that despite Sample 2 and Sample 3 being of the same composition (100% <200 µm powder) and having
been subjected to the same sintering conditions (815 °C for 7 minutes), their densities at 0.1841 g cm-3
and 0.2915 g cm-3
respectively differed by ≈60%. This inconsistency is verified by Table 4, which shows that after further heating of parts taken
from bulk Sample 2 and Sample 3, Sample 3 (renamed Sample 3.1) instead now has a lower density than Sample 2 (renamed Sample
2.1). The most likely reason for this is that there is a variation in density throughout the whole glass compact sample, therefore
if one part of the sample is broken off, ground and measured, it will likely have a different density from another part. This
variation in density may be due to different amounts of foaming occurring throughout various sections of the material. Indeed,
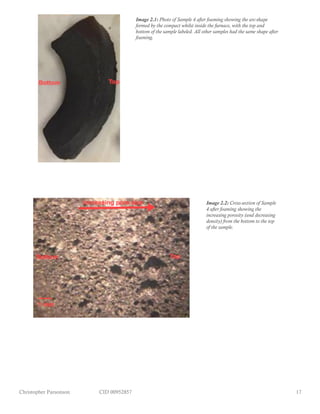
if the block-like samples in Figure(s) 5 (before foaming) are compared to the arc-like sample in Image 2.1 (which all samples
appeared like after foaming; see appendix), it is clear that the shape has changed considerably, suggesting a greater degree of
foaming at the centre/top of the sample than at the edges/bottom. A cross-section of this is shown in Image 2.2 (see appendix),
which (as marked) shows a clear variation in porosity (and therefore density) from top to bottom. One explanation for this is
that when the samples were slip-cast, the water would be drawn by gravity to the base of the sample where it would slowly be
absorbed. The greater time over which water was present at the bottom of the sample relative to the top may have allowed for
more bonds to form, therefore making the pore walls more difficult for gas bubbles to pierce during foaming and thus leading to
smaller pores (and therefore a higher density). Alternatively, the ceramic pot used to hold the compacts during foaming may
have acted as an insulator and taken a longer time to heat up, therefore the top of the sample that was not in contact with the
pot could have been heated to a higher temperature than the bottom and therefore have undergone a greater degree of foaming,
thus giving the top of the sample a lower density.
Table 5 shows that Sample 2 (lower density) absorbed significantly more water than Sample 3, with its mass increase being
more than three times that of the latter. This suggests that Sample 2 had more pierced open pores and open channels through
which water may be absorbed, and that Sample 3 contained more closed pores. This confirms the theory outlined in the
introduction that an open-pore network will lead to a lower density glass.](https://image.slidesharecdn.com/736f8379-bbed-49f0-86a2-fe3fa5e3d3b7-161018135028/85/Foamed-Glass-Extended-Lab-Report-12-320.jpg)
![Christopher Parsonson CID 00952857 13
Figure 8 is interesting in that it contradicts the unconfirmed prediction made in the introduction of this report that compacts
made of smaller powders will have a lower pore size but a greater frequency than those made of larger powders, with Sample 2
and Sample 3 (made of the finest powders) containing the least number of pores of all the samples. This could be due to the
particles of the smaller-powder samples being stacked closer together (see Figure 3) and therefore having a greater bond strength,
which would make it more difficult for piercing to occur. Alternatively, the close stacking could have allowed less water to be
present within the structure after casting, therefore leaving fewer pores when dried. A lower pore frequency would, however,
undermine the conclusion drawn from Figure 6 that the small powder samples underwent more foaming which led to a lower
density, therefore a perhaps more likely explanation is that the previously outlined poor quality images of Figure(s) 7 resulted in
inaccurate calculations made by MATLAB, reaffirming that SEM images should be taken for future experiments.
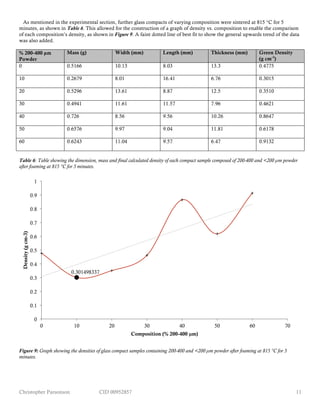
Figure 9 shows as the fraction of larger particles increases within a compact that is formed mainly by smaller particles, that the
density will also increase. What is interesting is that the lowest density (0.301 g cm-3
) occurs with a mixture made of 10% 200-
400 µm and 90% <200 µm powder, rather than the 100% <200 µm (which, when sintered at 815 °C for 5 minutes, had a density
of 0.478 g cm-3
) as was found to be the case for glass sintered at 815 °C for 7 minutes (in which the lowest density achieved was
0.184 g cm-3
, as shown in Figure 6). This might suggest that small powders take a longer time to foam, which would be logical
as they initially have the highest density due to their stacking (see Figure 3), and therefore need a greater reduction in density
than larger powder samples. Alternatively, this result could be because the prediction made in the introduction that mixed
powders may undergo the greatest amount of foaming is correct. Ultimately, a certain conclusion is difficult to draw due to the
previously established uncertainty in there being a varying density throughout a single compact. In order for the sample with
truly the lowest density to be found, a future experiment that uses more samples to increase reliability and decrease the
uncertainty that results due to density variation should be carried out.
As well as what has been discussed, there are a few further points that could be made to improve future experiments looking
into the effect of glass compact powder size on the foaming process. One limitation in this report was that there was a finite
amount of <200 µm that was used by the group very quickly and therefore the number of samples used was not high enough to
gain reliable data. Future attempts should ensure that there is a necessary quantity of powder available and aim to make more
samples to make more reliable conclusions. If later experiments establish that a lower powder size gives a lower density (as it
was in Figure 3), it would be interesting to see if mixing in larger powders improves the mechanical properties by introducing
strains in the structure, as is the technique in creating high-strength gorilla glass [1].
Conclusion
In conclusion, this experiment has demonstrated how the sintering process in glass production can be used to foam glass
compacts into very low-density materials. It was found that altering the particle size within the compact changed the final
density in that the smaller the powder diameter, the lower the density, with the sample made of only the finest <200 µm having
the lowest density at 0.184 g cm-3
. However, it was also found that the density of the compacts varied throughout their
structure, possibly due to the heating inconsistencies in the furnace, the water draining mechanism during slip casting or simply
the experimental error. It was therefore decided that adjustments to the experiment should be made and that more samples
should be tested to allow for a more reliable conclusion to be drawn. Overall, the aims laid out in the abstract section of this
report of varying particle size within a glass powder compact to examine the optimum variation needed for the lowest possible
density glass to be produced were achieved, and to this extent this has been a successful experiment.](https://image.slidesharecdn.com/736f8379-bbed-49f0-86a2-fe3fa5e3d3b7-161018135028/85/Foamed-Glass-Extended-Lab-Report-13-320.jpg)