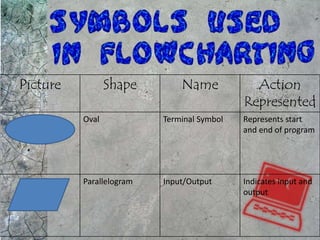
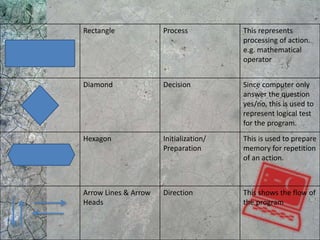
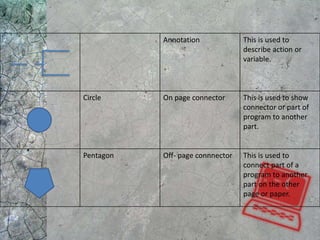
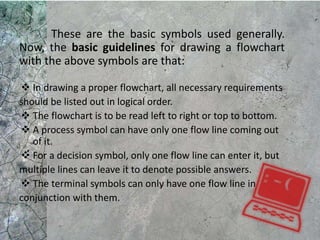
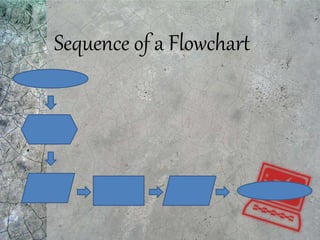
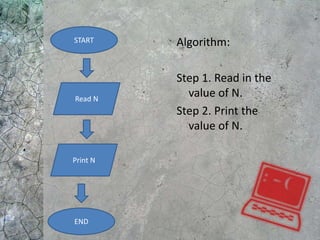
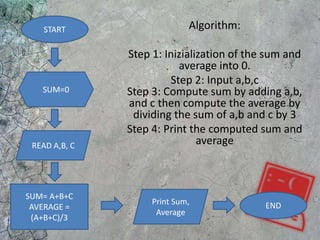
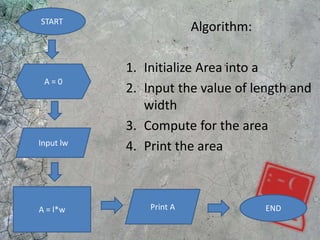
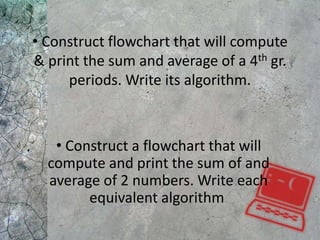
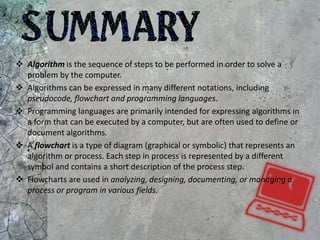
Zeinna Belle C. Desamito
Melissa Mae B. Ibarra
9-SSC-Lavoisier
and
A computer is a useful tool for solving a
great variety of problems. To make a computer
do anything, you have to write a computer
program. In a computer you tell a computer,
step by step, exactly what you want it do. The
computer then executes the program, following
each step mechanically, to accomplish the end
goal.
Look around you. Computers and networks are
everywhere. In mathematics and computer science an
algorithm is a finite sequence of step expressed for
solving a problem. An algorithm can be defined as “a
process that performs some sequence of operation in
order to solve a given problem”. Algorithms are used for
calculation, data processing and many other fields. A
good algorithm is like using the right tool in the
workshop. It does the job with the right amount of
effort.
Algorithms can be expressed in many different notations,
including pseudocode, flowchart and programming languages.
Pseudocode and flowcharts are structured ways to express
algorithms. Programming languages are primarily intended for
expressing algorithms in a form that can be executed by a computer,
but are often used to define or document algorithms. Sometimes it is
helpful in the description of an algorithm to supplement small
flowcharts with natural language and/or arithmetic expressions
written inside block diagrams to summarize what the flowcharts are
accomplishing.
The use of algorithm provides a number of
benefits. By using an algorithm, decision making
becomes more rational. Problems that would be
difficult to solve in entirely can be answered easily
as small series. An algorithm serves as a mnemonic
device and helps ensure that variables or parts of
the problem are not ignored.
A flowchart is a type of diagram (graphical or symbolic) that
represents an algorithm or process. Each step in process is
represented by a different symbol and contains a short description
of the process step.
A flowchart describes what operations are required to solve
a given problem.
Flowcharts are used in analyzing, designing, documenting,
or managing a process or program in various fields.
To communicate with others how a process is done.
A flowchart is generally used when a new project begins in
order to plan for the project.
A flowchart helps to clarify how things are currently
working
and how they could be improved.
Flowcharts also uncover steps that are redundant or
misplaced.
Picture Shape Name Action
Represented
Oval Terminal Symbol Represents start
and end of program
Parallelogram Input/Output Indicates input and
output
Rectangle Process This represents
processing of action.
e.g. mathematical
operator
Diamond Decision Since computer only
answer the question
yes/no, this is used to
represent logical test
for the program.
Hexagon Initialization/
Preparation
This is used to prepare
memory for repetition
of an action.
Arrow Lines & Arrow
Heads
Direction This shows the flow of
the program
Annotation This is used to
describe action or
variable.
Circle On page connector This is used to show
connector or part of
program to another
part.
Pentagon Off- page connnector This is used to
connect part of a
program to another
part on the other
page or paper.
These are the basic symbols used generally.
Now, the basic guidelines for drawing a flowchart
with the above symbols are that:
 In drawing a proper flowchart, all necessary requirements
should be listed out in logical order.
 The flowchart is to be read left to right or top to bottom.
 A process symbol can have only one flow line coming out
of it.
 For a decision symbol, only one flow line can enter it, but
multiple lines can leave it to denote possible answers.
 The terminal symbols can only have one flow line in
conjunction with them.
Sequence of a Flowchart
• Design a flowchart that will accept and
display a number. Write its equivalent
algorithms.
Algorithm:
Step 1. Read in the
value of N.
Step 2. Print the
value of N.
START
Read N
Print N
END
• Construct a flowchart that will compute and
print the sum of and average of 3 numbers.
Write each equivalent algorithm.
Algorithm:
Step 1: Inizialization of the sum and
average into 0.
Step 2: Input a,b,c
Step 3: Compute sum by adding a,b,
and c then compute the average by
dividing the sum of a,b and c by 3
Step 4: Print the computed sum and
average
START
SUM=0
READ A,B, C
Print Sum,
Average
END
SUM= A+B+C
AVERAGE =
(A+B+C)/3
•Draw a flowchart that computes and
prints the area of a rectangle. Write each
equivalent algorithm.
Algorithm:
1. Initialize Area into a
2. Input the value of length and
width
3. Compute for the area
4. Print the area
START
A = 0
Input lw
A = l*w Print A END
• Construct flowchart that will compute
& print the sum and average of a 4th gr.
periods. Write its algorithm.
• Construct a flowchart that will
compute and print the sum of and
average of 2 numbers. Write each
equivalent algorithm.
 Algorithm is the sequence of steps to be performed in order to solve a
problem by the computer.
 Algorithms can be expressed in many different notations, including
pseudocode, flowchart and programming languages.
 Programming languages are primarily intended for expressing algorithms in
a form that can be executed by a computer, but are often used to define or
document algorithms.
 A flowchart is a type of diagram (graphical or symbolic) that represents an
algorithm or process. Each step in process is represented by a different
symbol and contains a short description of the process step.
 Flowcharts are used in analyzing, designing, documenting, or managing a
process or program in various fields.
Flowcharting and Algorithm

Flowcharting and Algorithm

  • 1.
    Zeinna Belle C.Desamito Melissa Mae B. Ibarra 9-SSC-Lavoisier and
  • 2.
    A computer isa useful tool for solving a great variety of problems. To make a computer do anything, you have to write a computer program. In a computer you tell a computer, step by step, exactly what you want it do. The computer then executes the program, following each step mechanically, to accomplish the end goal.
  • 3.
    Look around you.Computers and networks are everywhere. In mathematics and computer science an algorithm is a finite sequence of step expressed for solving a problem. An algorithm can be defined as “a process that performs some sequence of operation in order to solve a given problem”. Algorithms are used for calculation, data processing and many other fields. A good algorithm is like using the right tool in the workshop. It does the job with the right amount of effort.
  • 4.
    Algorithms can beexpressed in many different notations, including pseudocode, flowchart and programming languages. Pseudocode and flowcharts are structured ways to express algorithms. Programming languages are primarily intended for expressing algorithms in a form that can be executed by a computer, but are often used to define or document algorithms. Sometimes it is helpful in the description of an algorithm to supplement small flowcharts with natural language and/or arithmetic expressions written inside block diagrams to summarize what the flowcharts are accomplishing.
  • 5.
    The use ofalgorithm provides a number of benefits. By using an algorithm, decision making becomes more rational. Problems that would be difficult to solve in entirely can be answered easily as small series. An algorithm serves as a mnemonic device and helps ensure that variables or parts of the problem are not ignored.
  • 6.
    A flowchart isa type of diagram (graphical or symbolic) that represents an algorithm or process. Each step in process is represented by a different symbol and contains a short description of the process step. A flowchart describes what operations are required to solve a given problem. Flowcharts are used in analyzing, designing, documenting, or managing a process or program in various fields.
  • 7.
    To communicate withothers how a process is done. A flowchart is generally used when a new project begins in order to plan for the project. A flowchart helps to clarify how things are currently working and how they could be improved. Flowcharts also uncover steps that are redundant or misplaced.
  • 8.
    Picture Shape NameAction Represented Oval Terminal Symbol Represents start and end of program Parallelogram Input/Output Indicates input and output
  • 9.
    Rectangle Process Thisrepresents processing of action. e.g. mathematical operator Diamond Decision Since computer only answer the question yes/no, this is used to represent logical test for the program. Hexagon Initialization/ Preparation This is used to prepare memory for repetition of an action. Arrow Lines & Arrow Heads Direction This shows the flow of the program
  • 10.
    Annotation This isused to describe action or variable. Circle On page connector This is used to show connector or part of program to another part. Pentagon Off- page connnector This is used to connect part of a program to another part on the other page or paper.
  • 11.
    These are thebasic symbols used generally. Now, the basic guidelines for drawing a flowchart with the above symbols are that:  In drawing a proper flowchart, all necessary requirements should be listed out in logical order.  The flowchart is to be read left to right or top to bottom.  A process symbol can have only one flow line coming out of it.  For a decision symbol, only one flow line can enter it, but multiple lines can leave it to denote possible answers.  The terminal symbols can only have one flow line in conjunction with them.
  • 12.
    Sequence of aFlowchart
  • 14.
    • Design aflowchart that will accept and display a number. Write its equivalent algorithms.
  • 15.
    Algorithm: Step 1. Readin the value of N. Step 2. Print the value of N. START Read N Print N END
  • 16.
    • Construct aflowchart that will compute and print the sum of and average of 3 numbers. Write each equivalent algorithm.
  • 17.
    Algorithm: Step 1: Inizializationof the sum and average into 0. Step 2: Input a,b,c Step 3: Compute sum by adding a,b, and c then compute the average by dividing the sum of a,b and c by 3 Step 4: Print the computed sum and average START SUM=0 READ A,B, C Print Sum, Average END SUM= A+B+C AVERAGE = (A+B+C)/3
  • 18.
    •Draw a flowchartthat computes and prints the area of a rectangle. Write each equivalent algorithm.
  • 19.
    Algorithm: 1. Initialize Areainto a 2. Input the value of length and width 3. Compute for the area 4. Print the area START A = 0 Input lw A = l*w Print A END
  • 21.
    • Construct flowchartthat will compute & print the sum and average of a 4th gr. periods. Write its algorithm. • Construct a flowchart that will compute and print the sum of and average of 2 numbers. Write each equivalent algorithm.
  • 22.
     Algorithm isthe sequence of steps to be performed in order to solve a problem by the computer.  Algorithms can be expressed in many different notations, including pseudocode, flowchart and programming languages.  Programming languages are primarily intended for expressing algorithms in a form that can be executed by a computer, but are often used to define or document algorithms.  A flowchart is a type of diagram (graphical or symbolic) that represents an algorithm or process. Each step in process is represented by a different symbol and contains a short description of the process step.  Flowcharts are used in analyzing, designing, documenting, or managing a process or program in various fields.