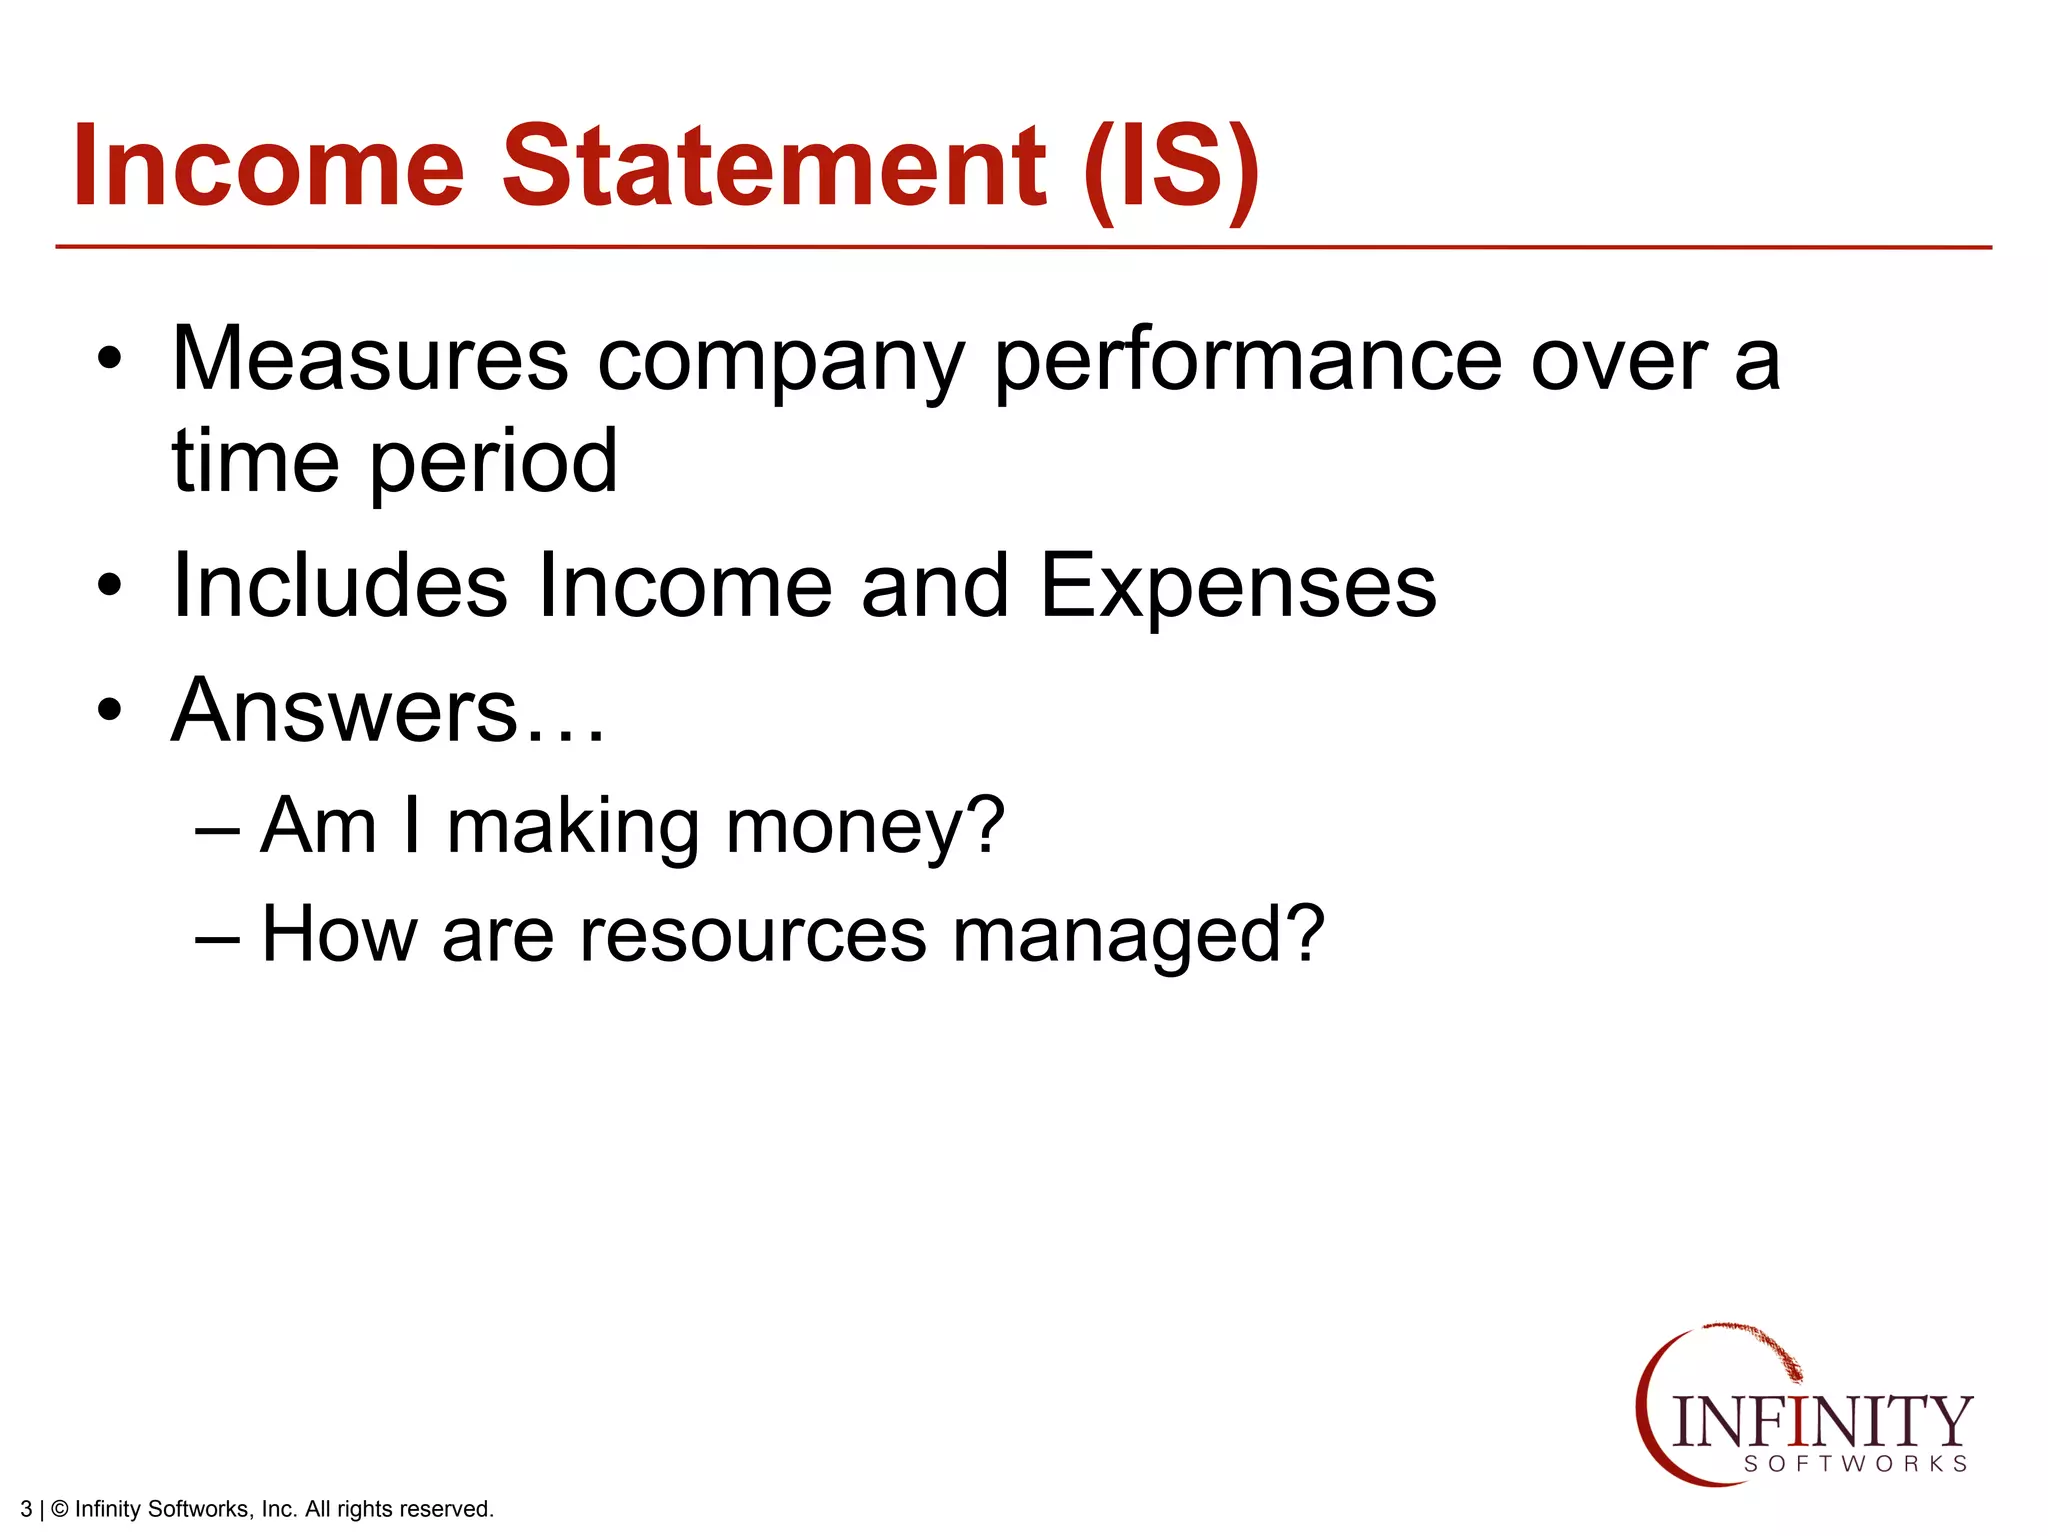
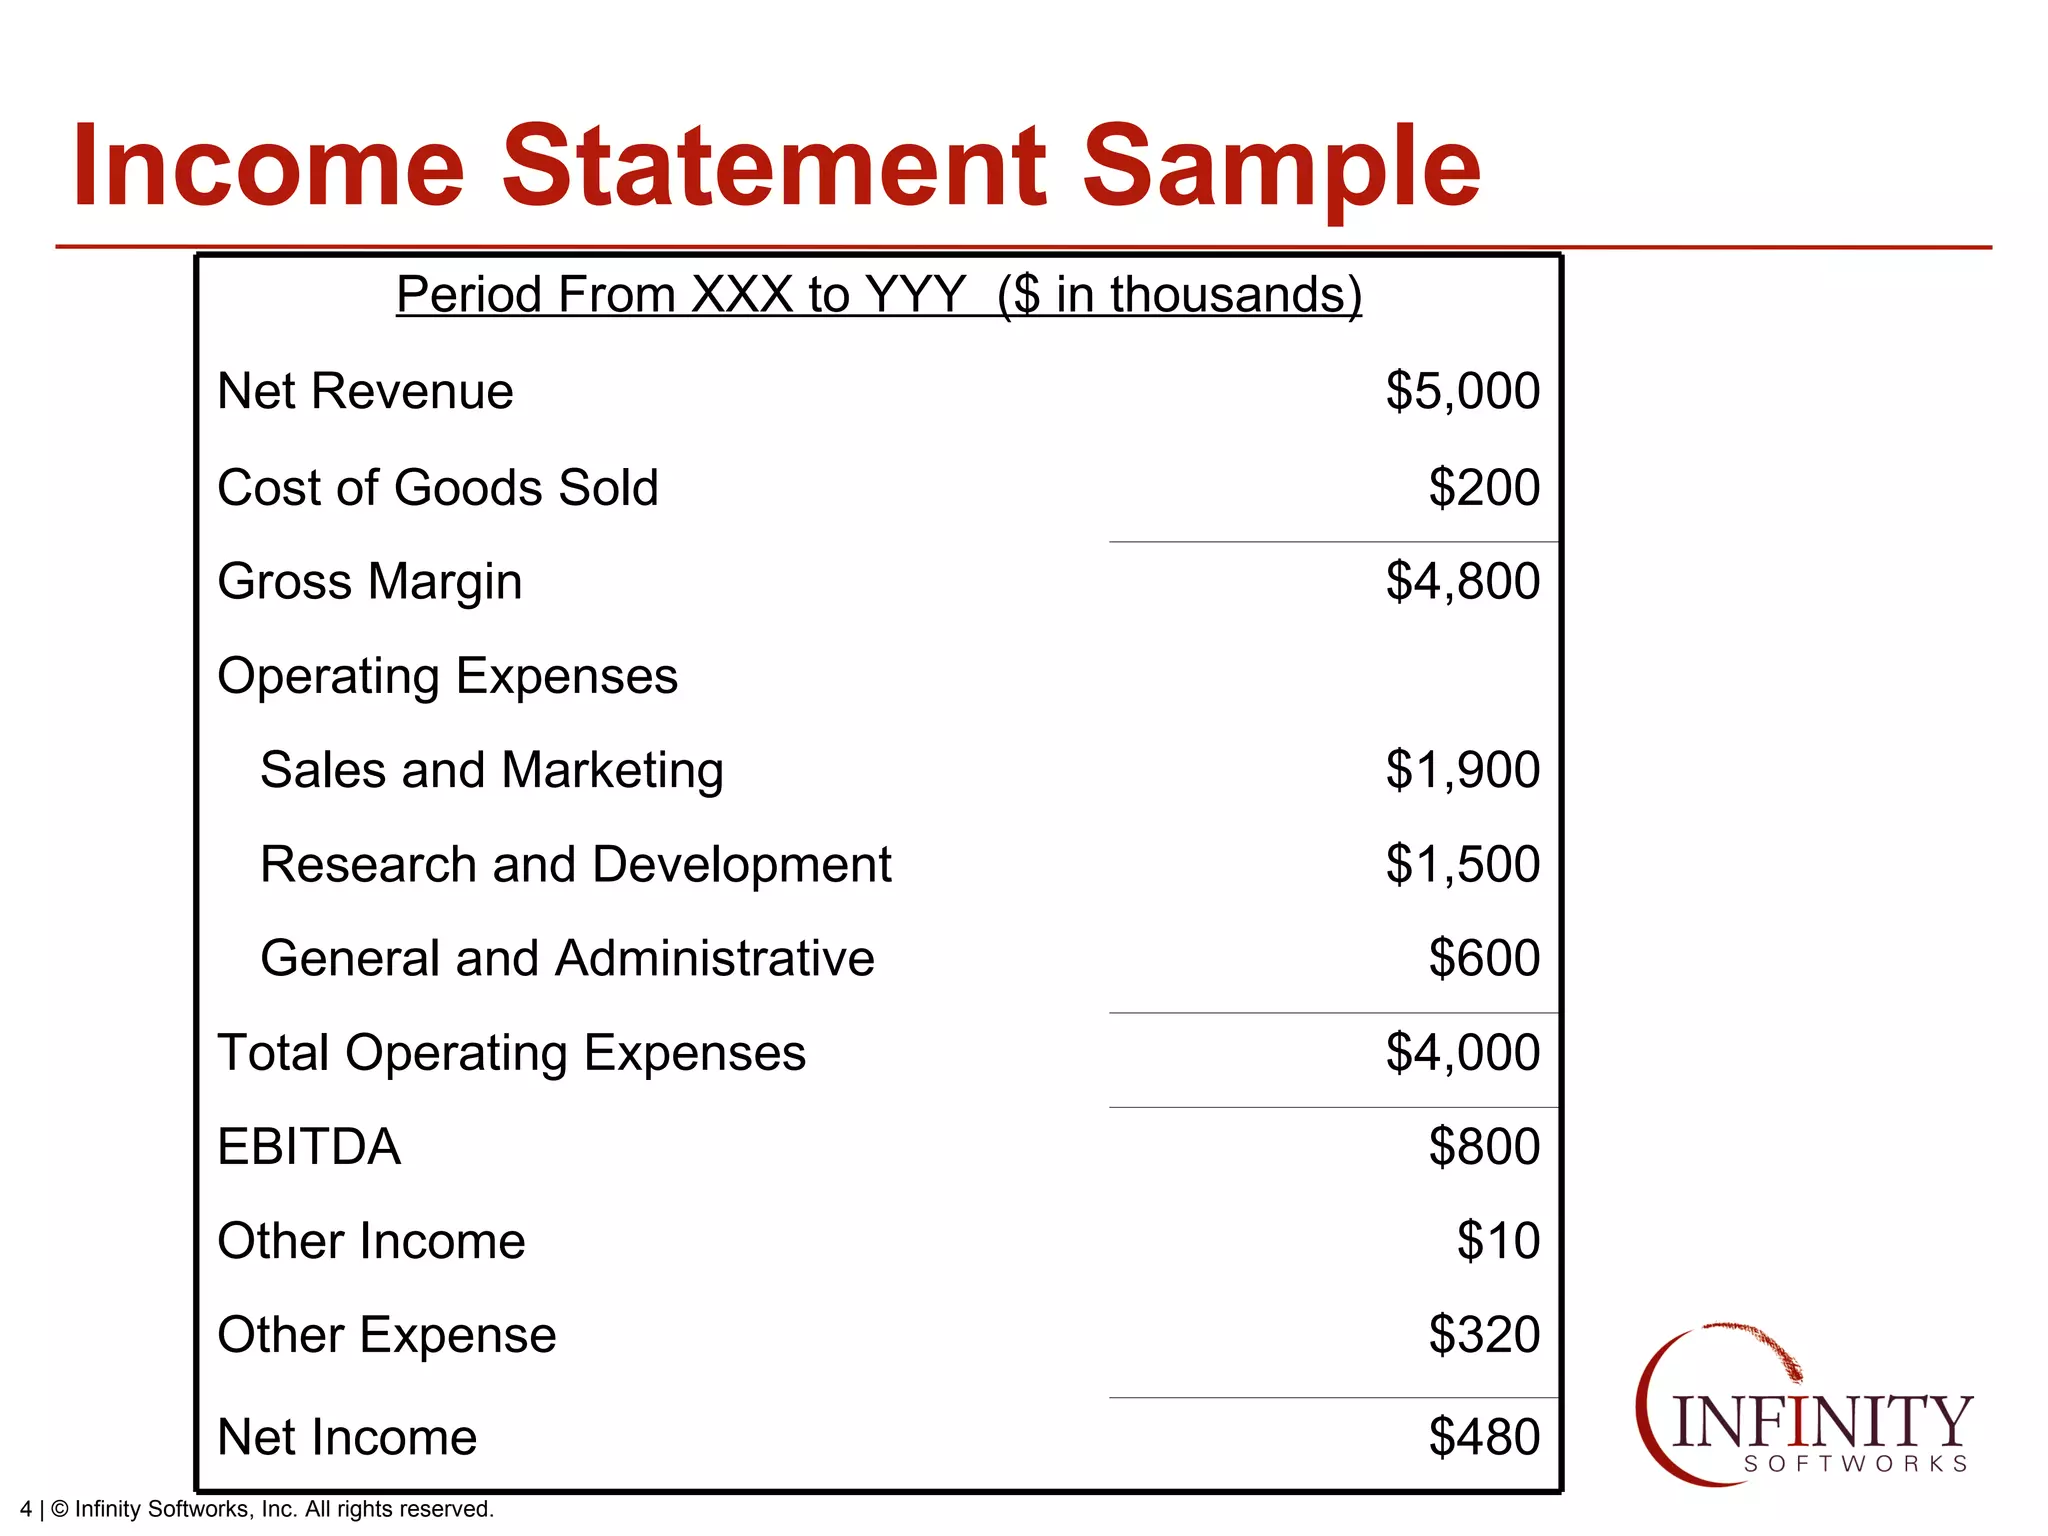
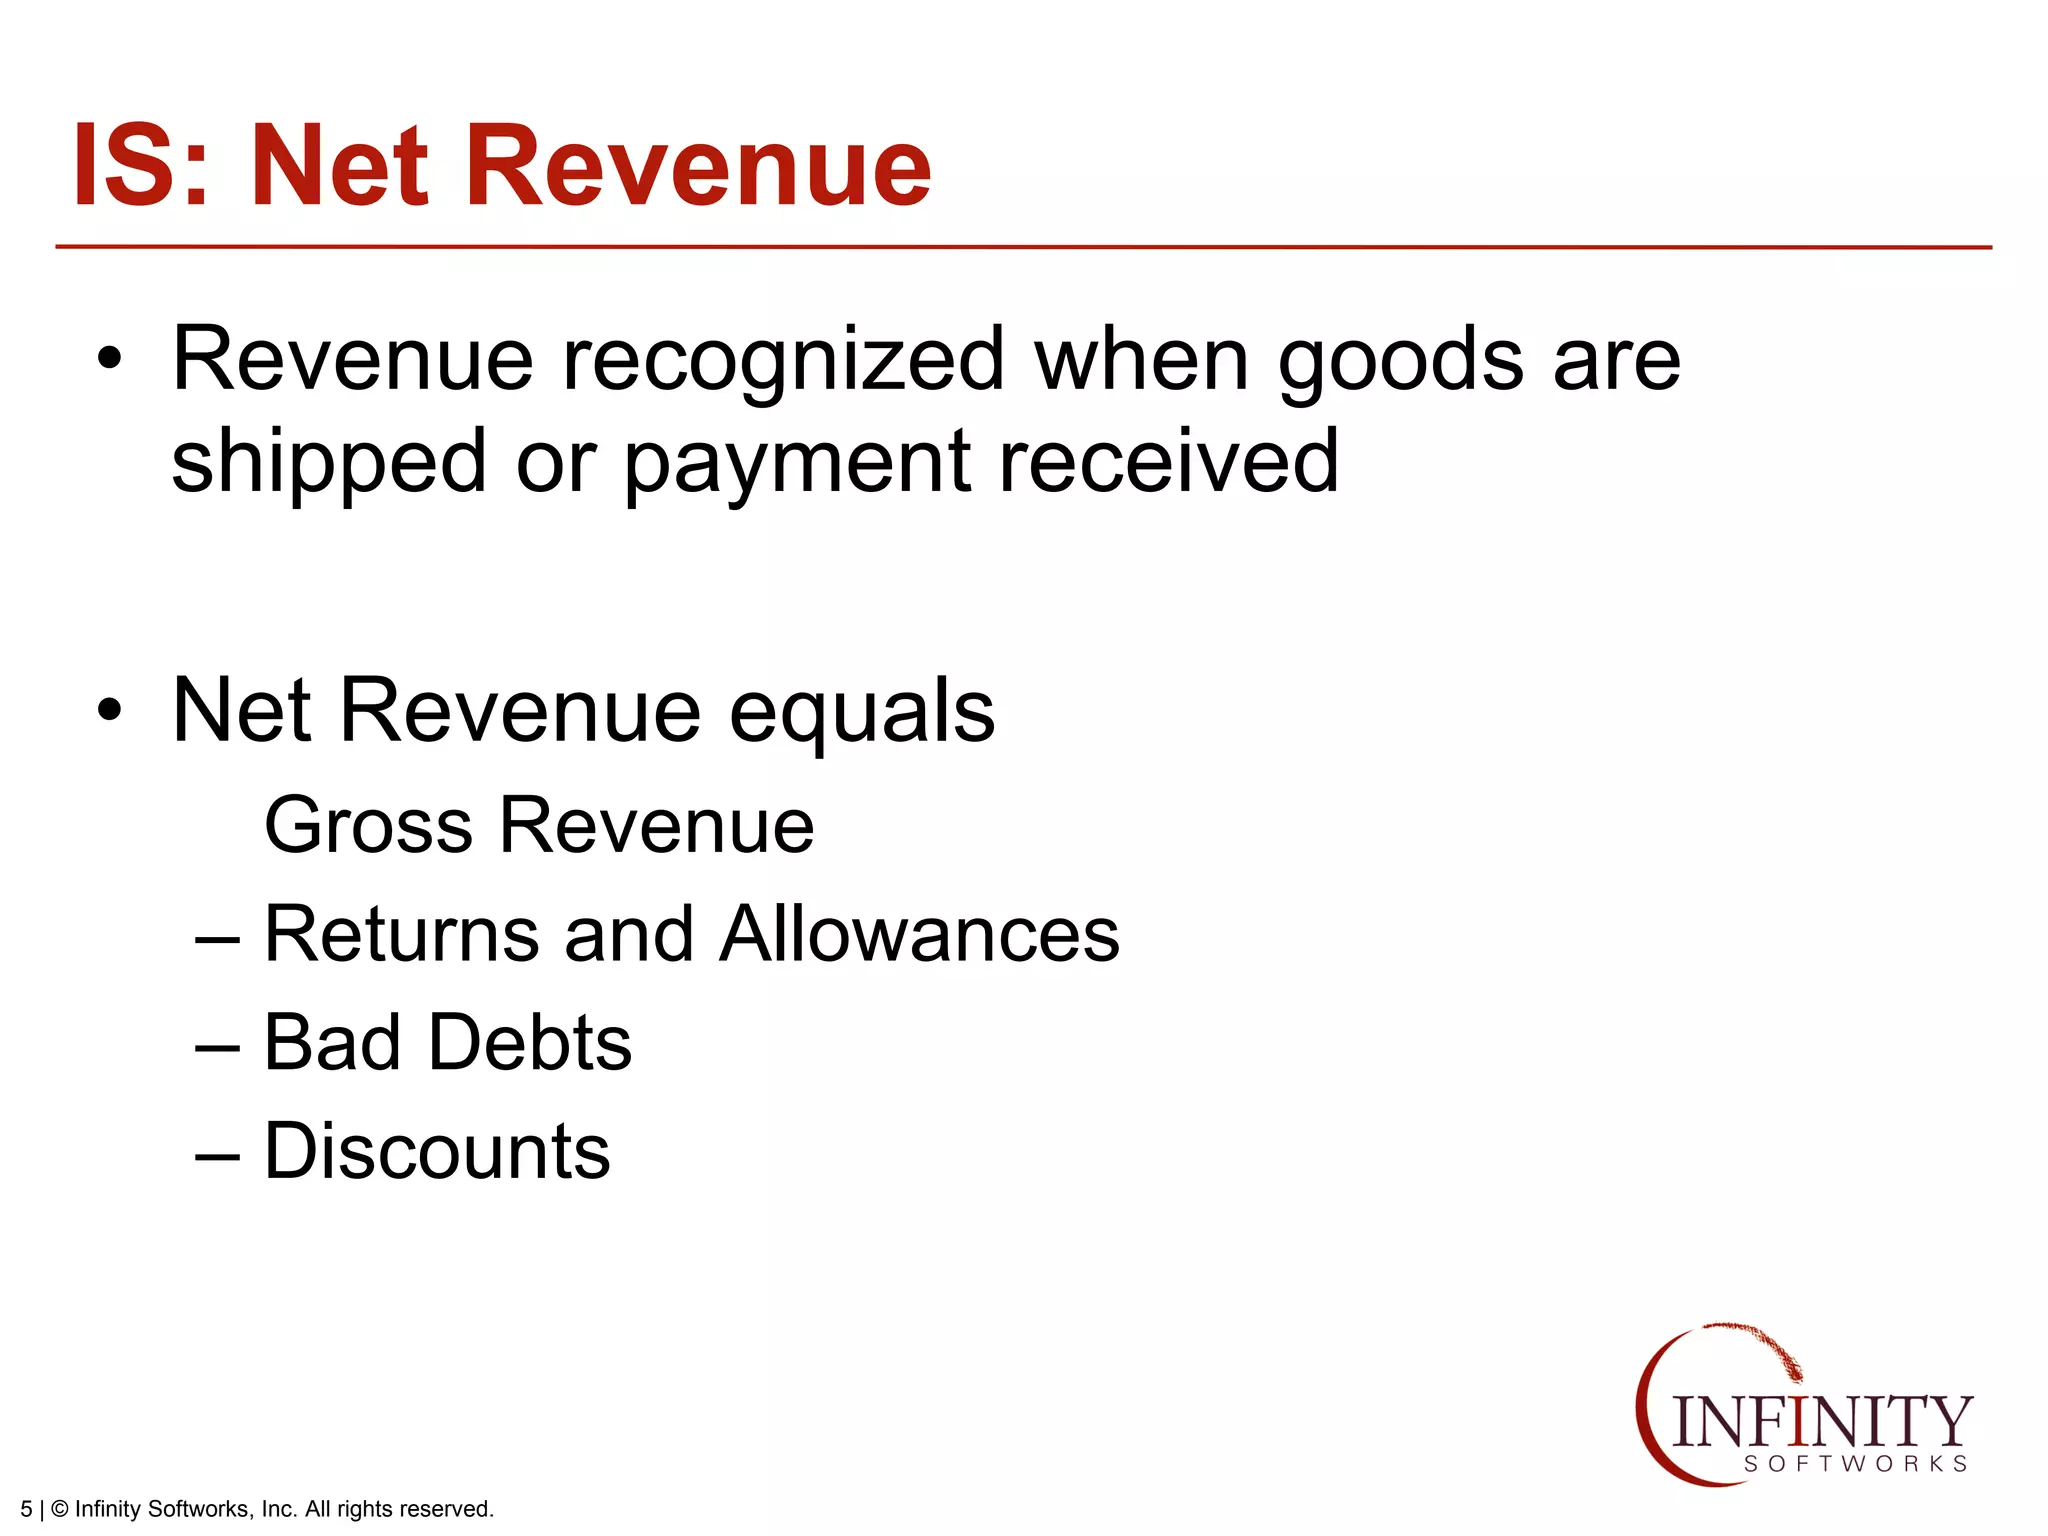
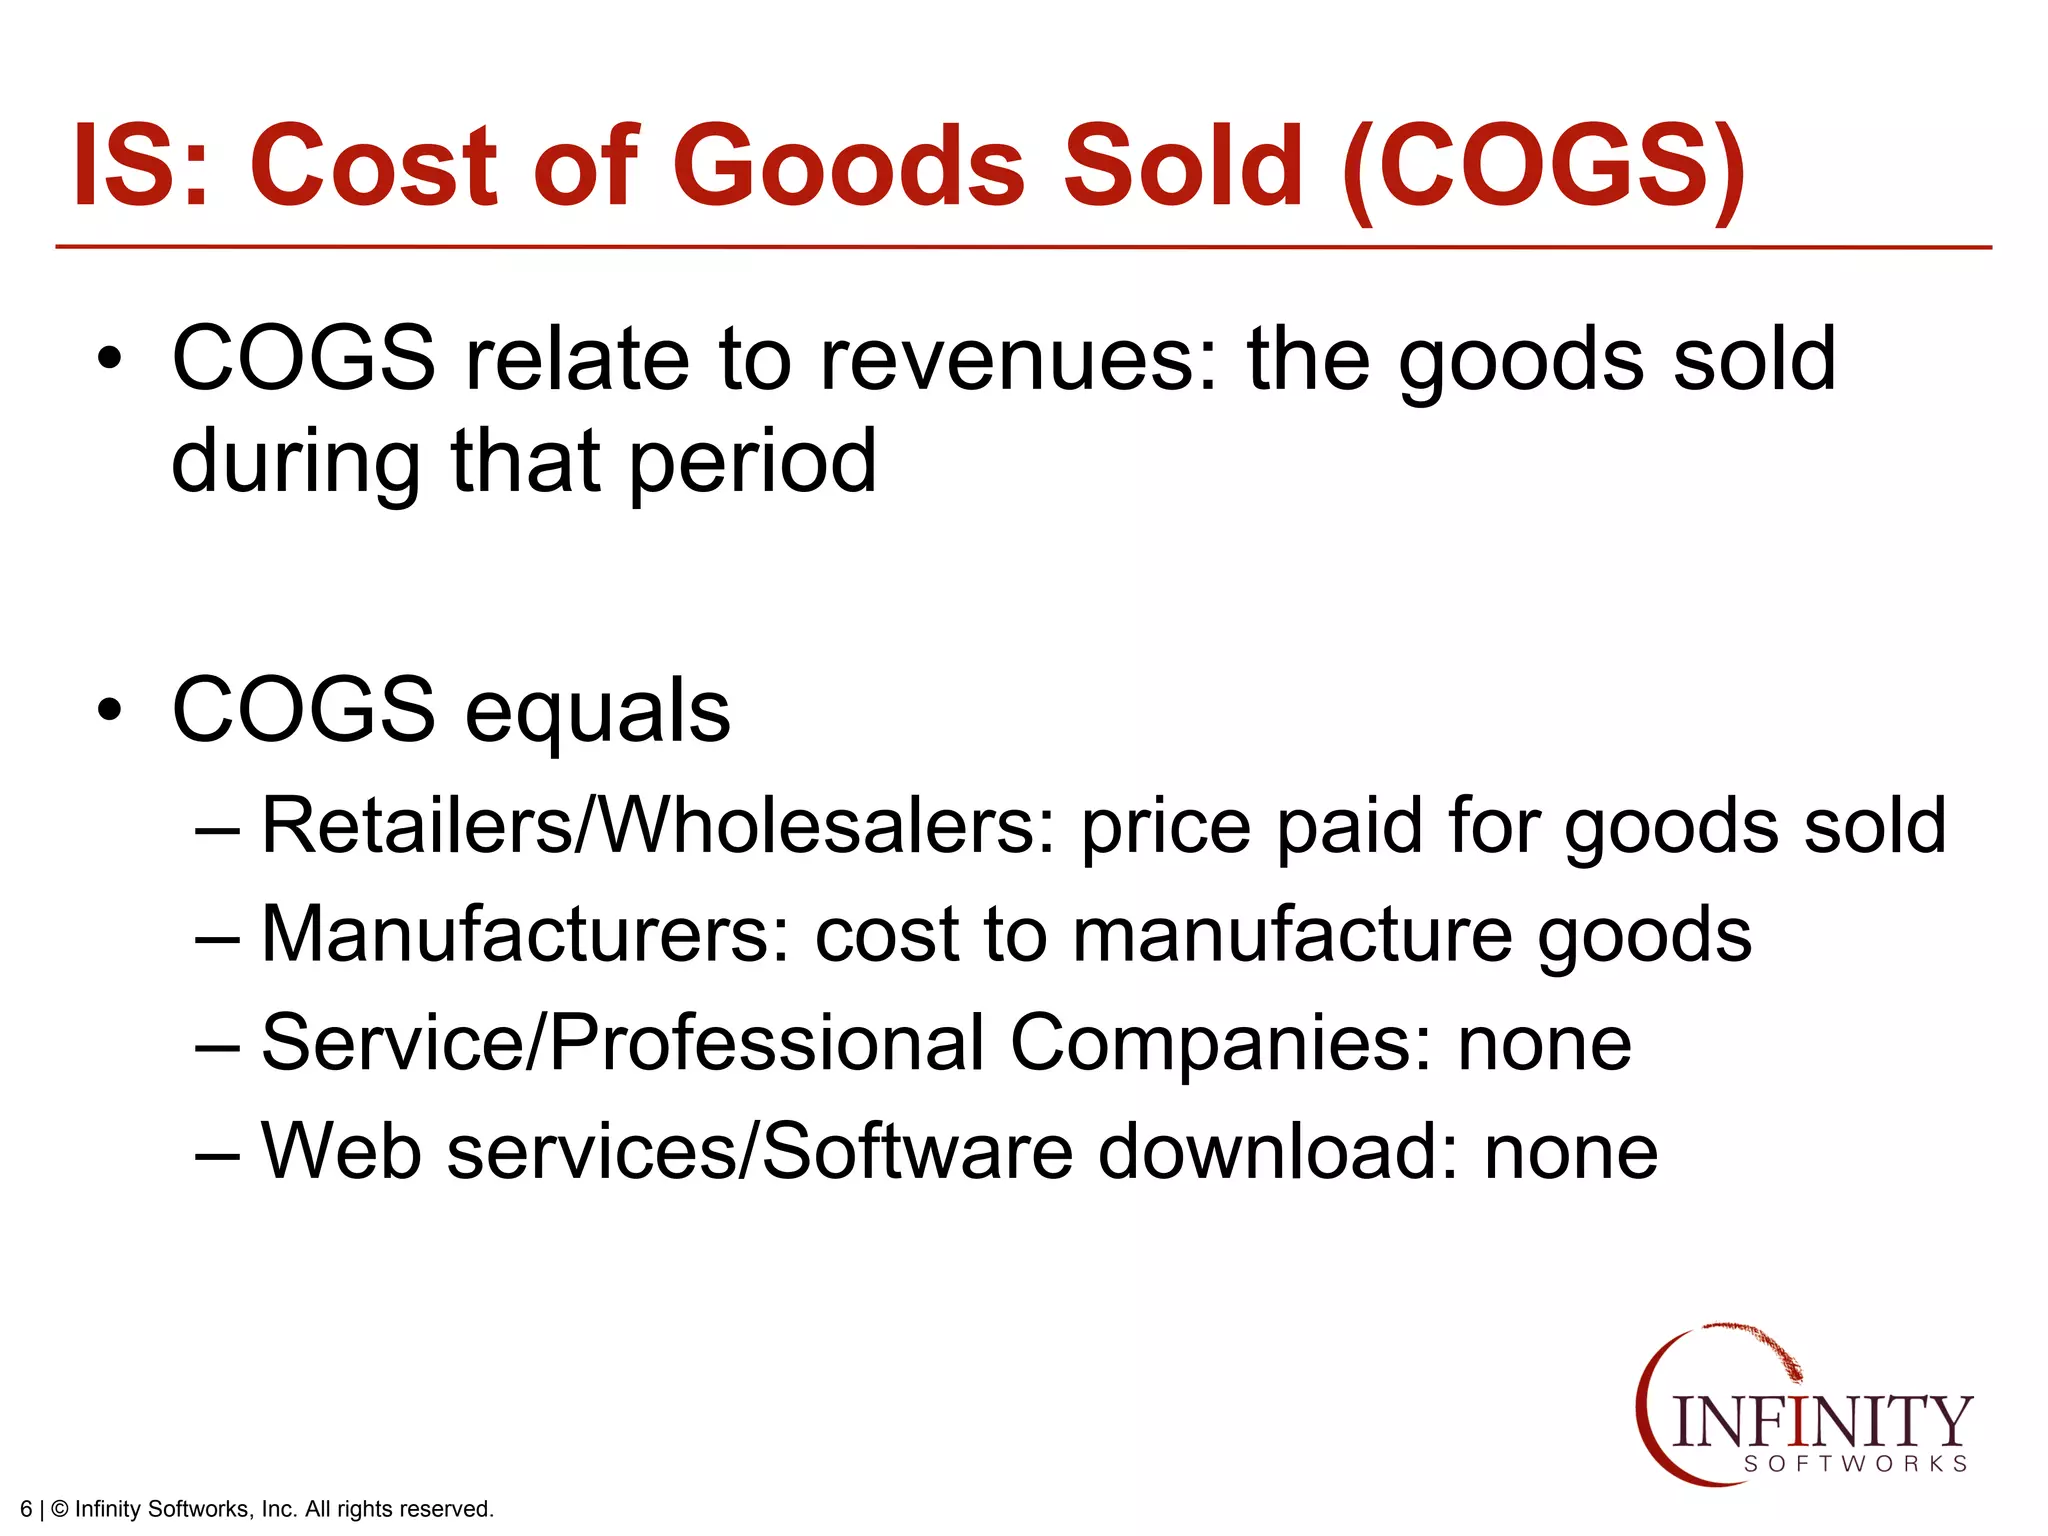
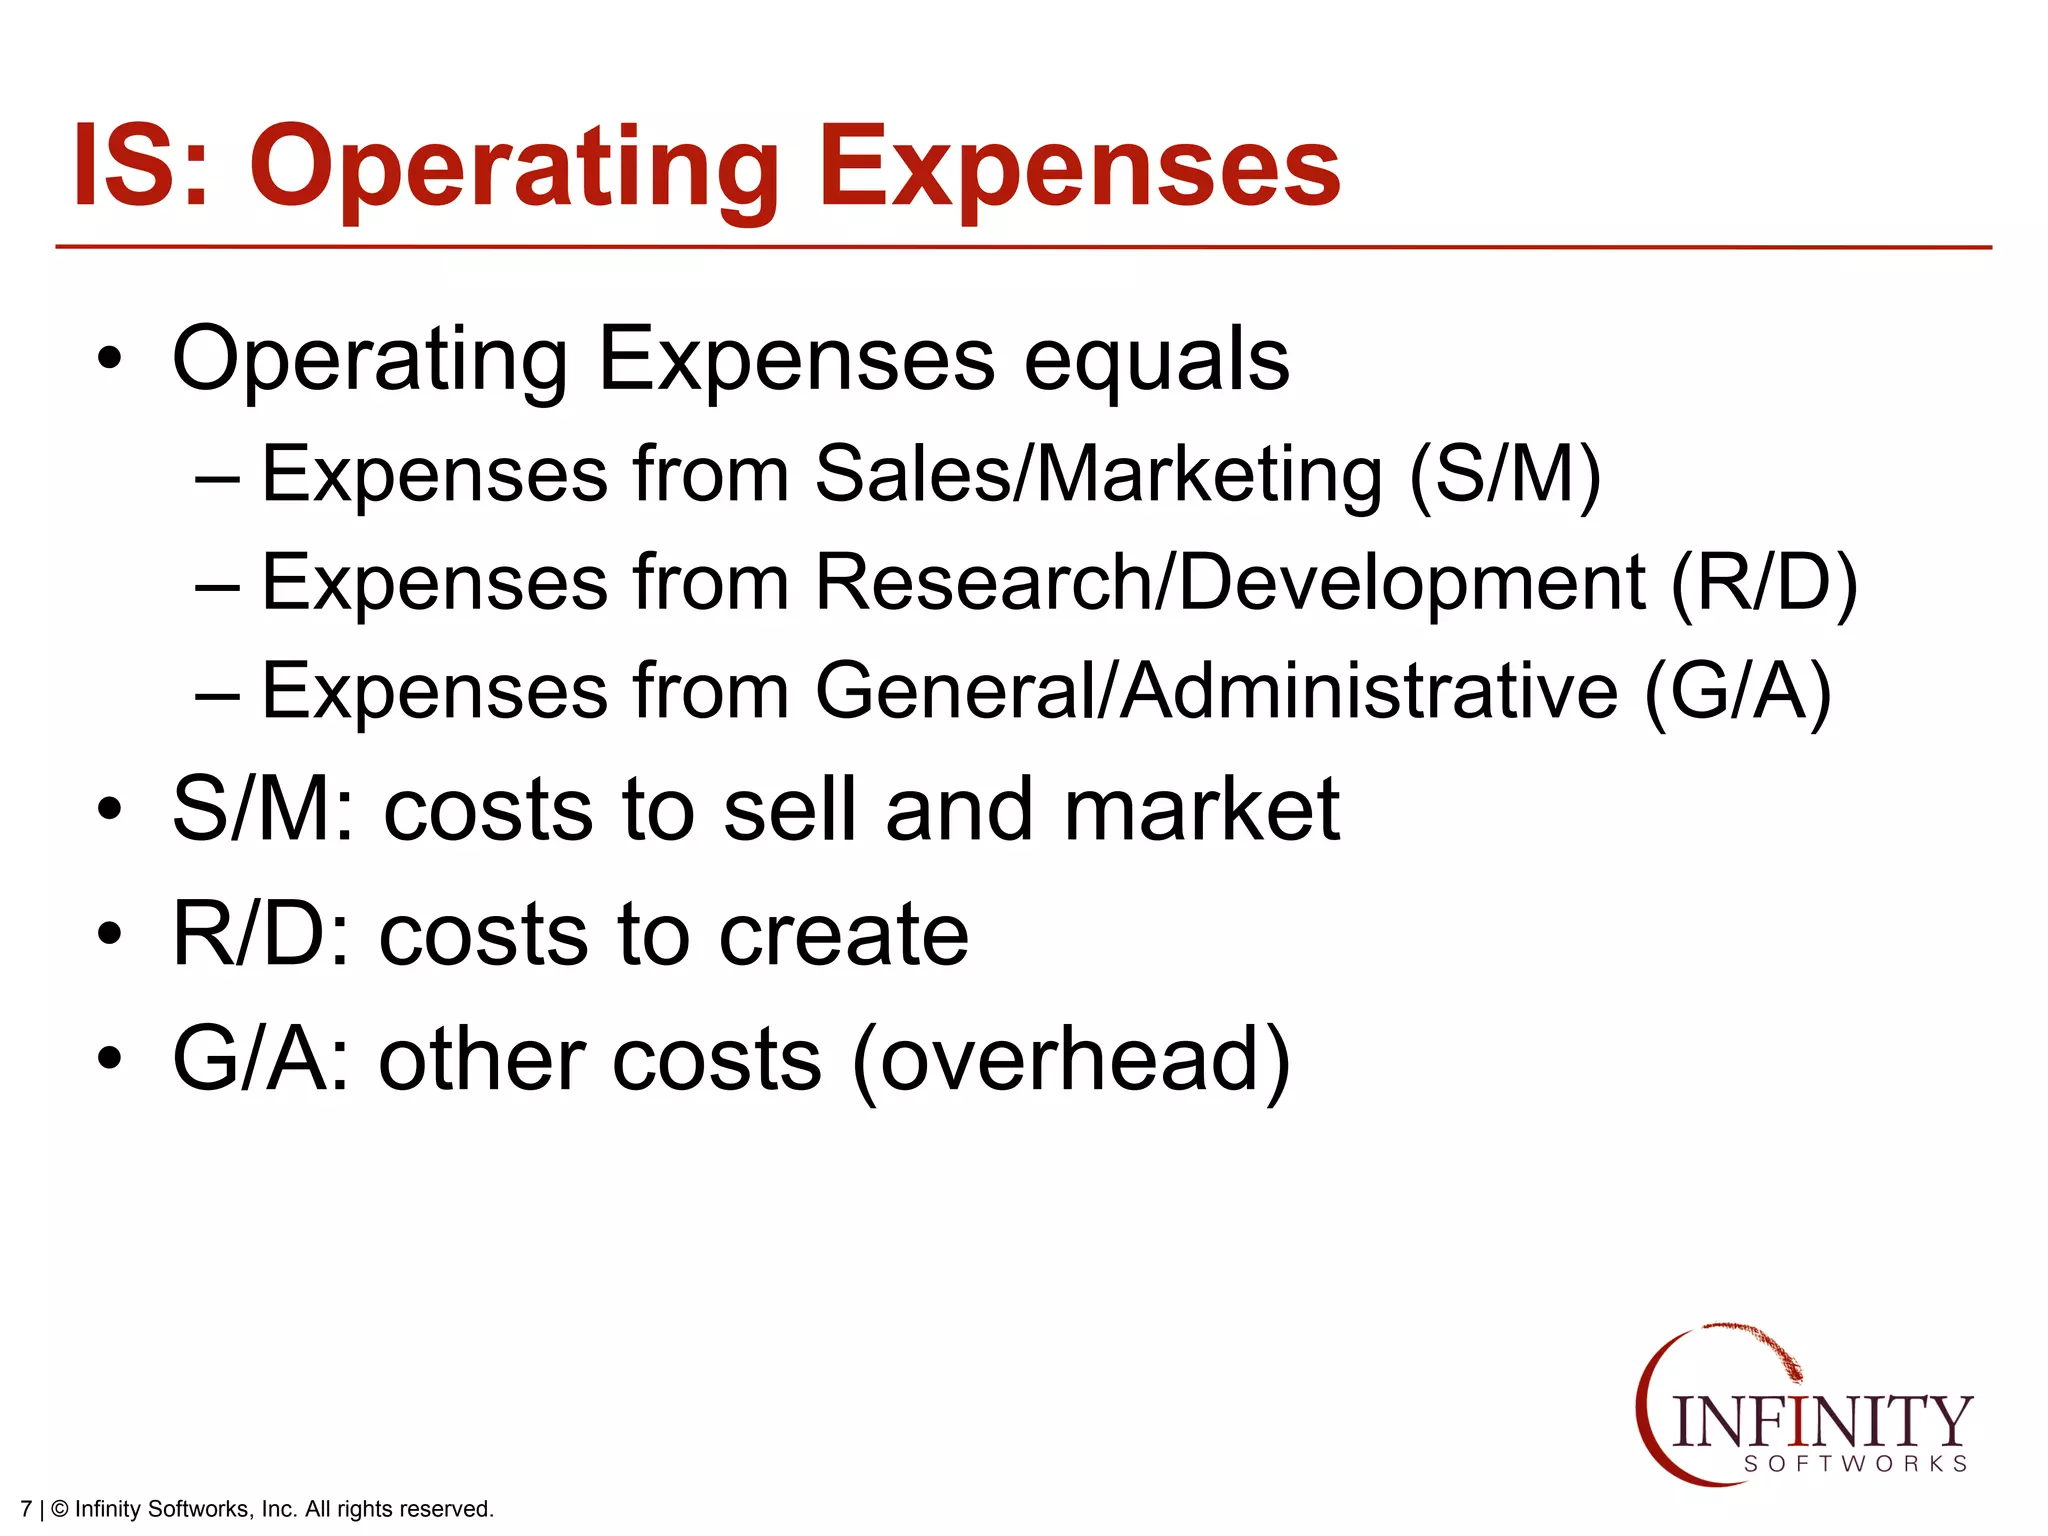
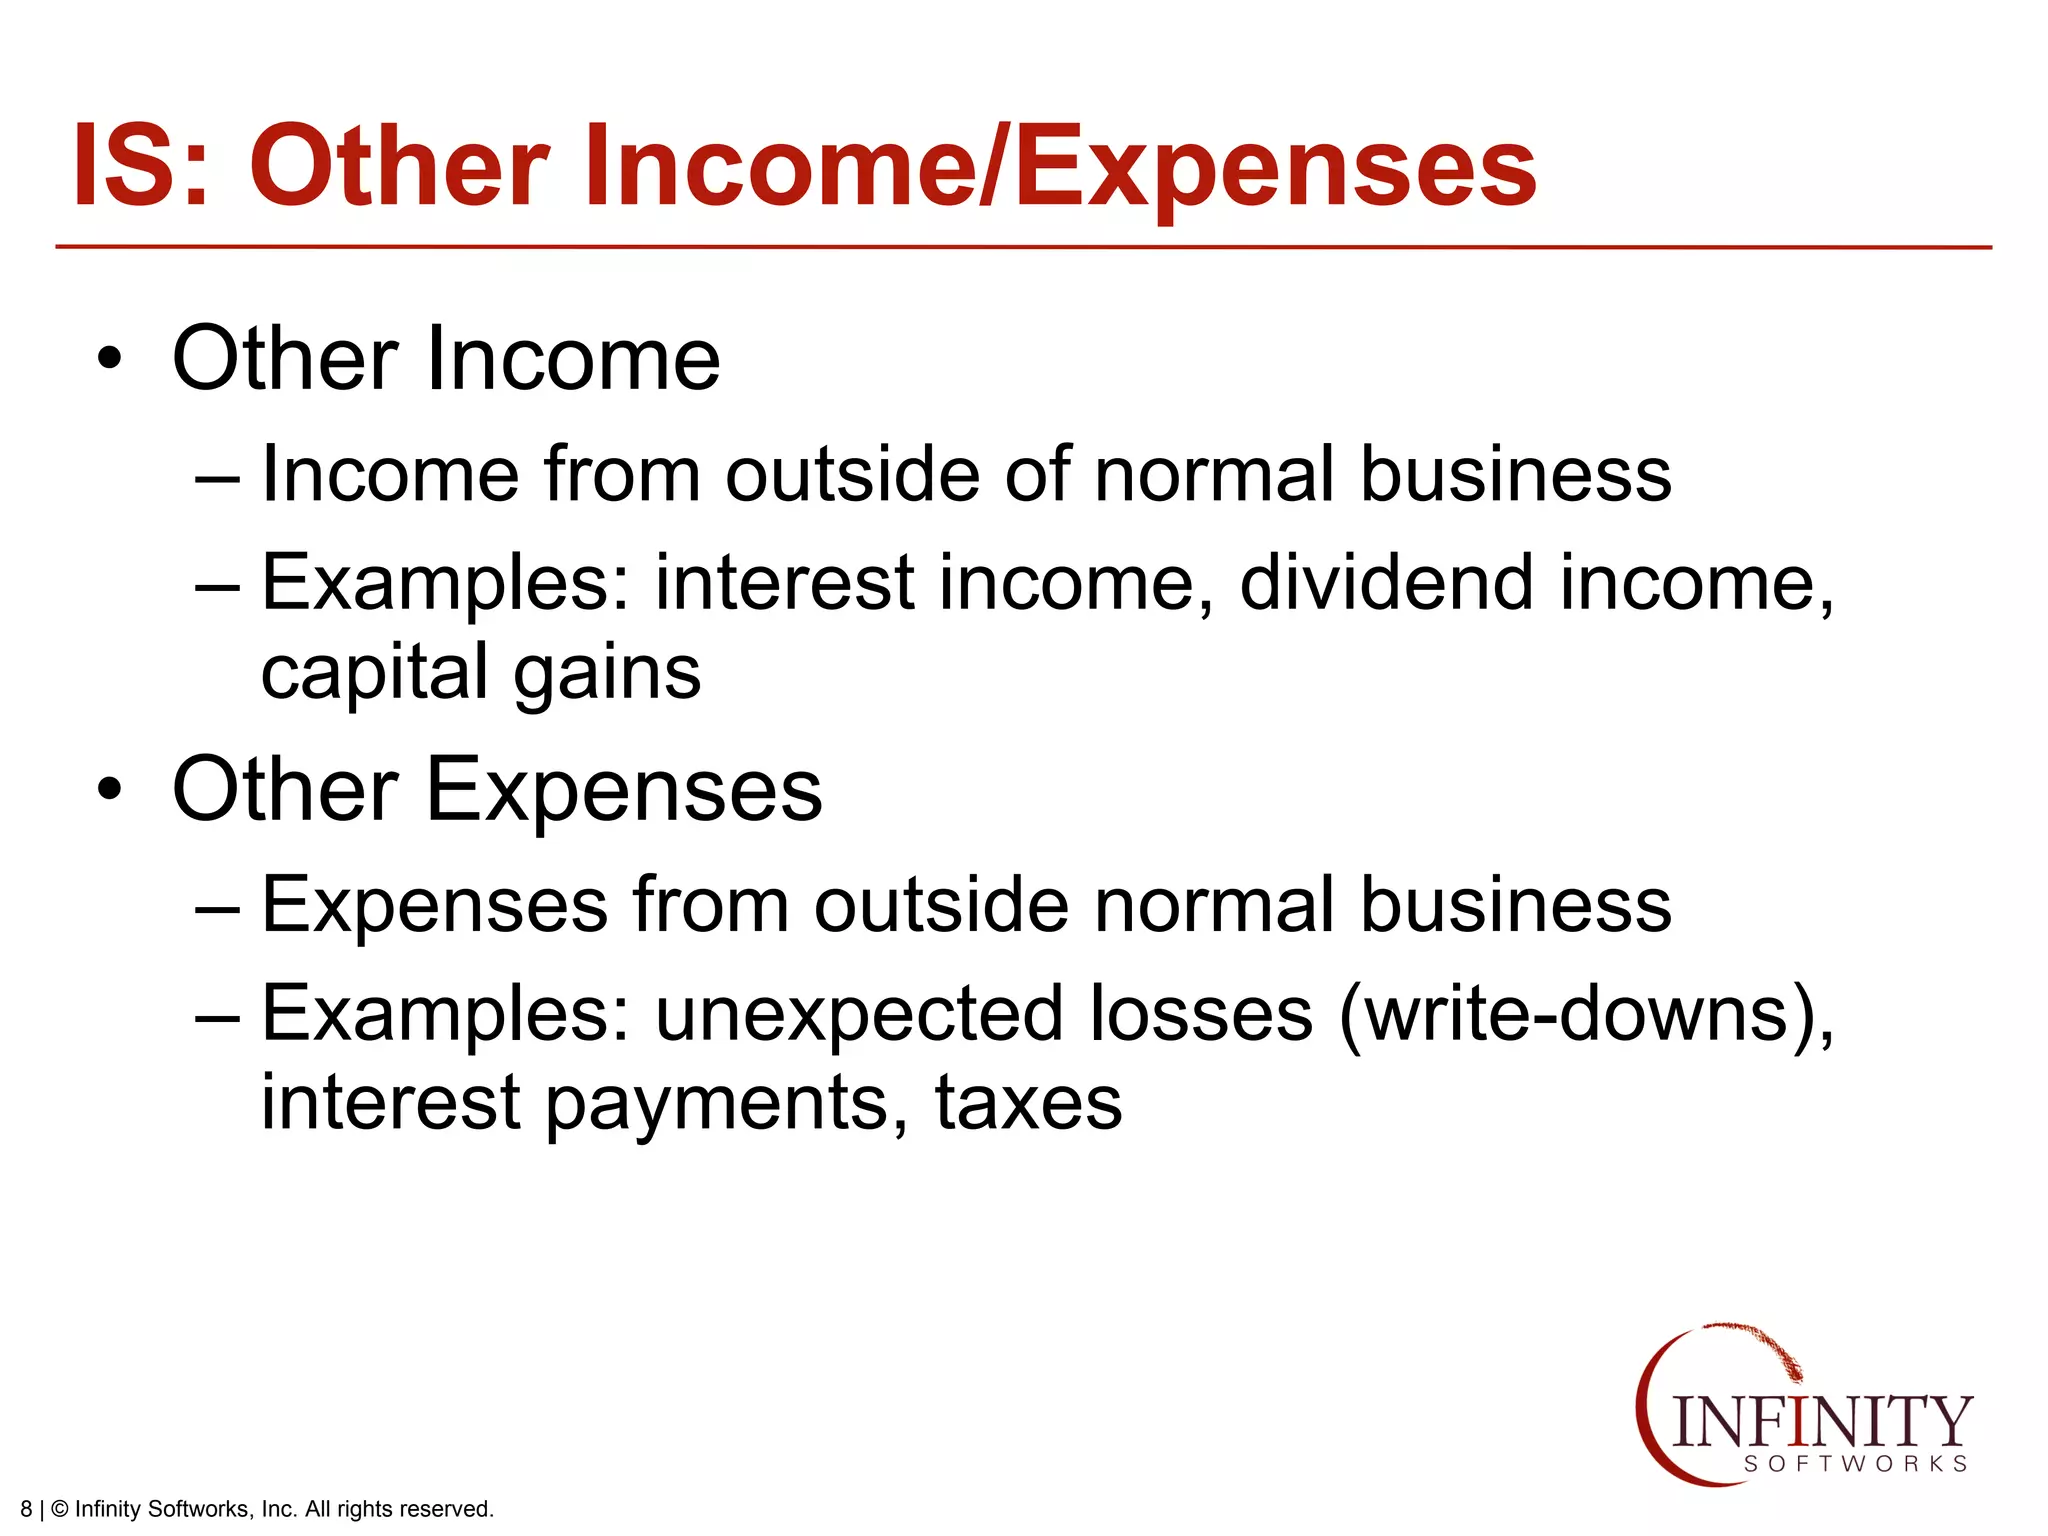
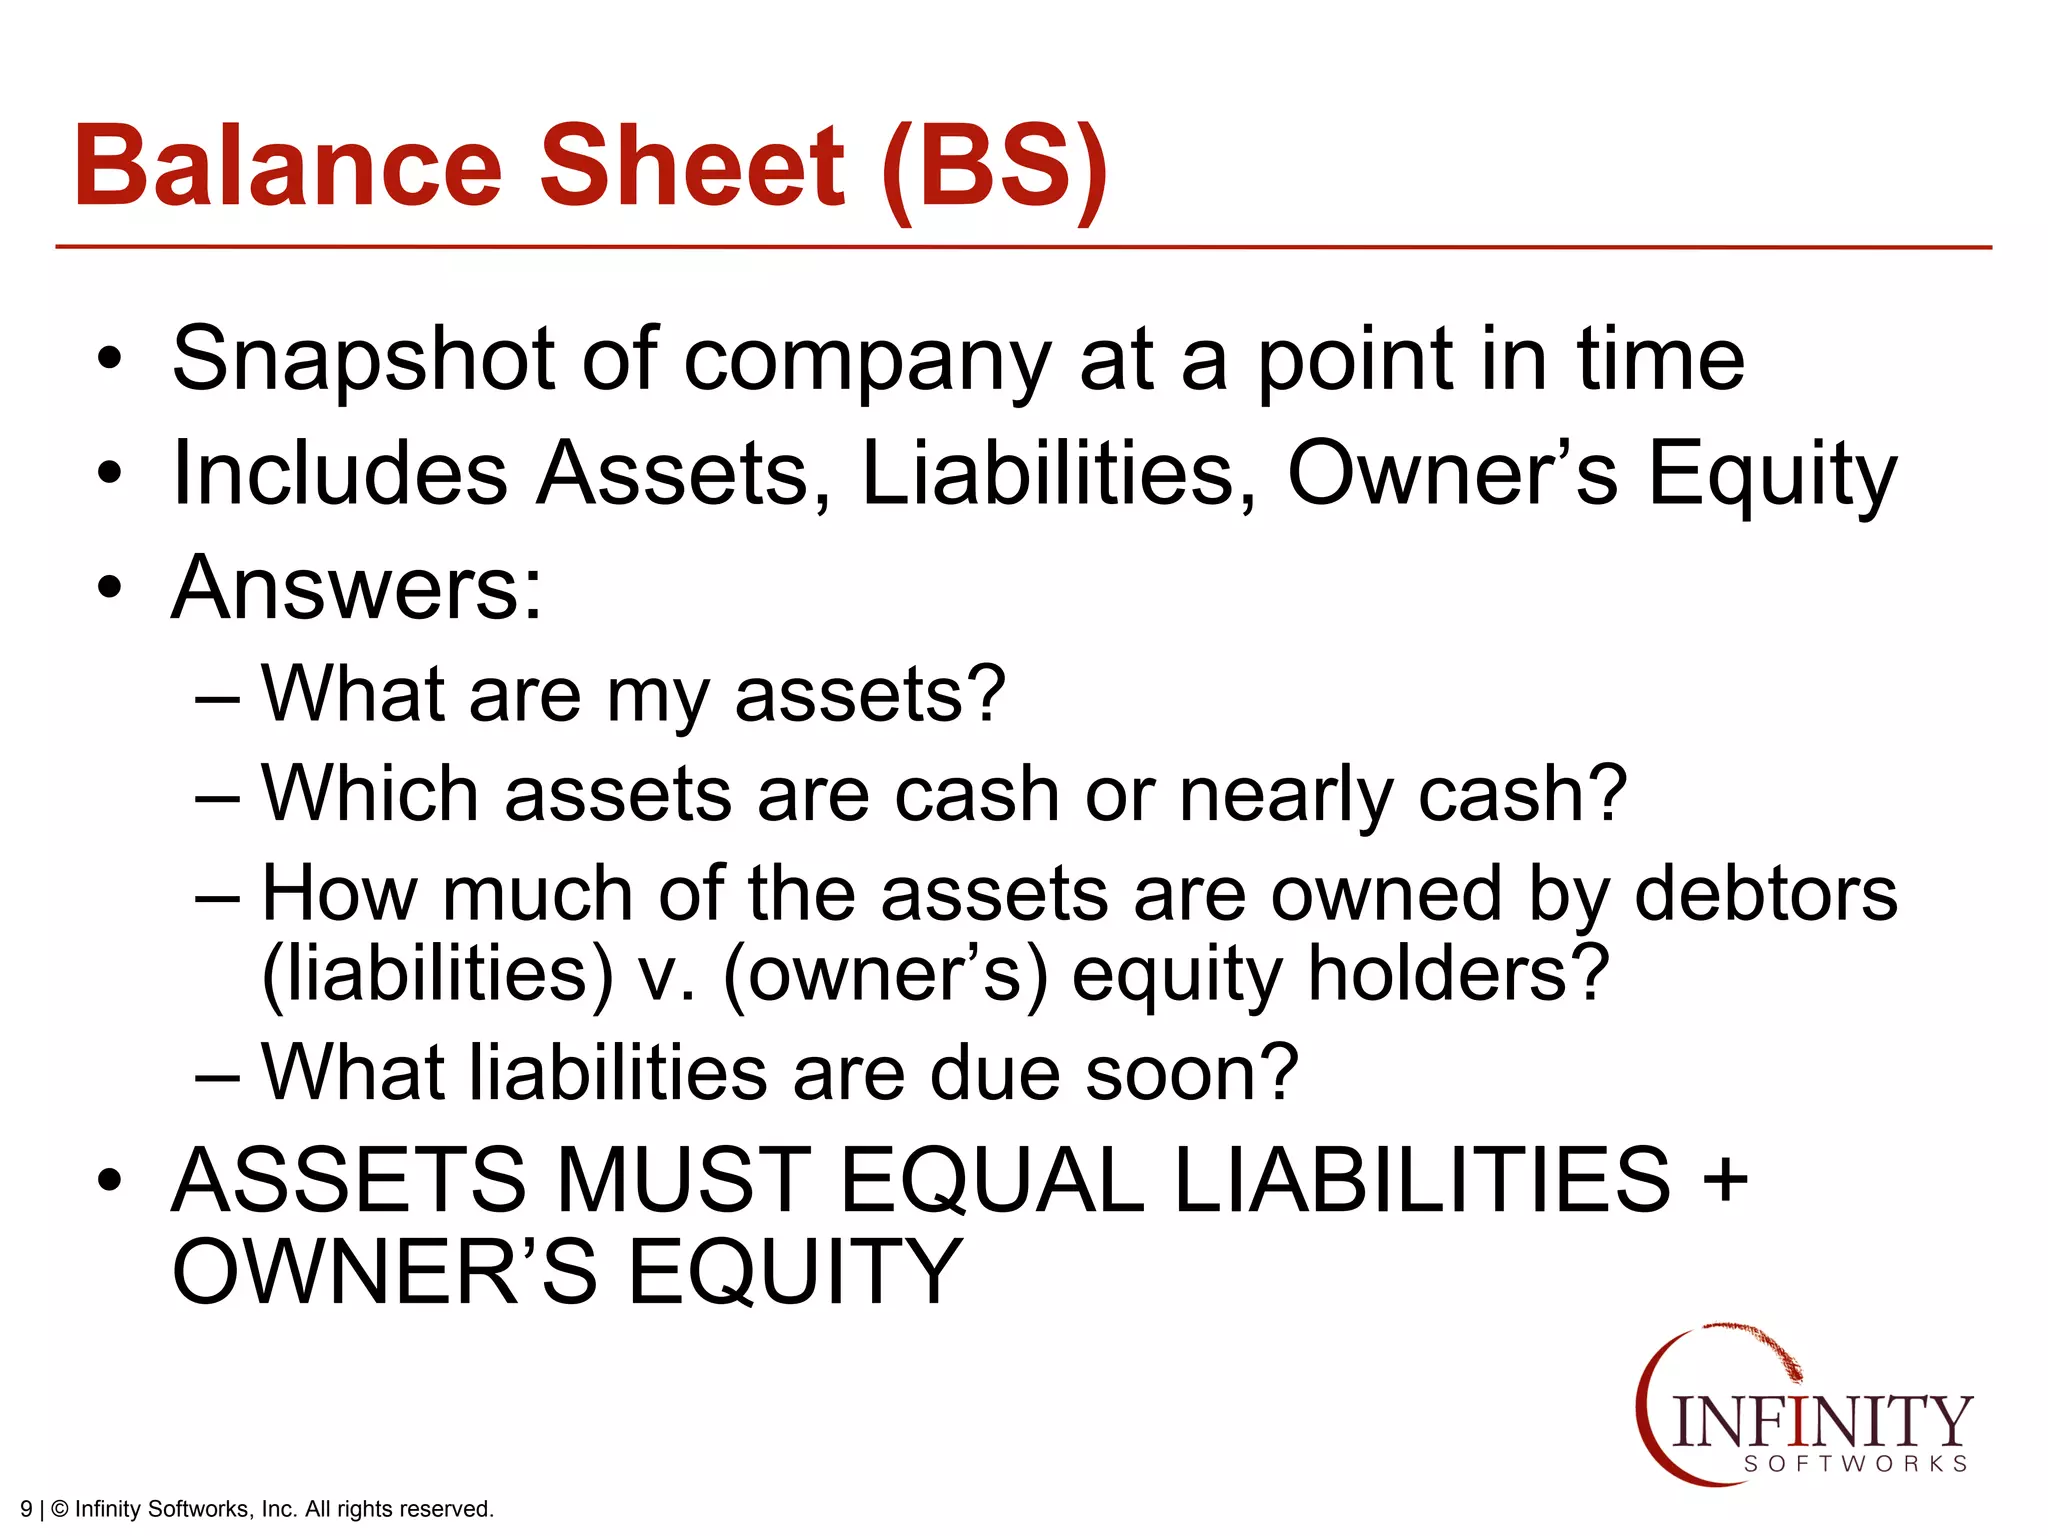
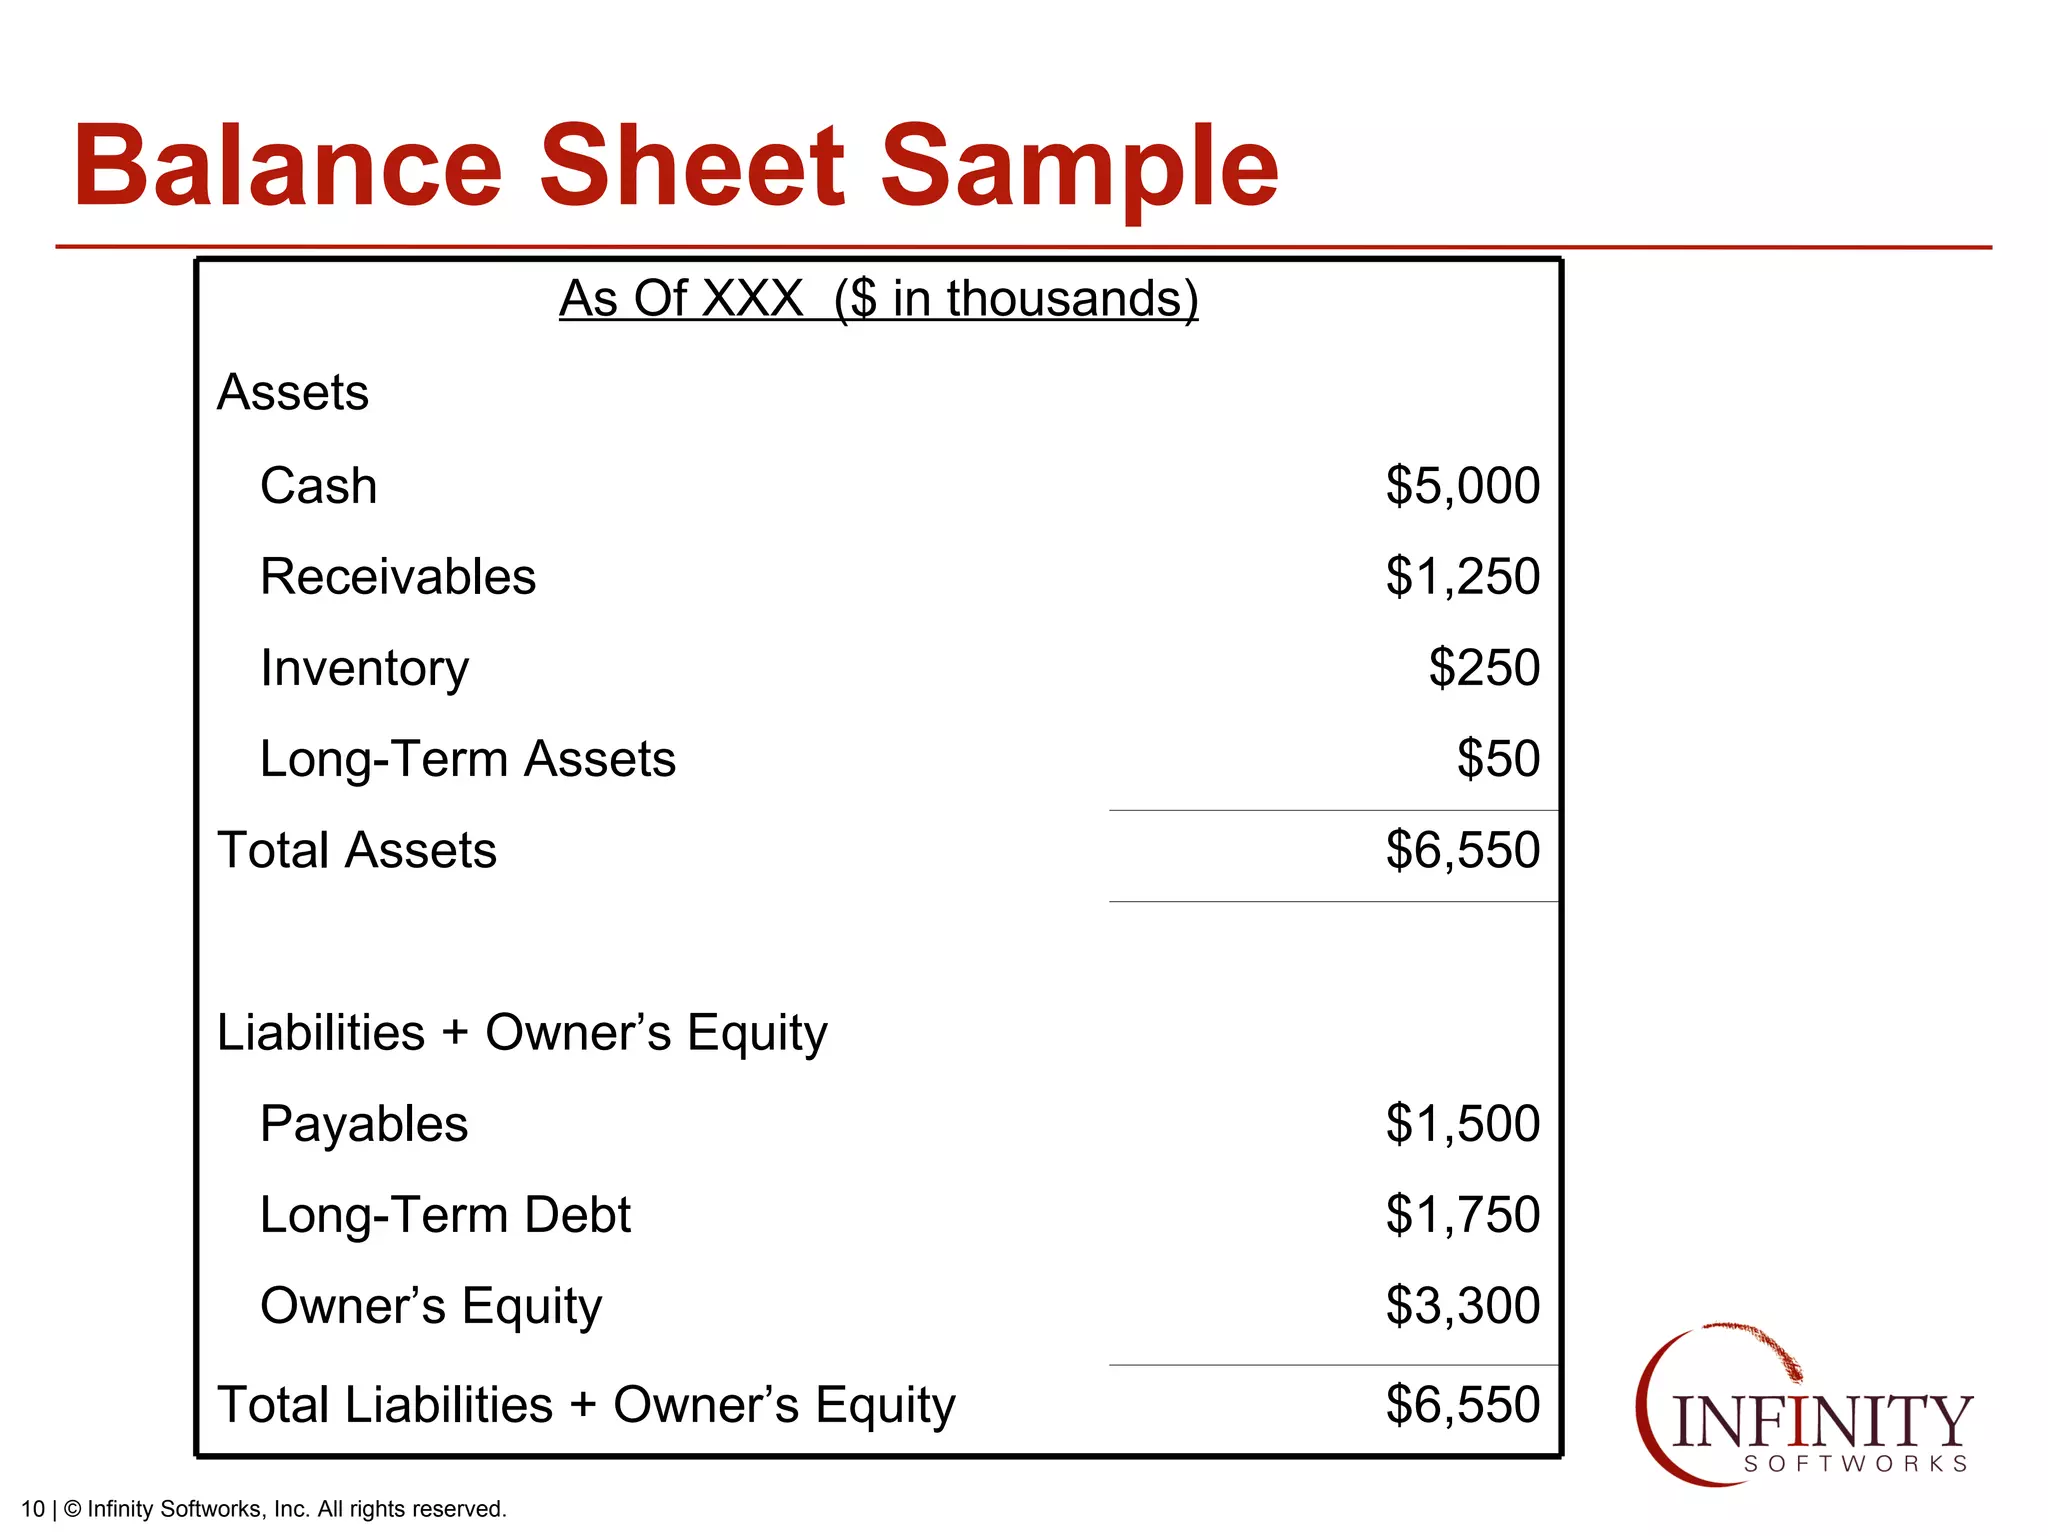
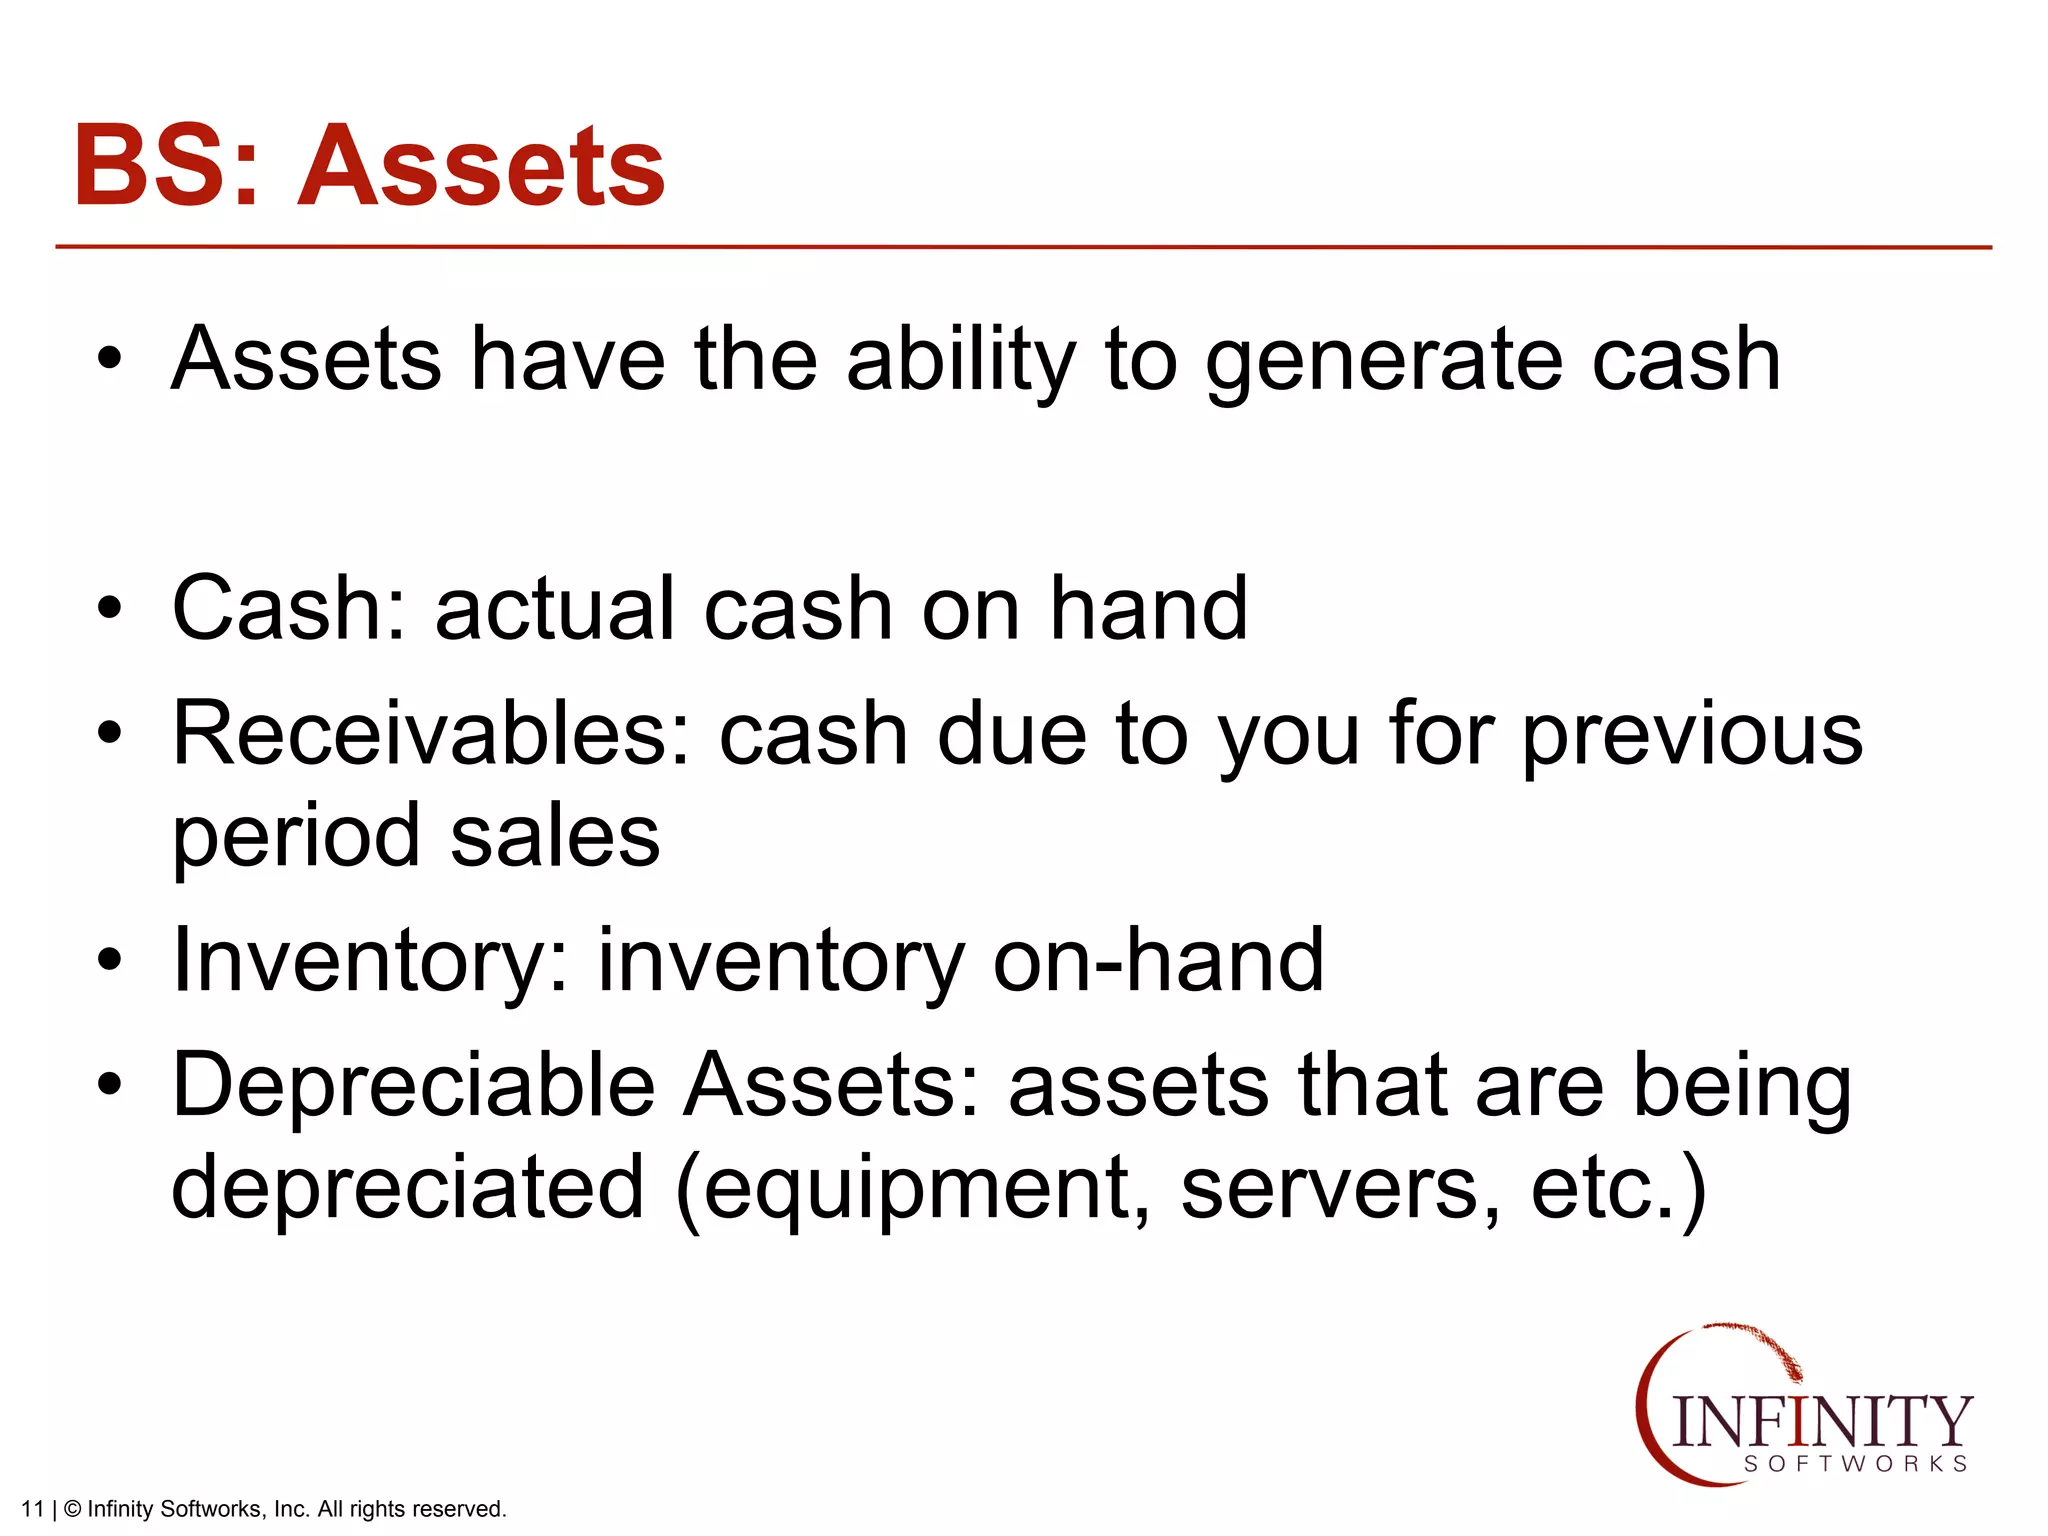
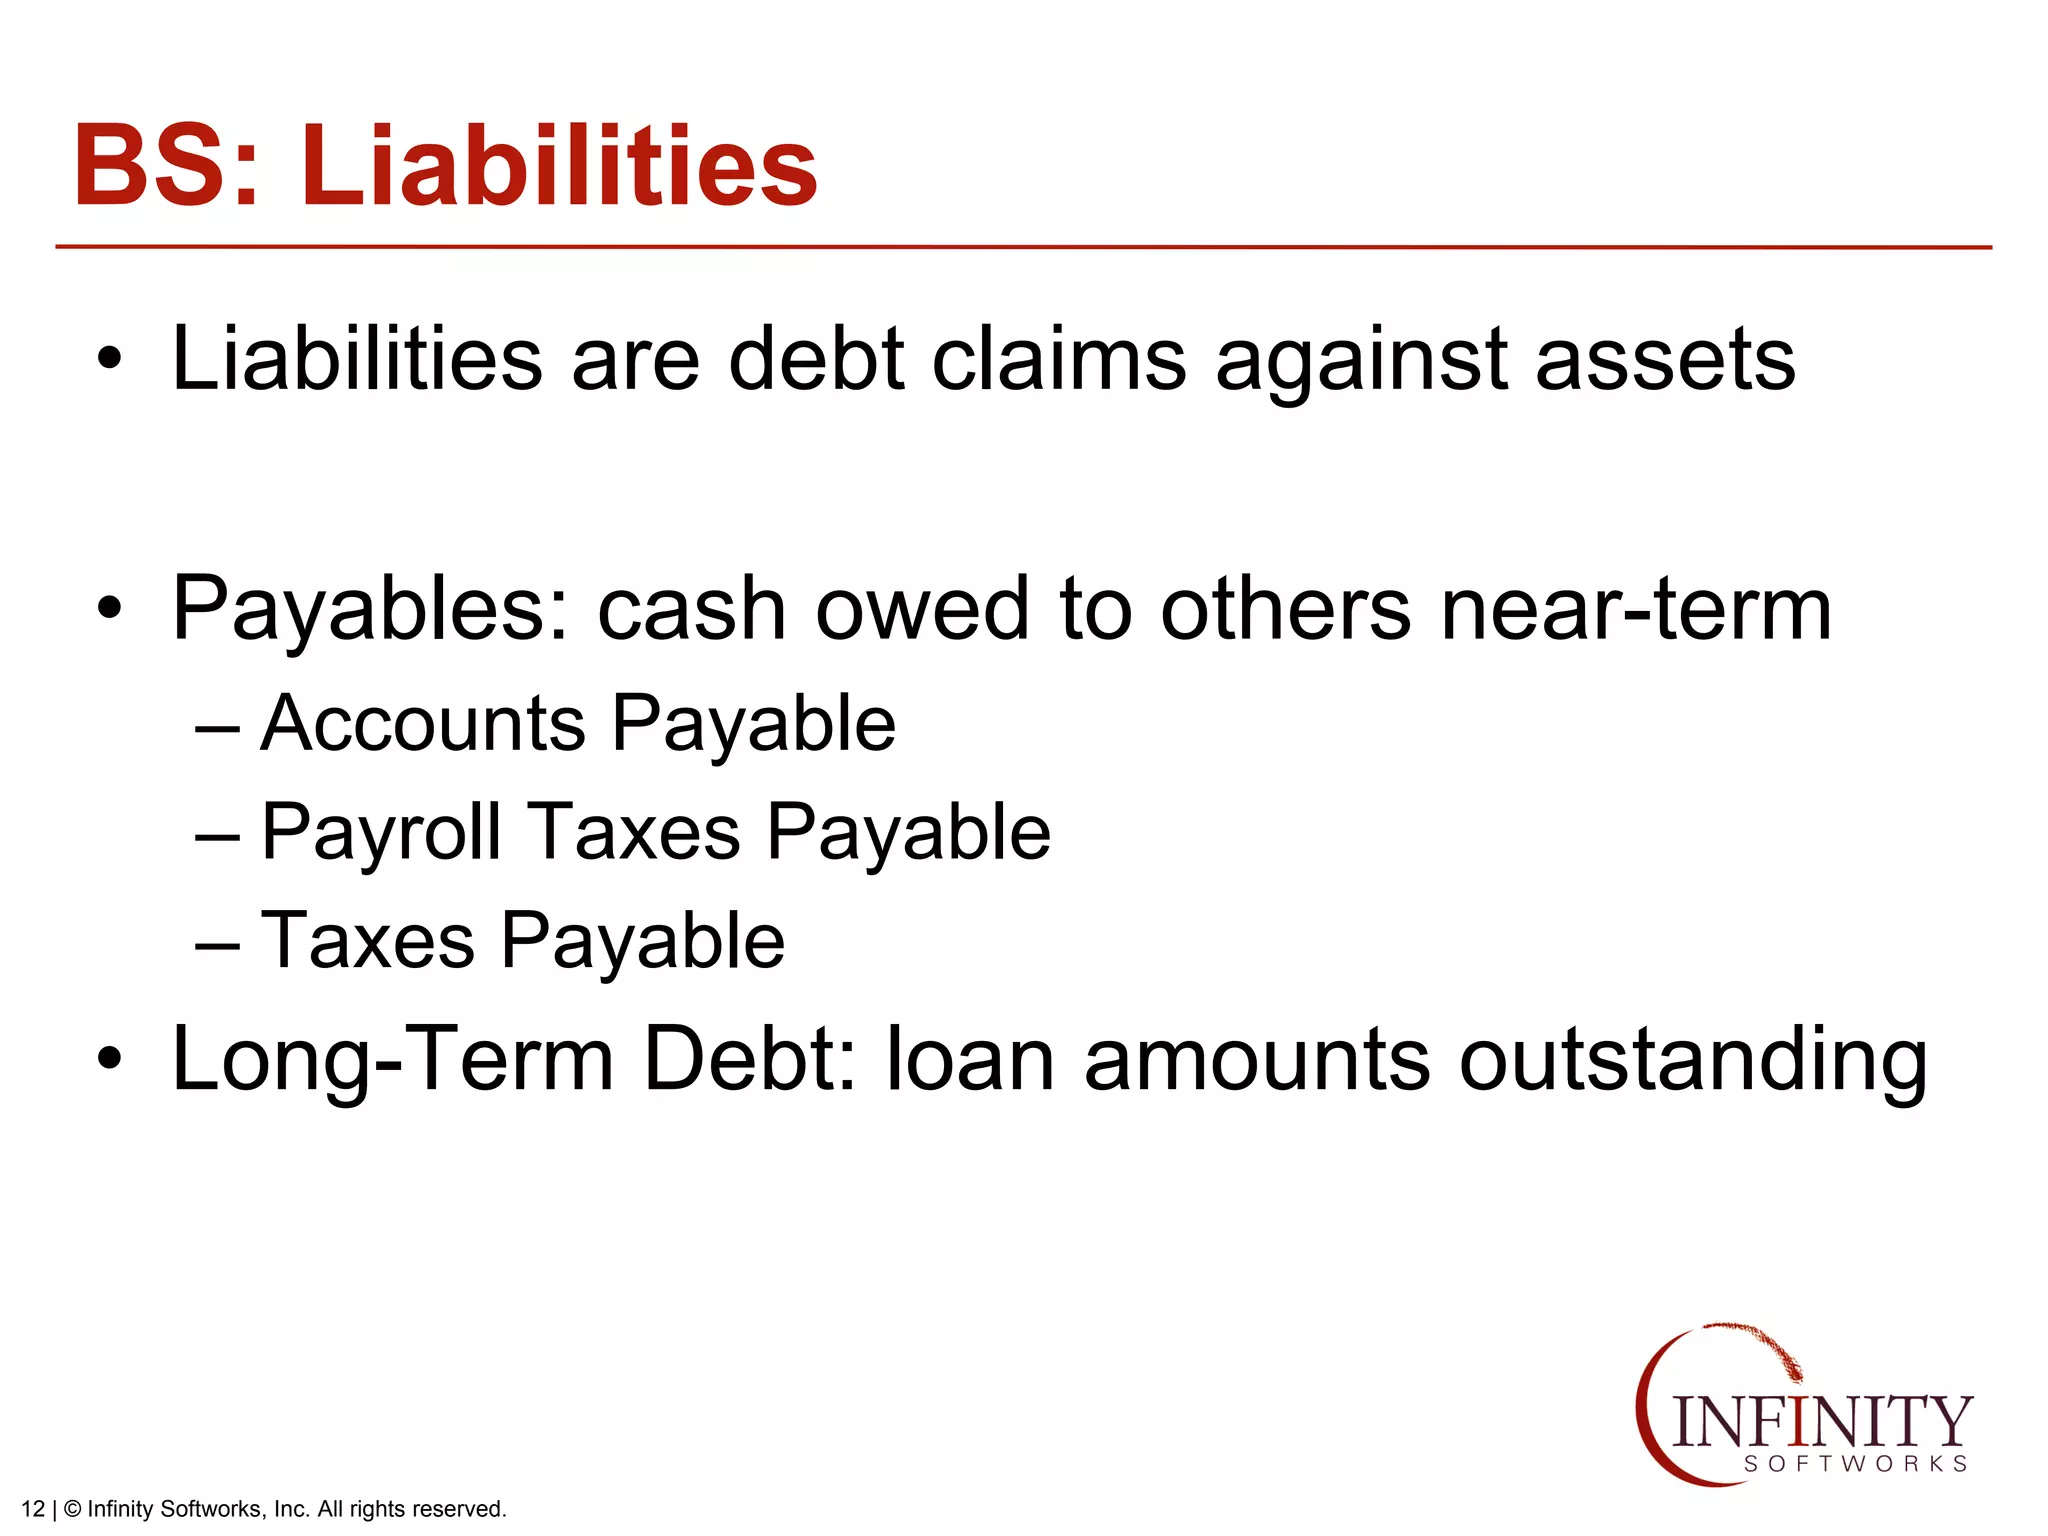
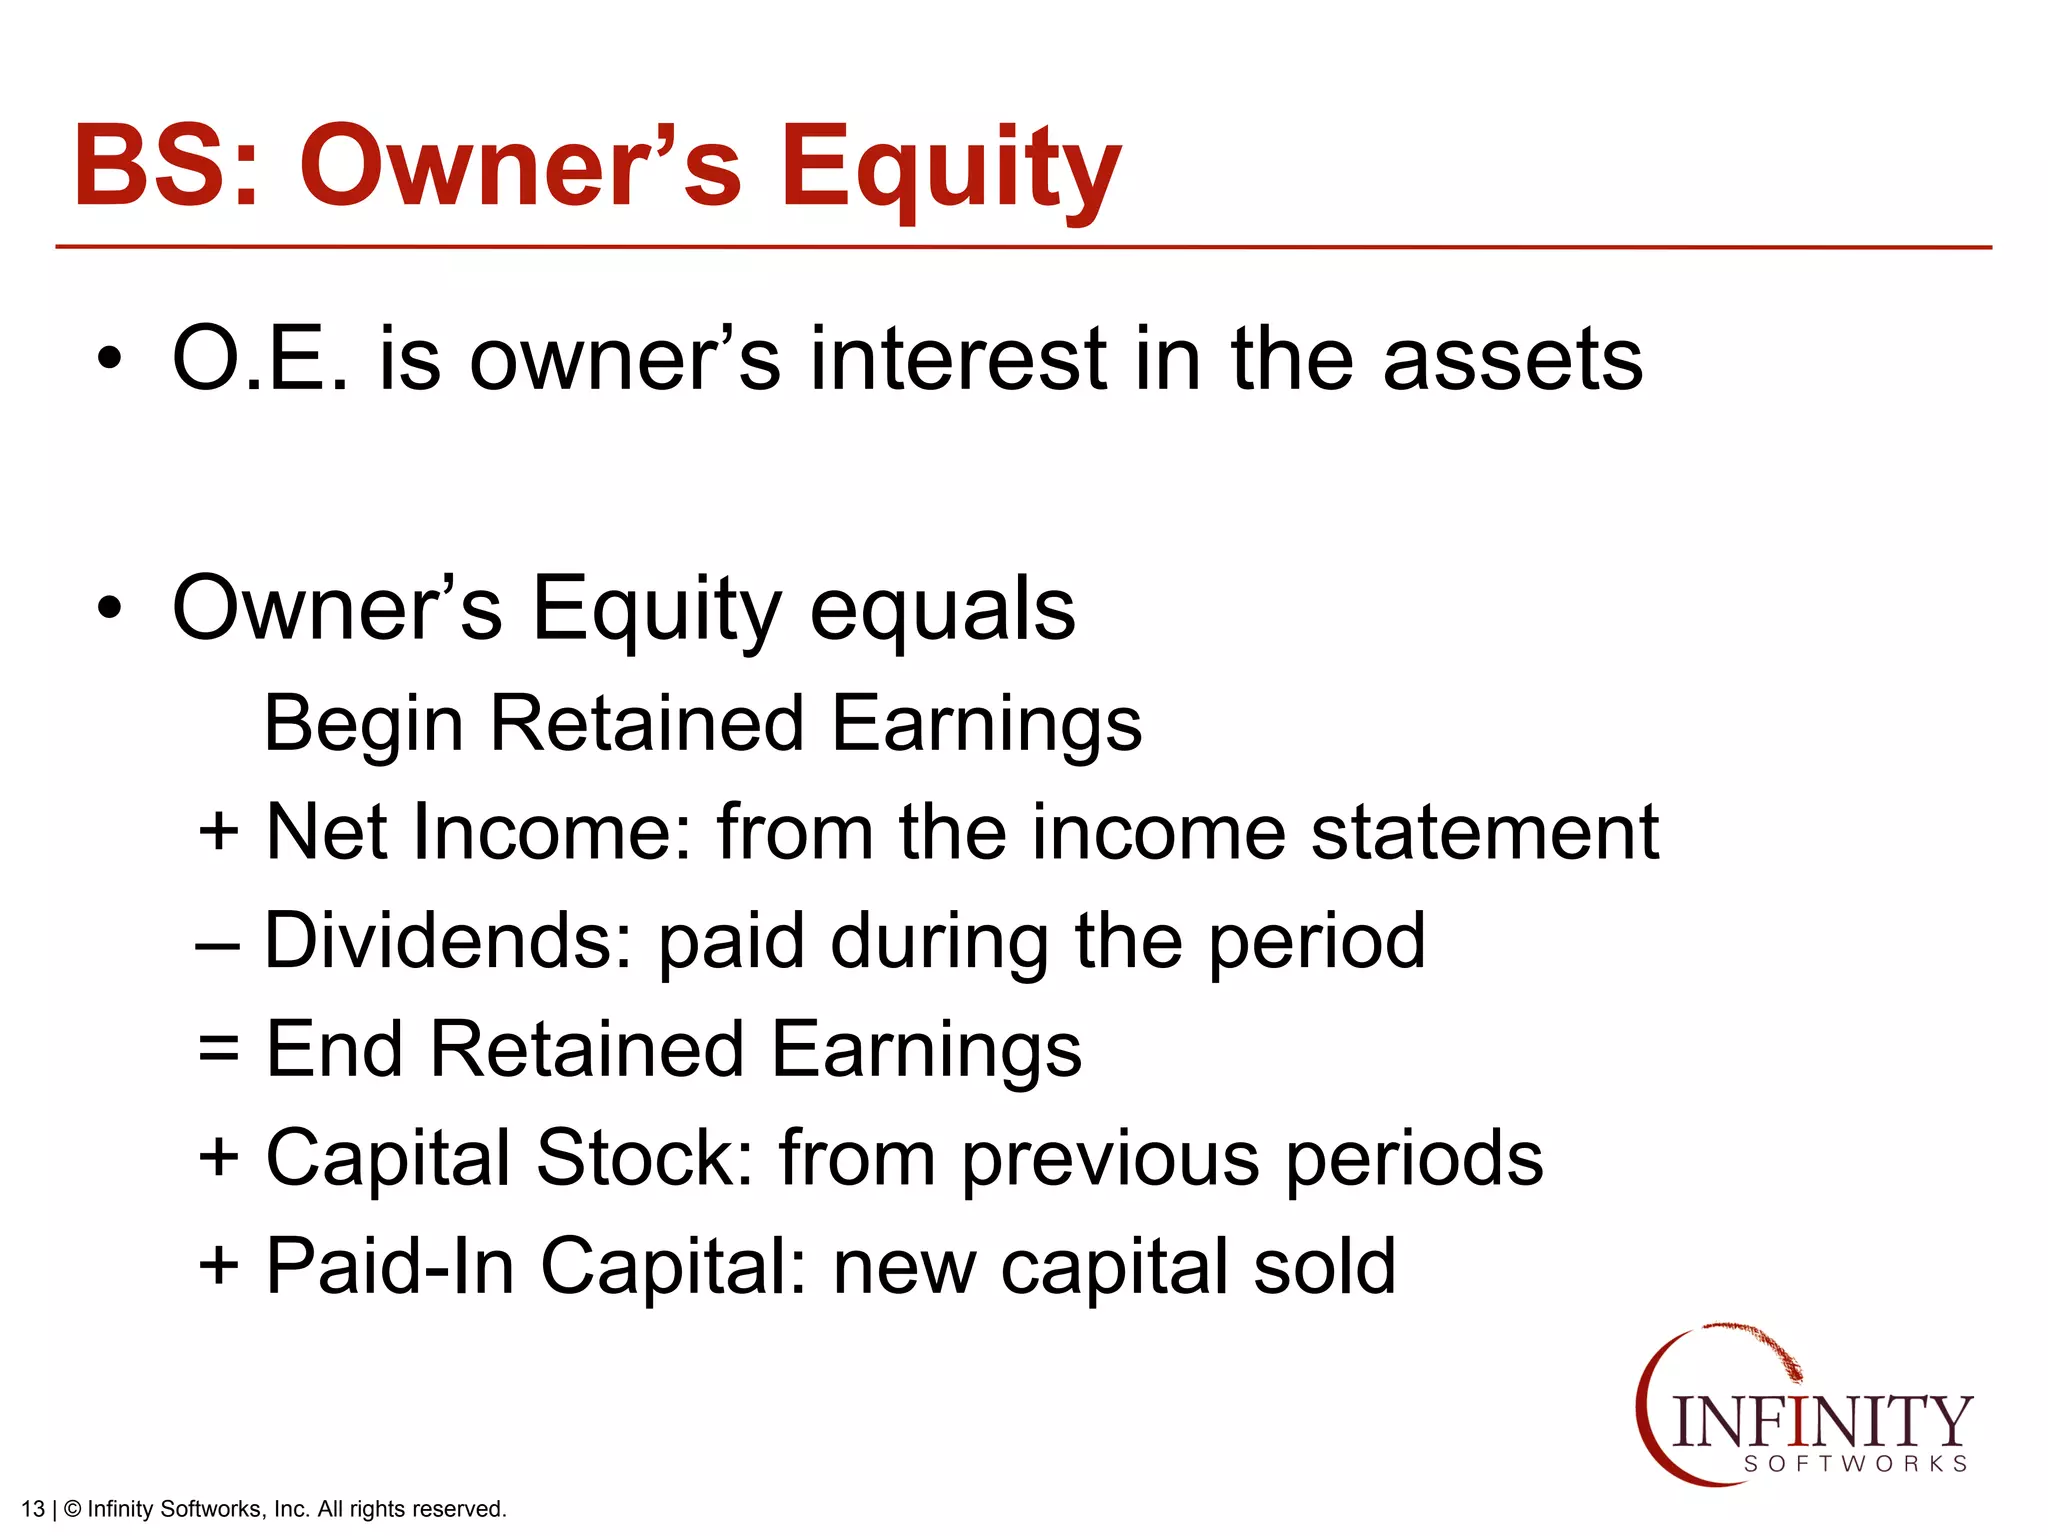
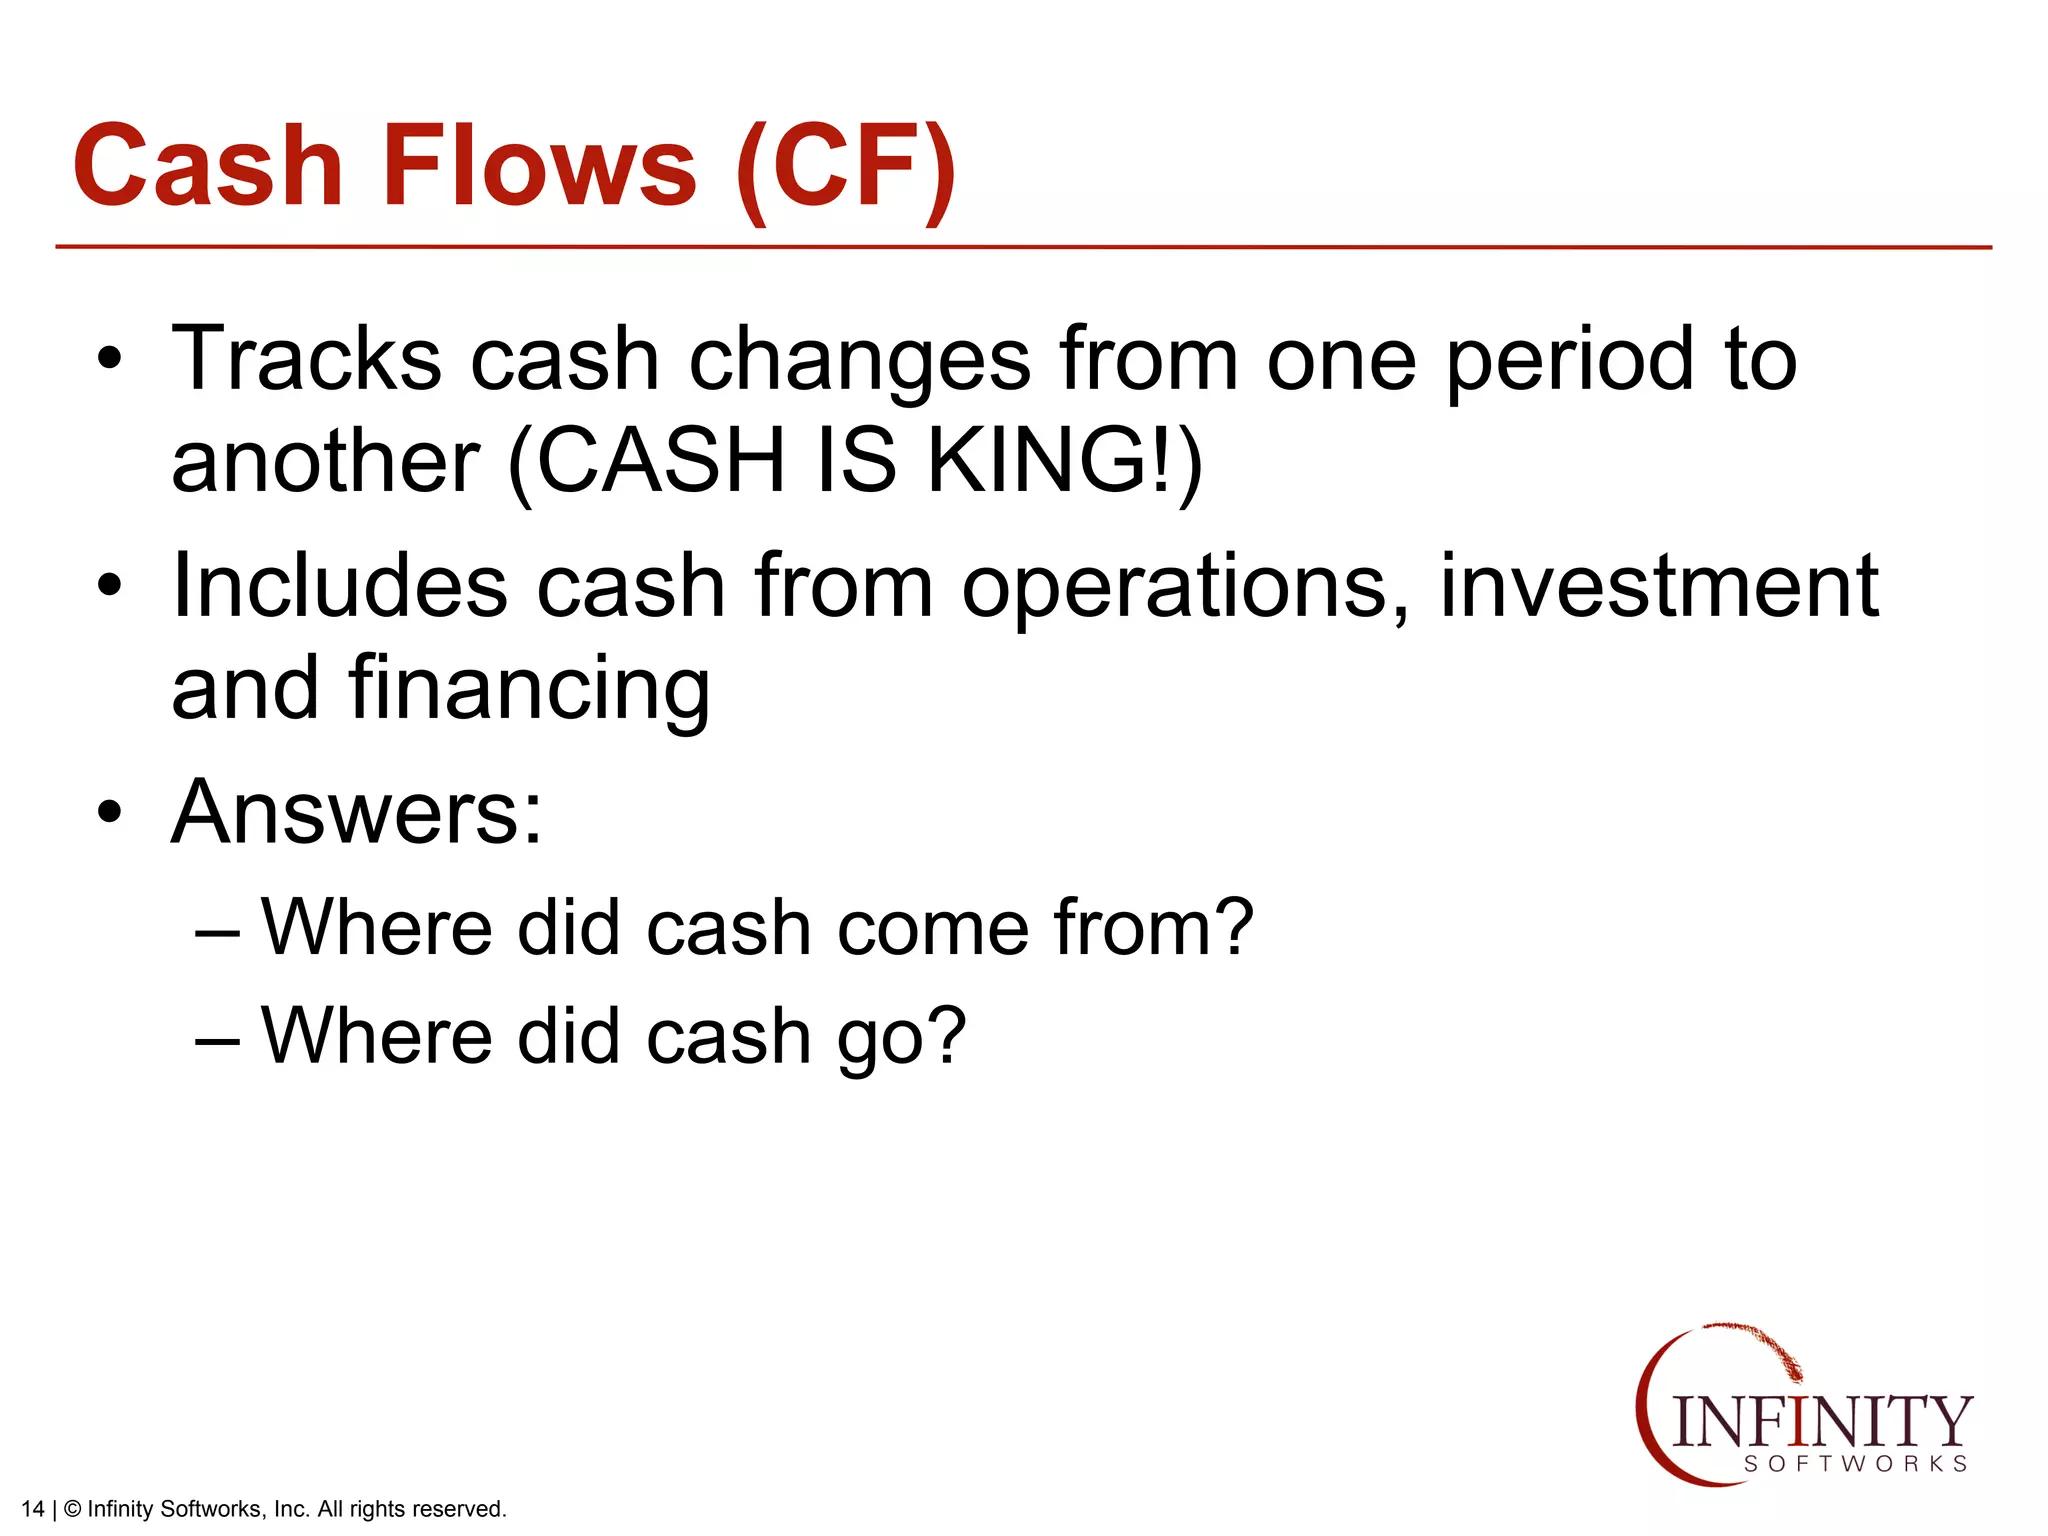
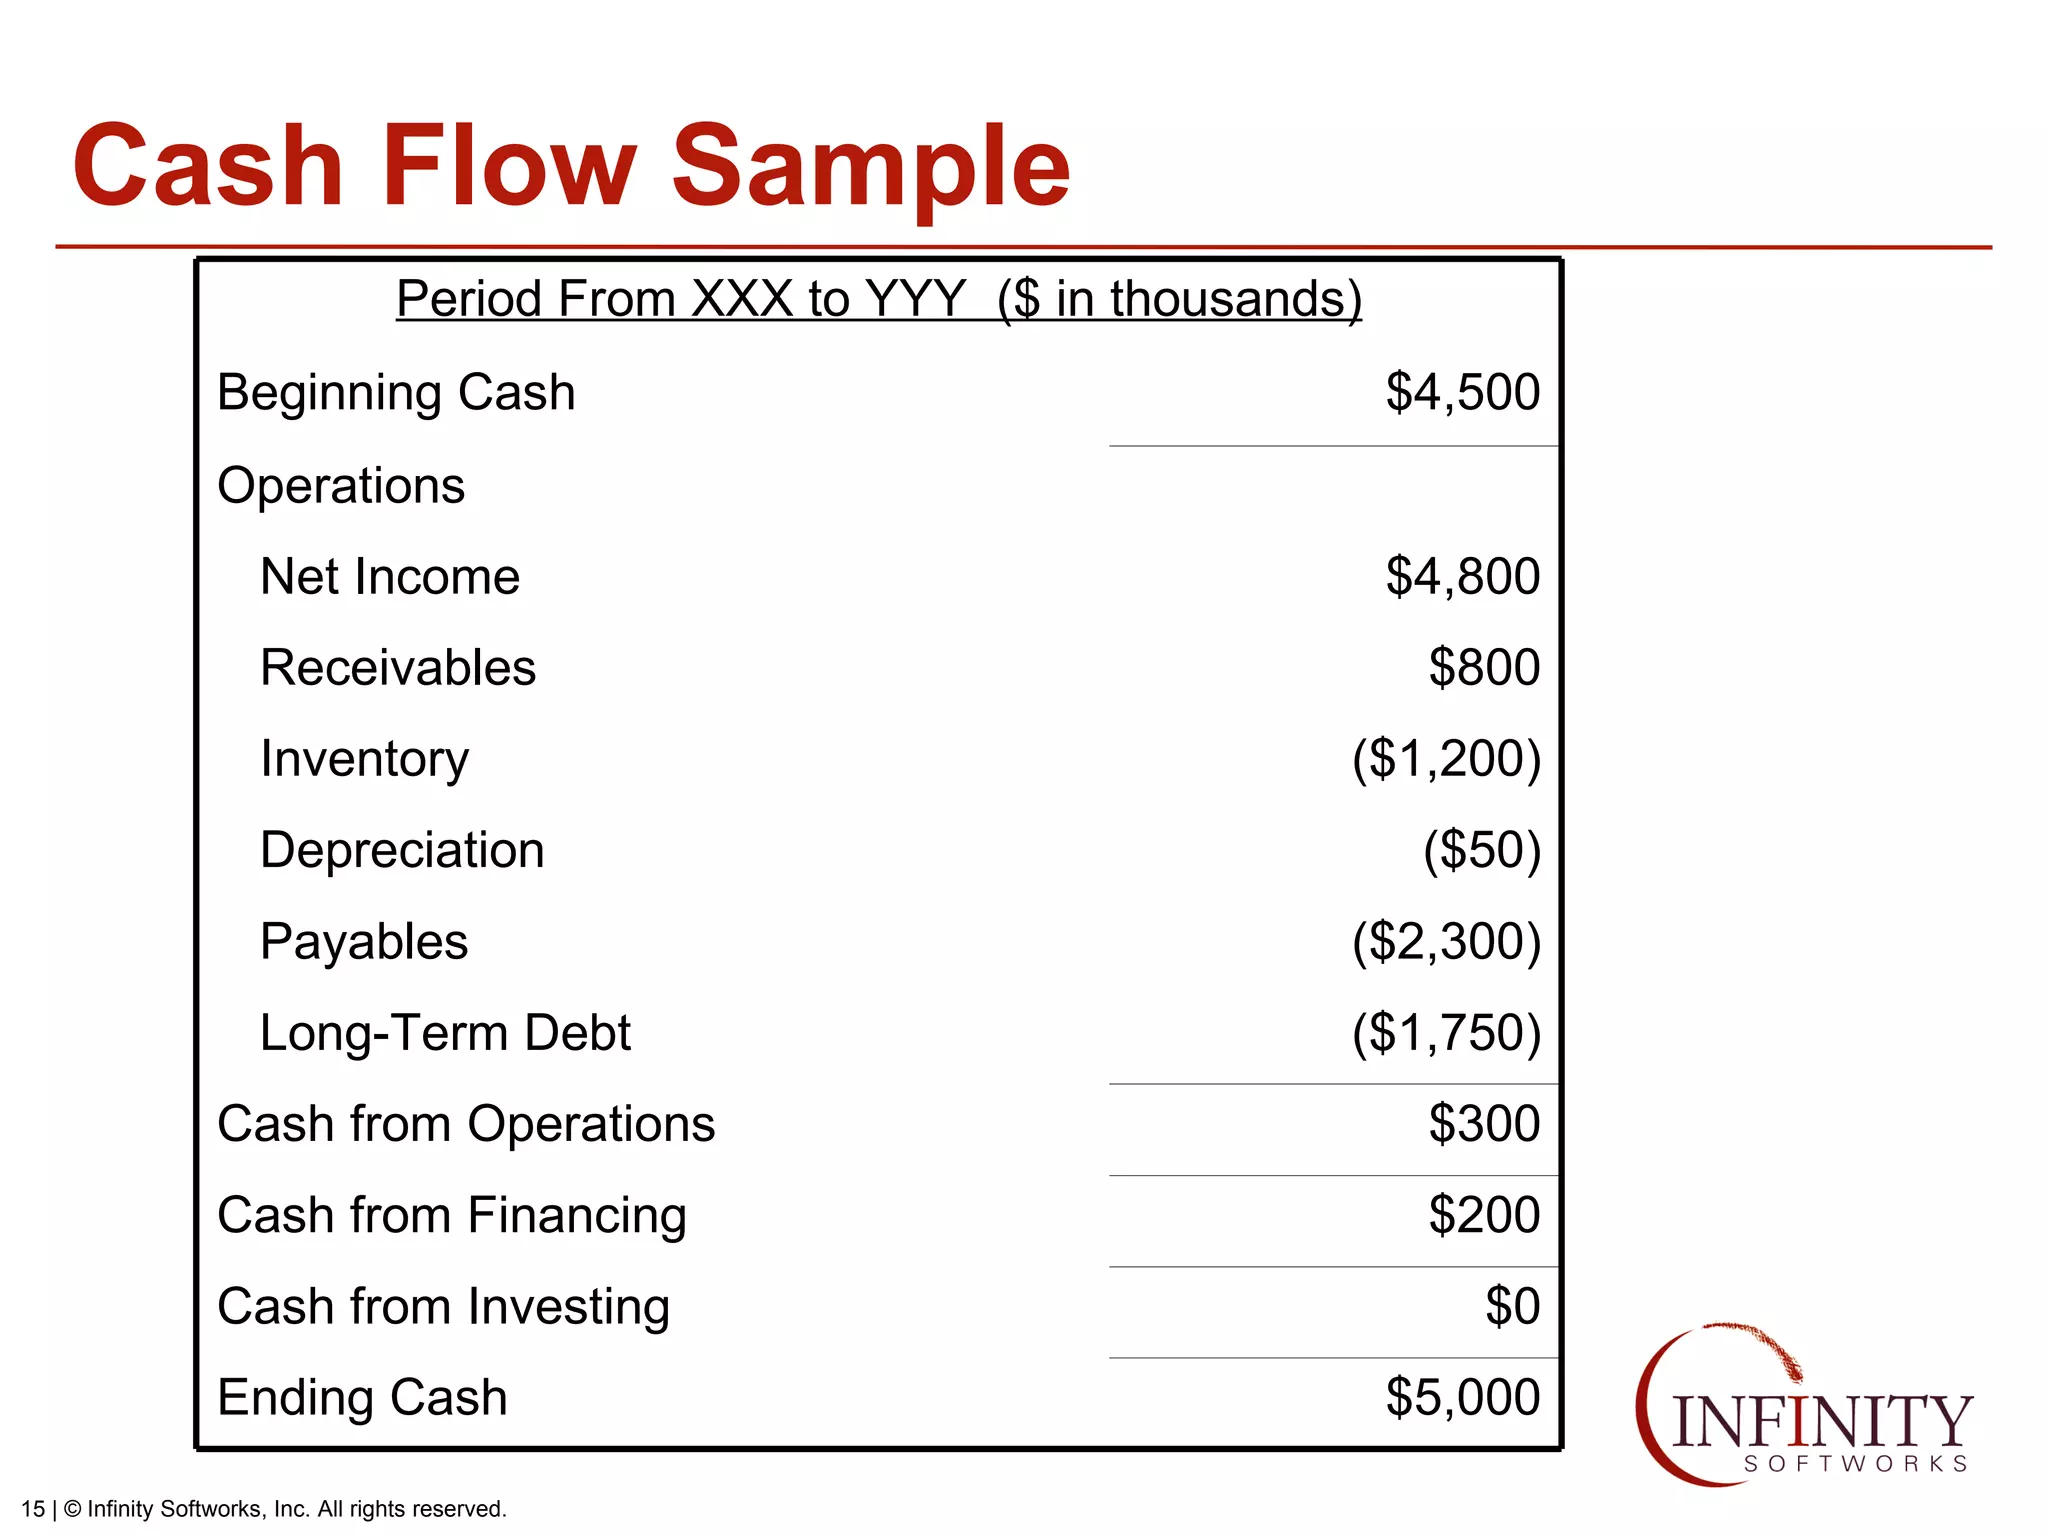
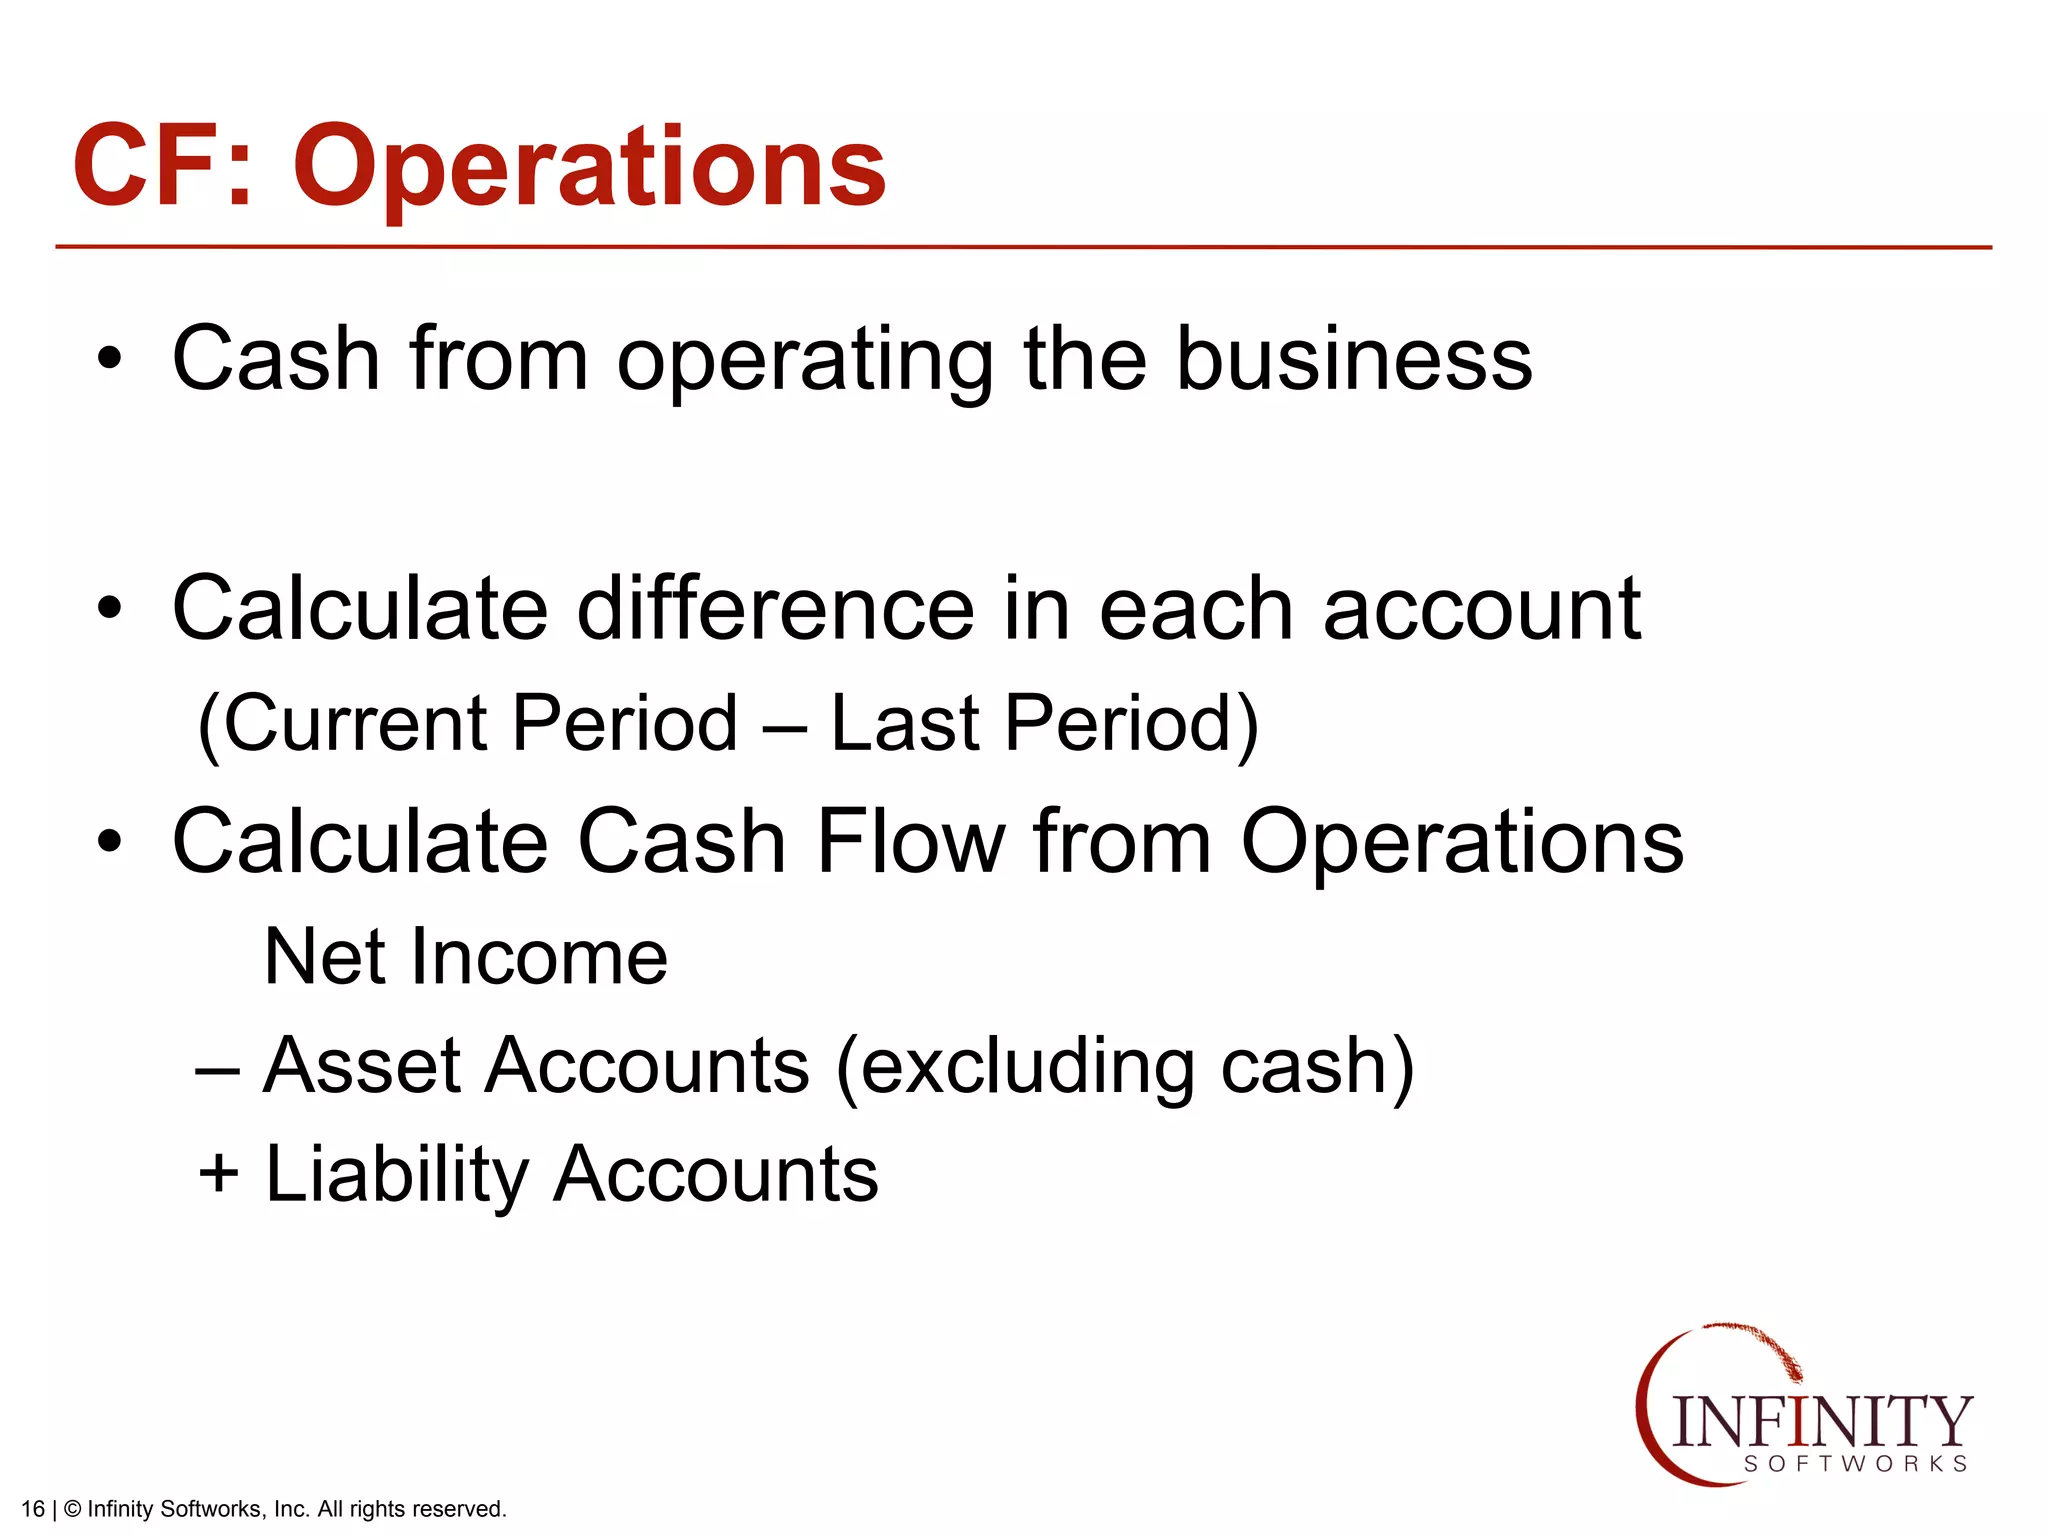
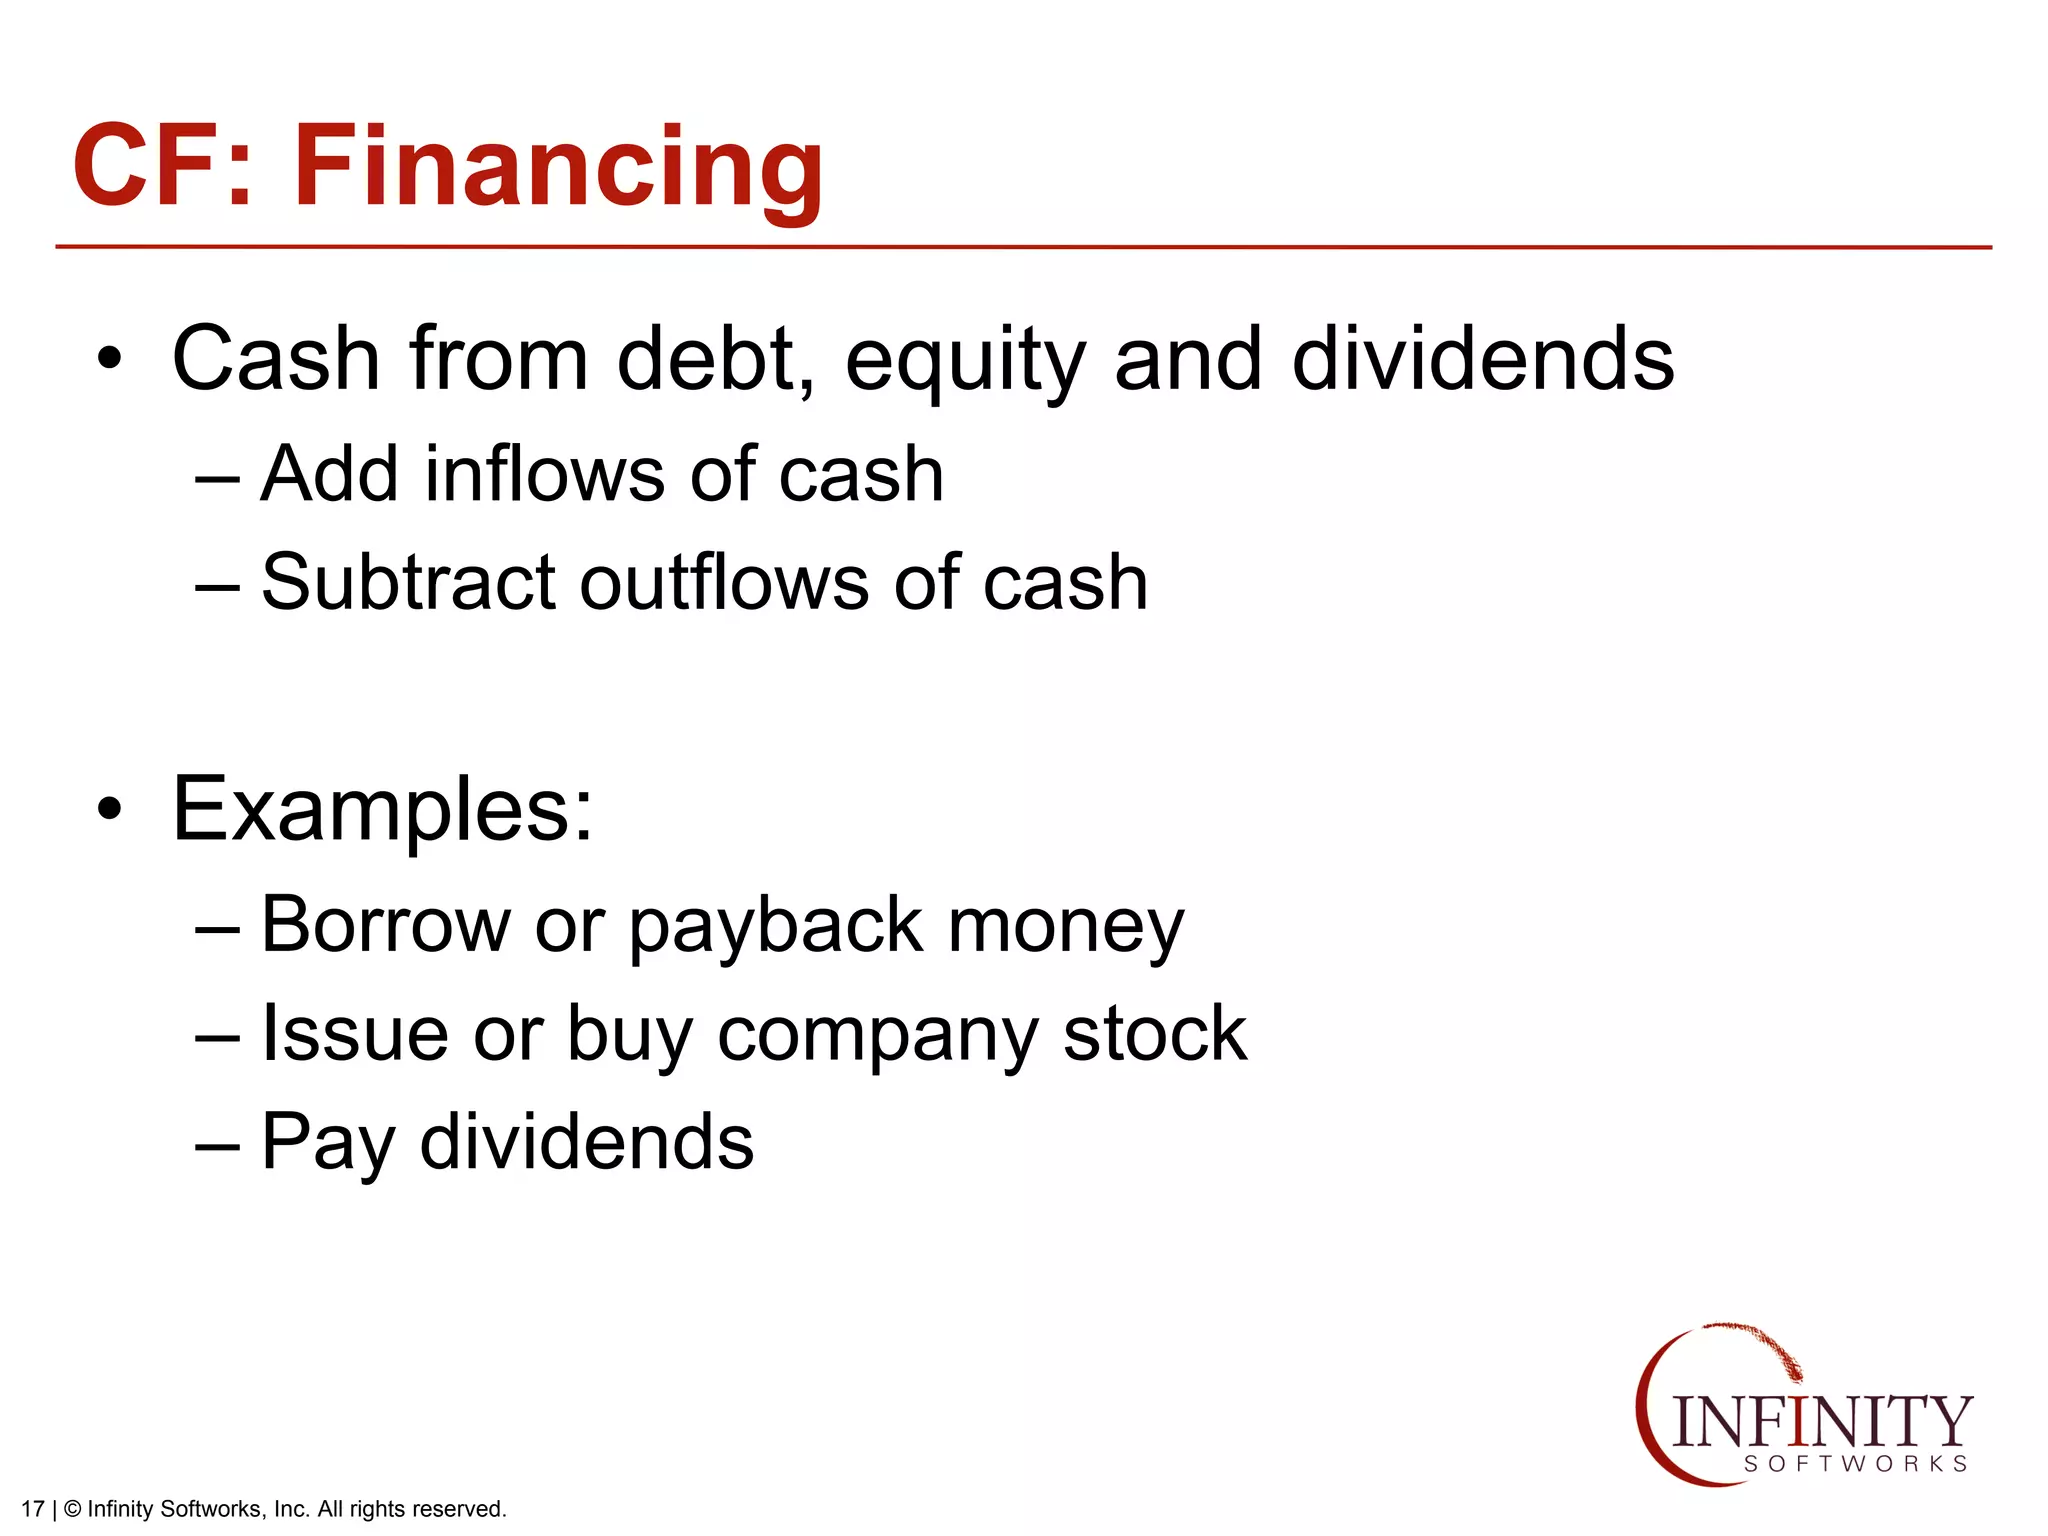
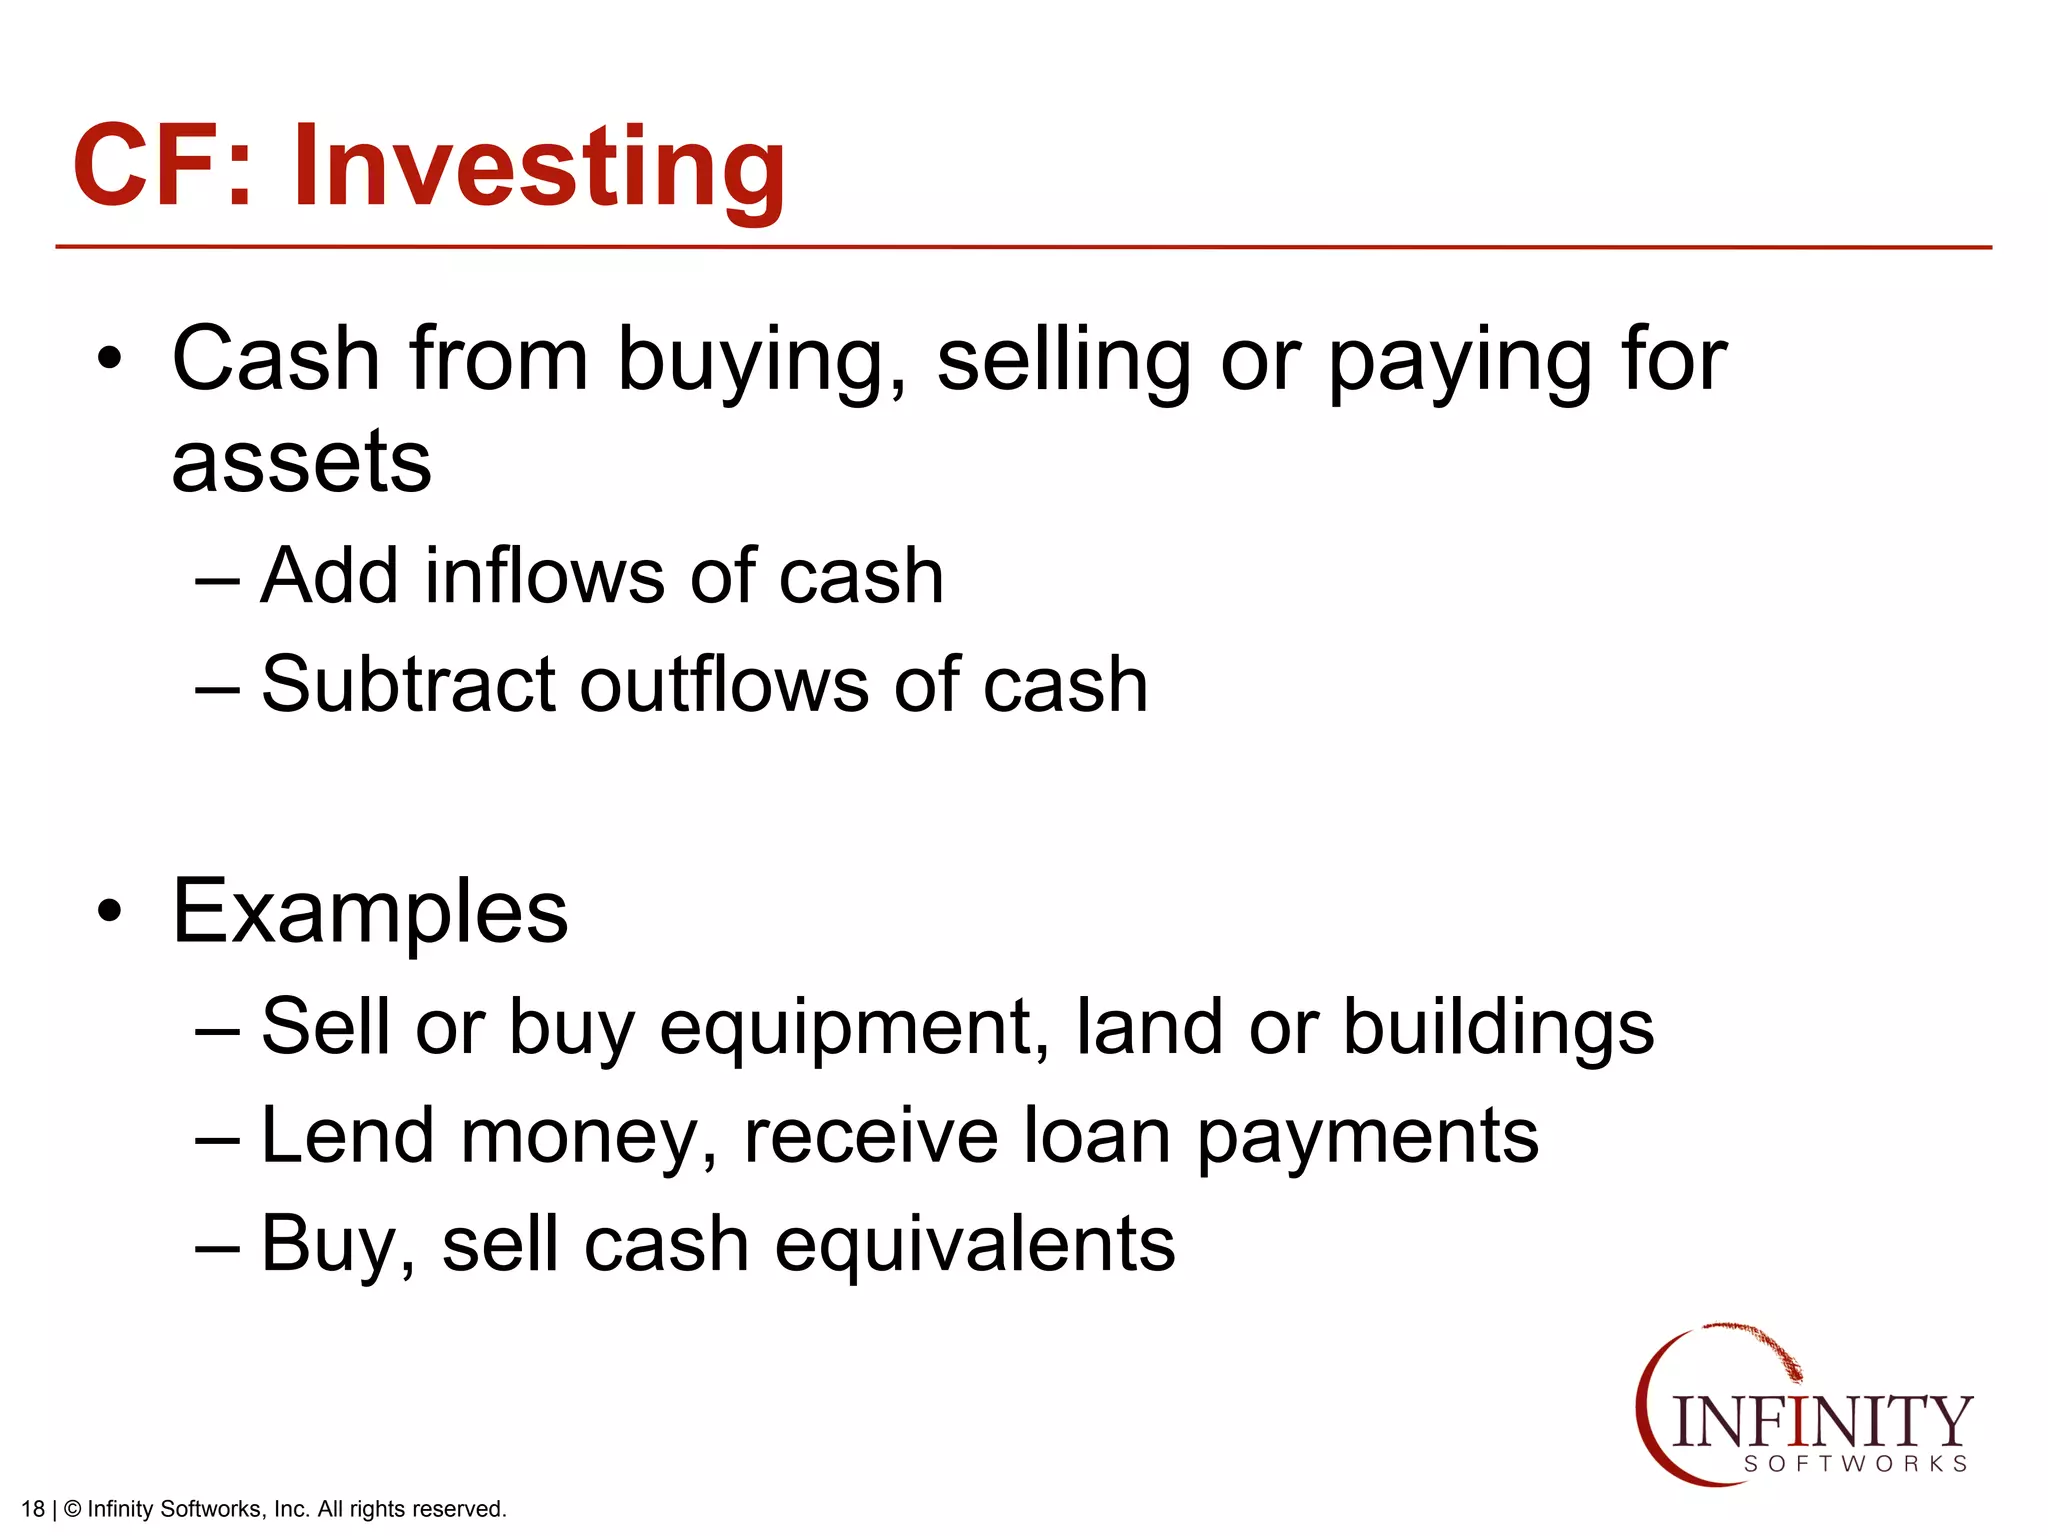
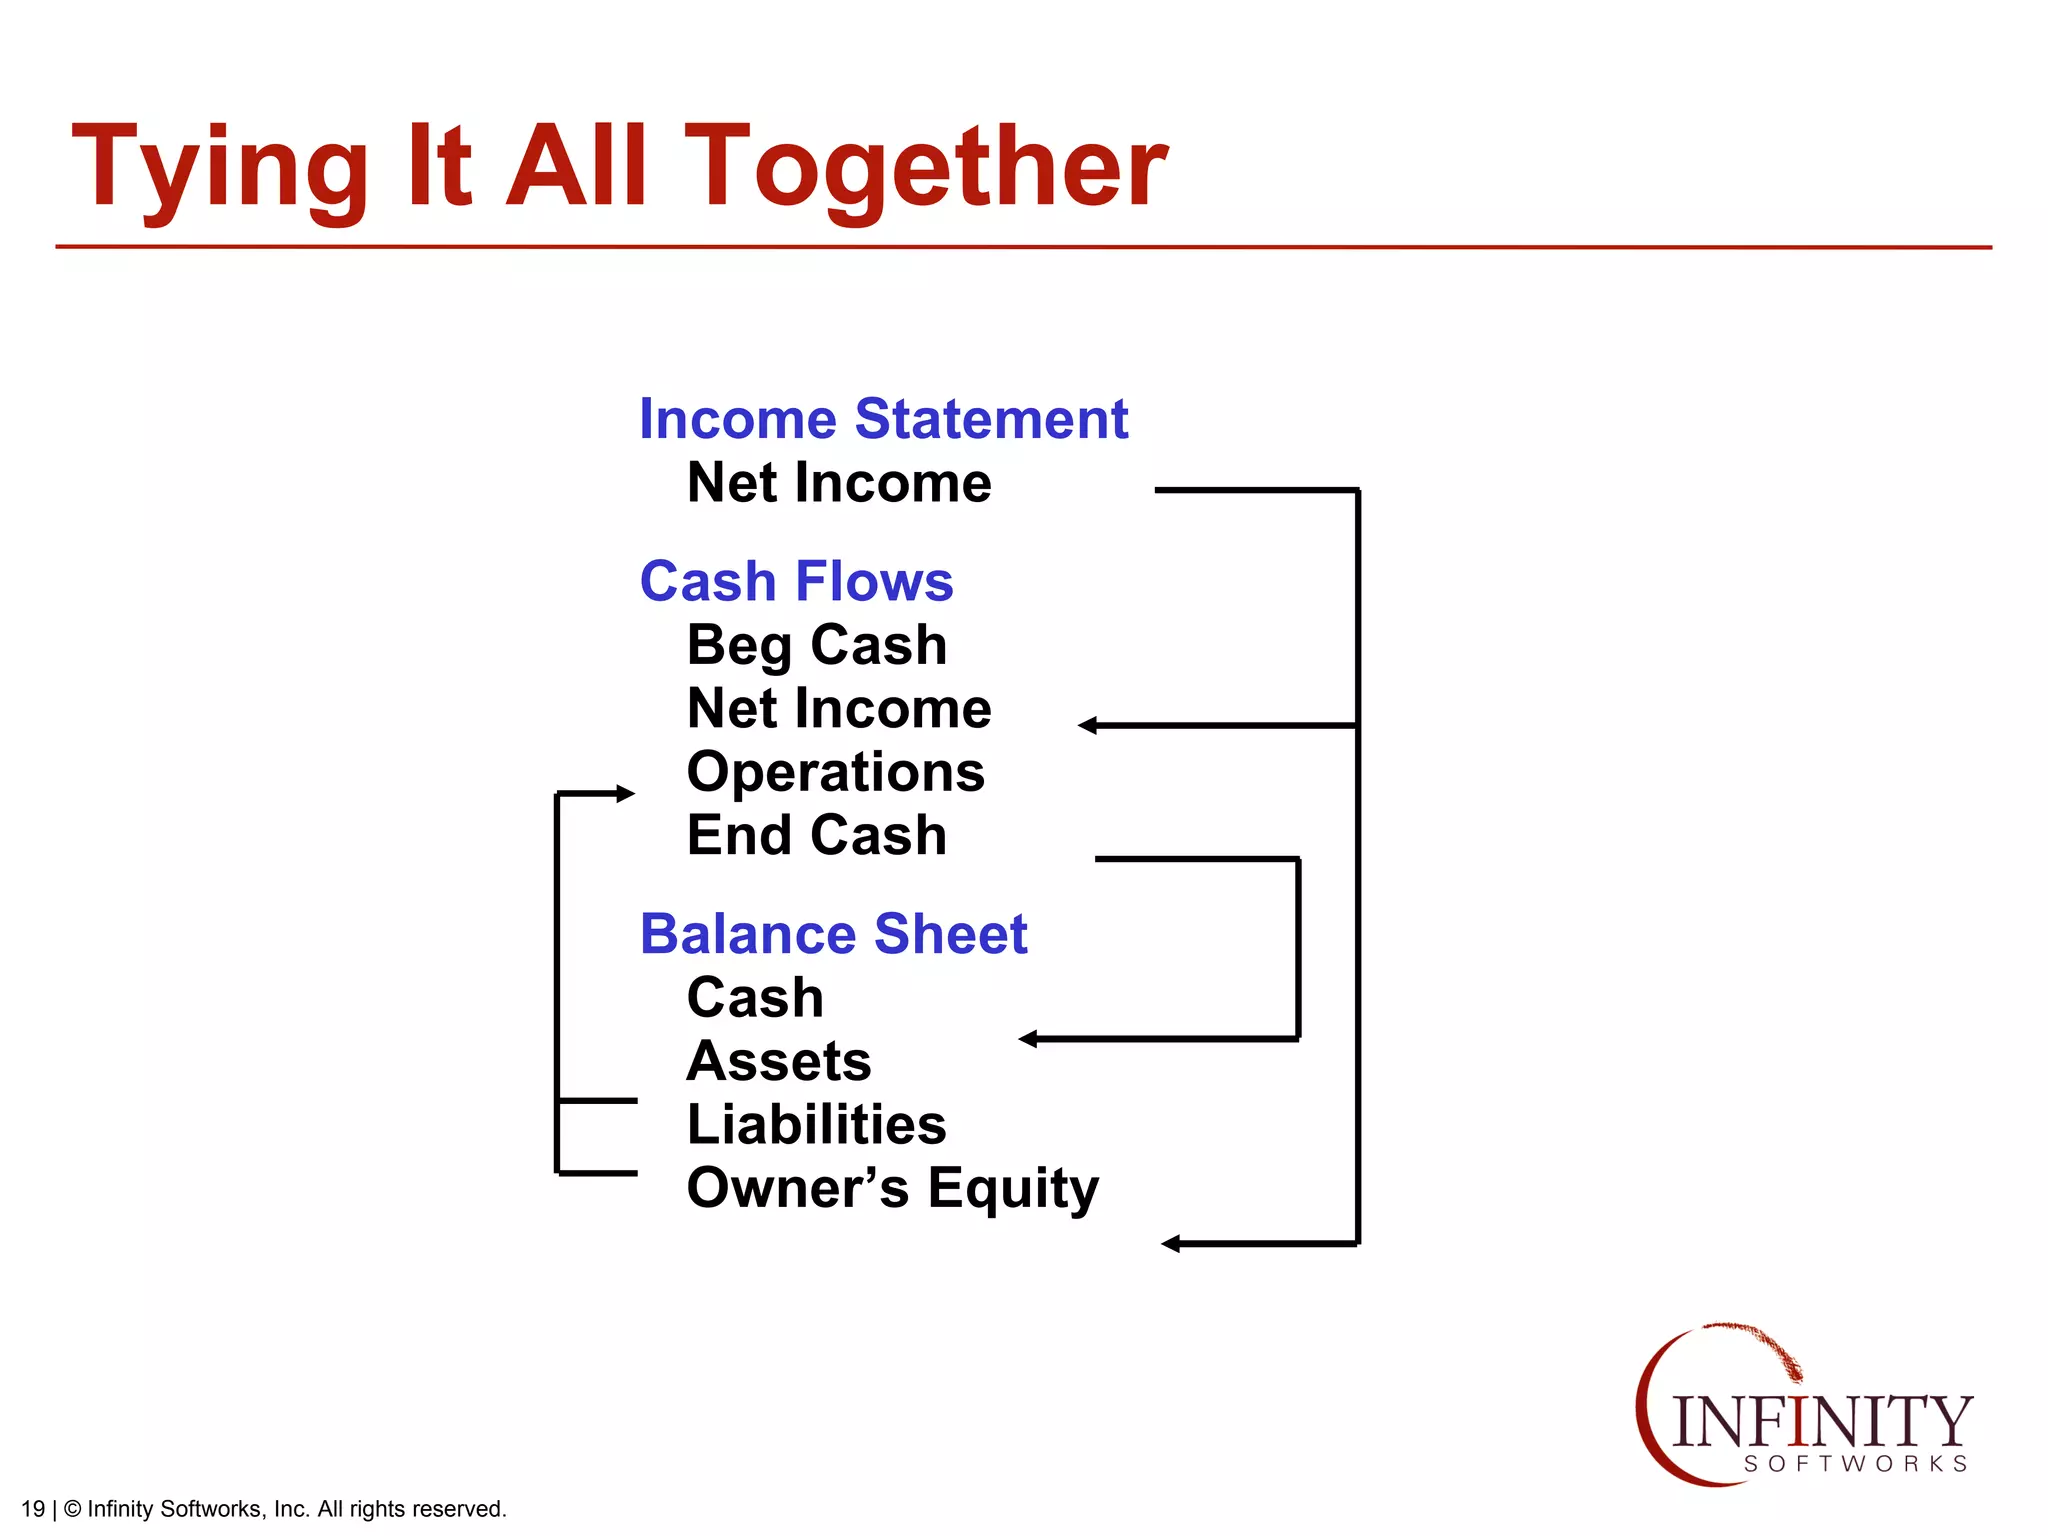
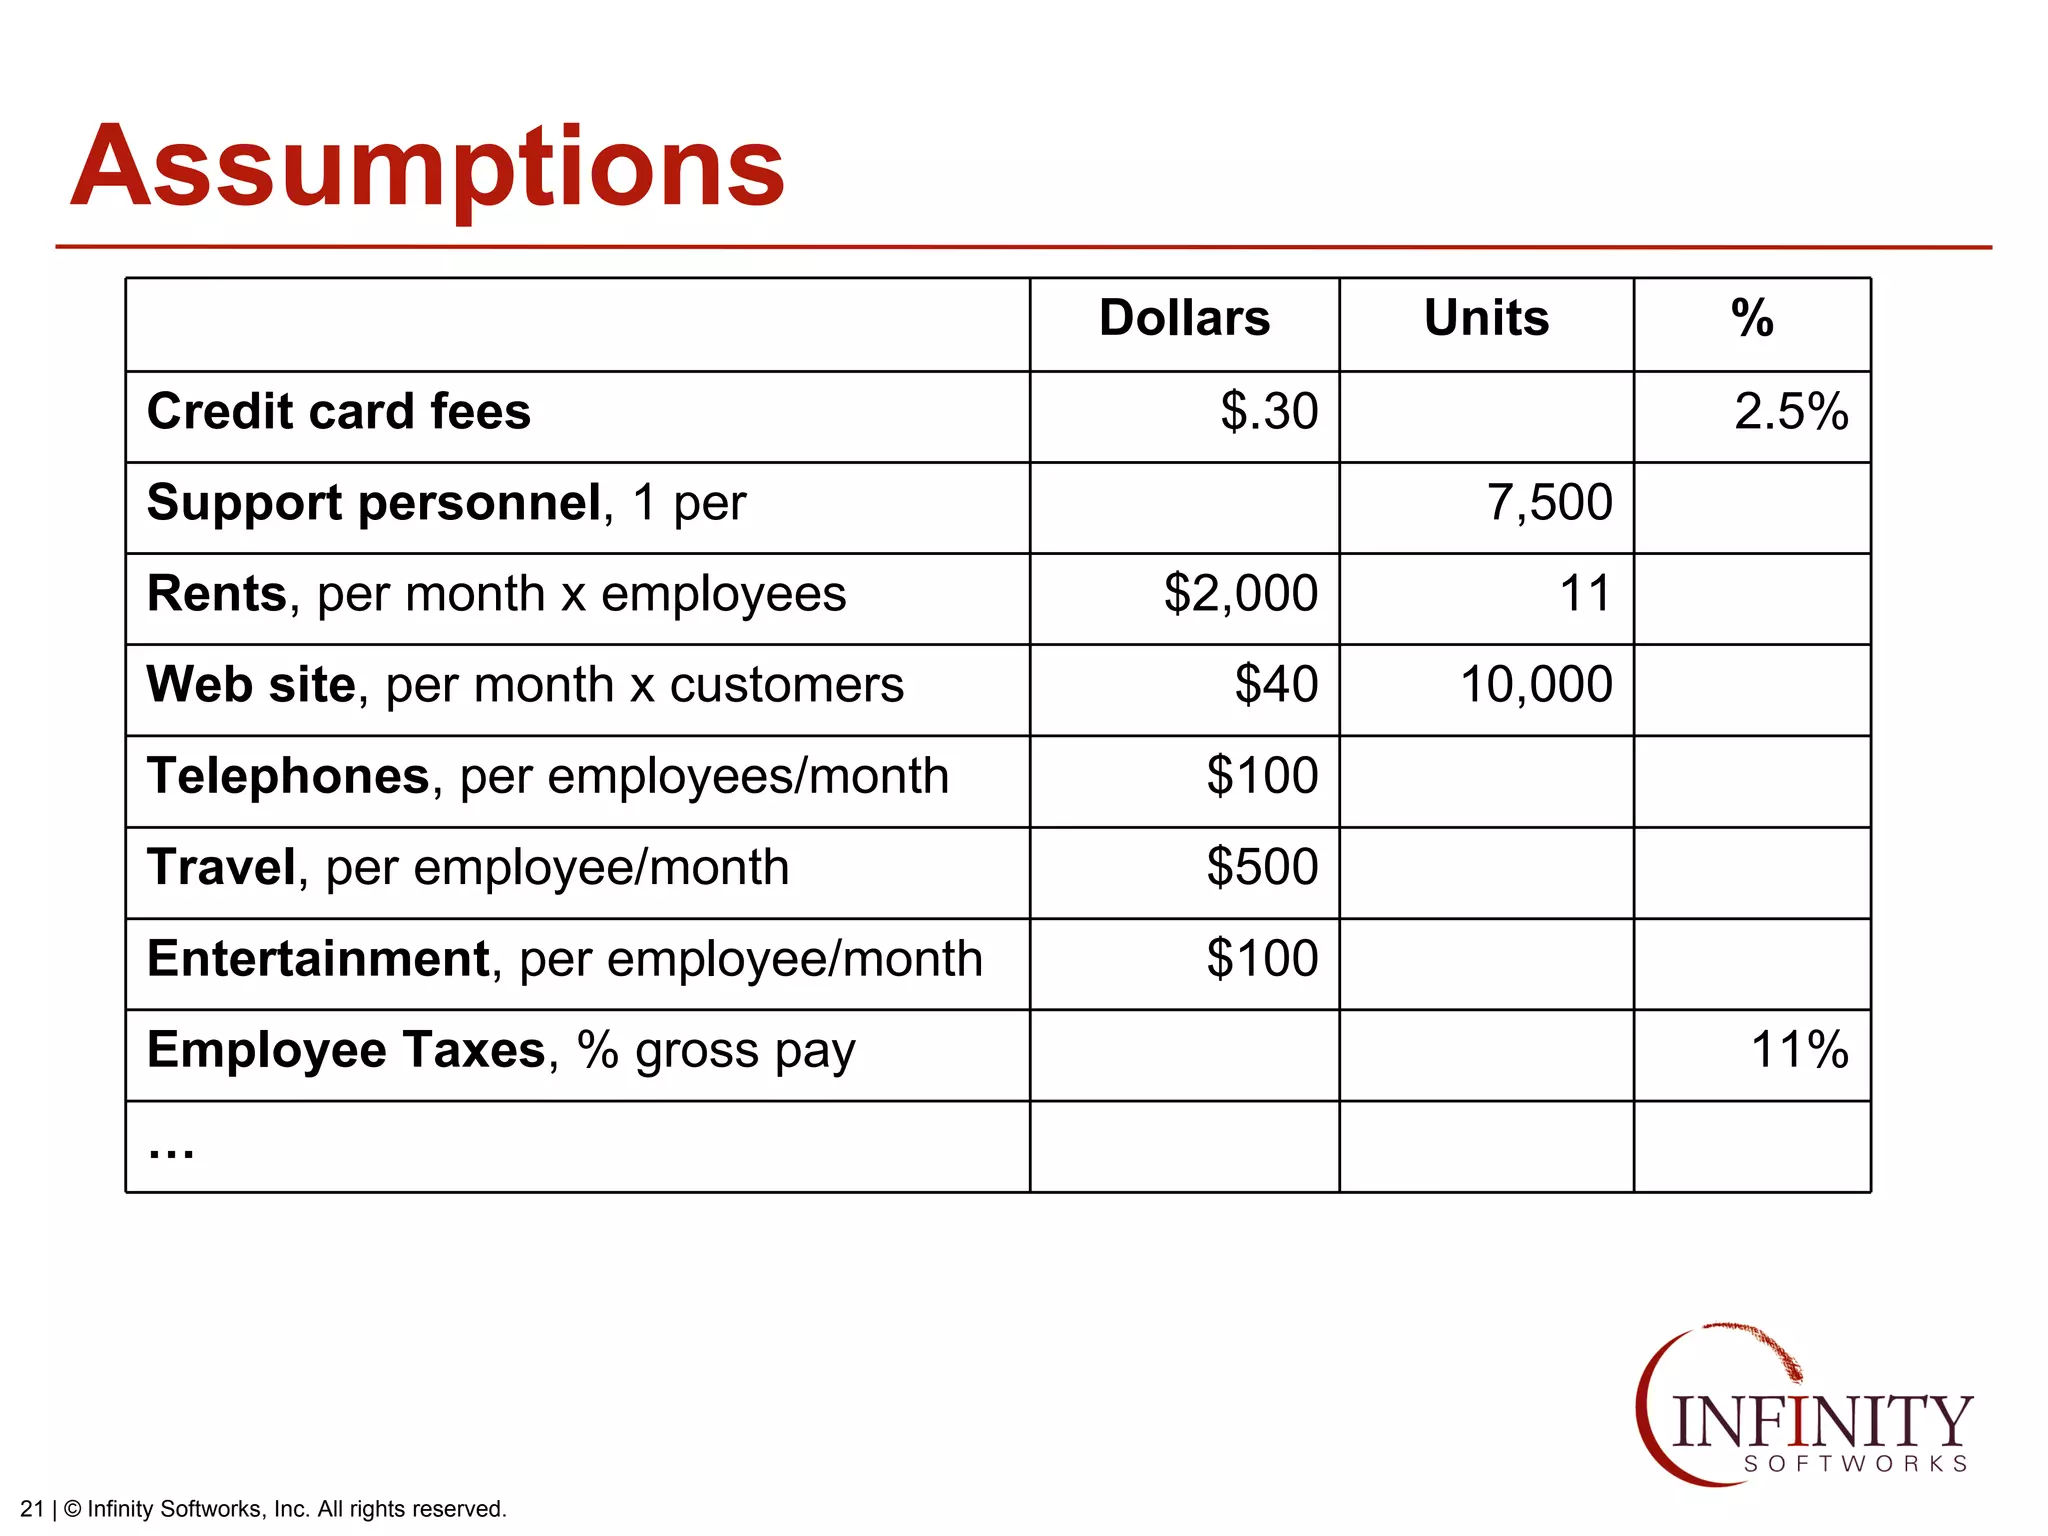
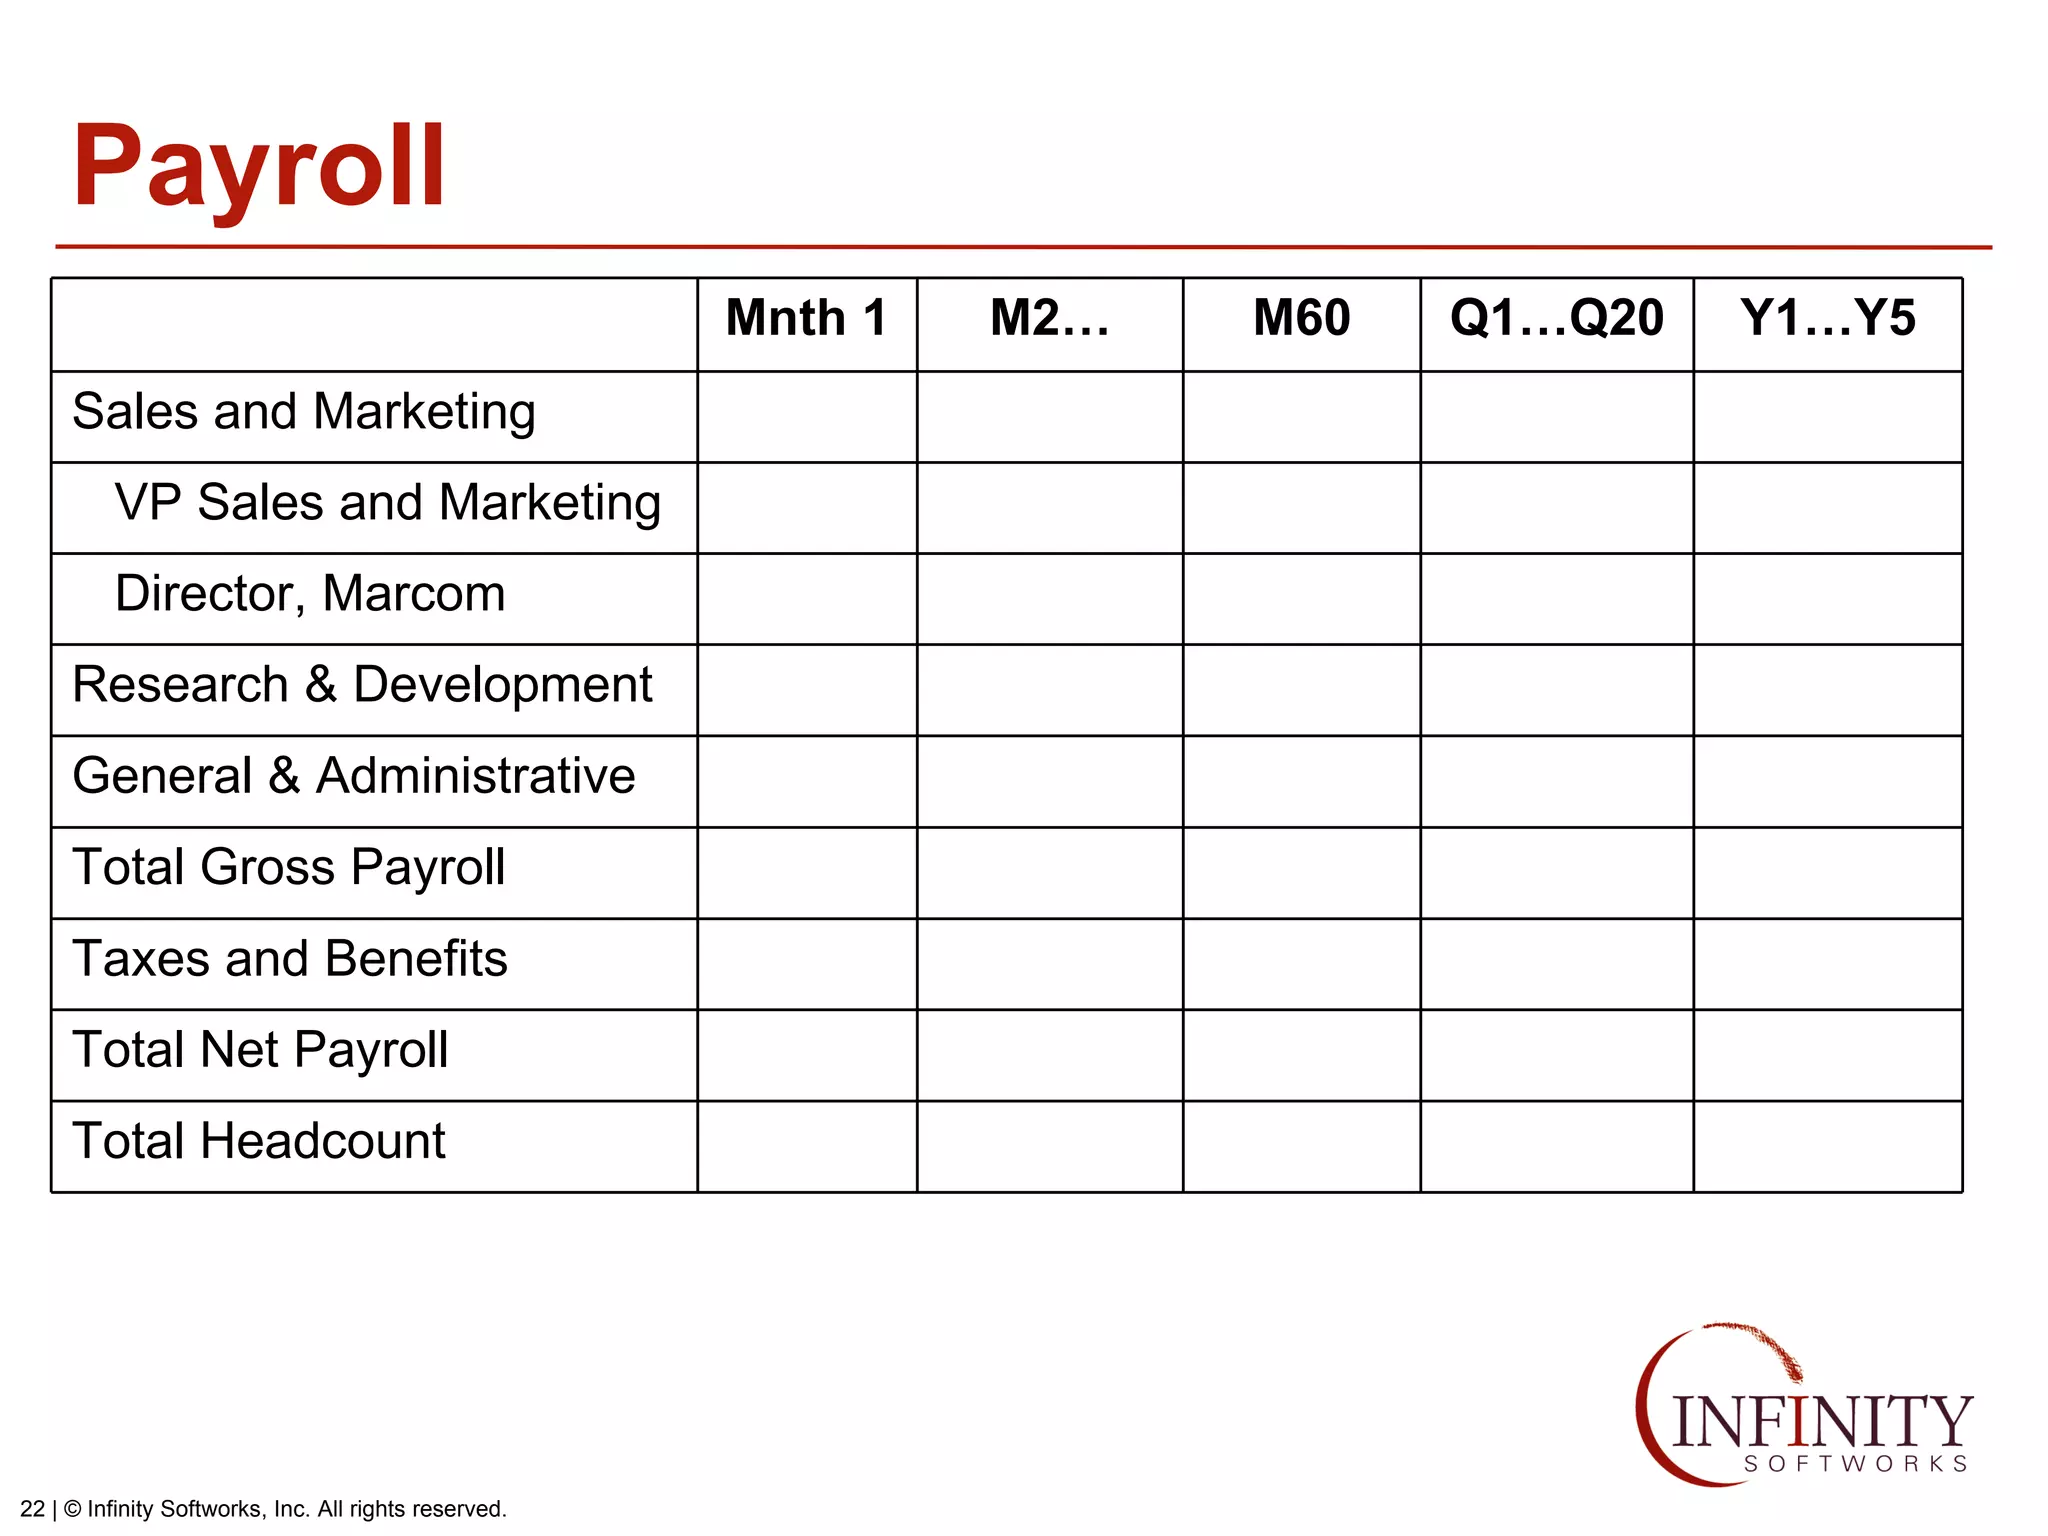
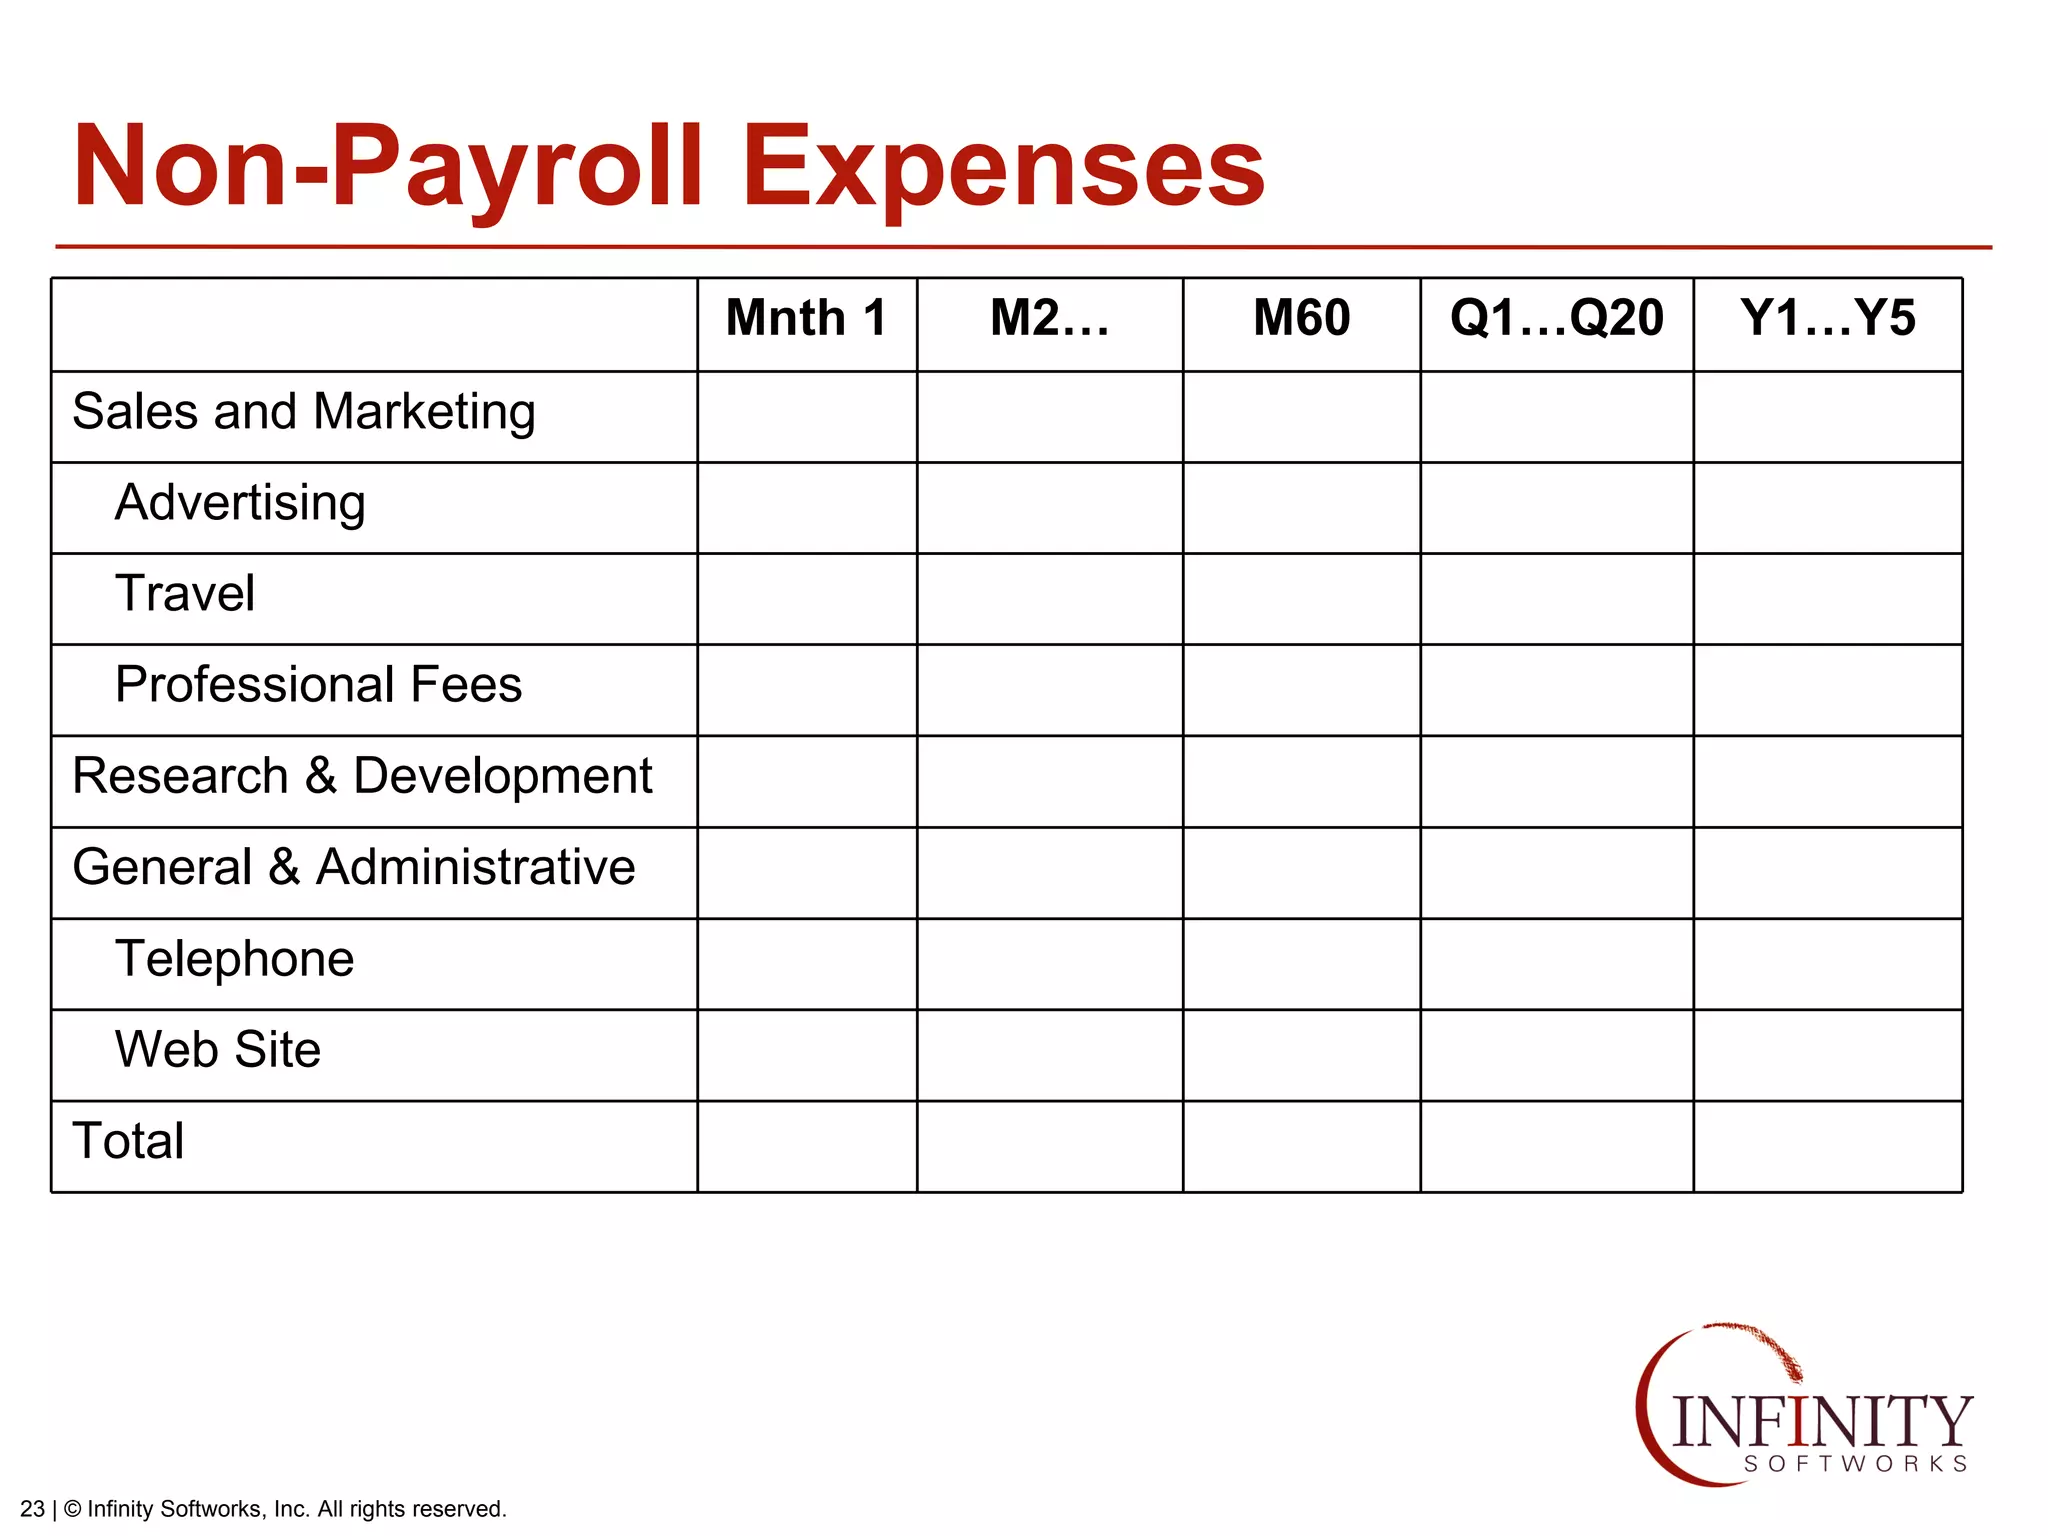
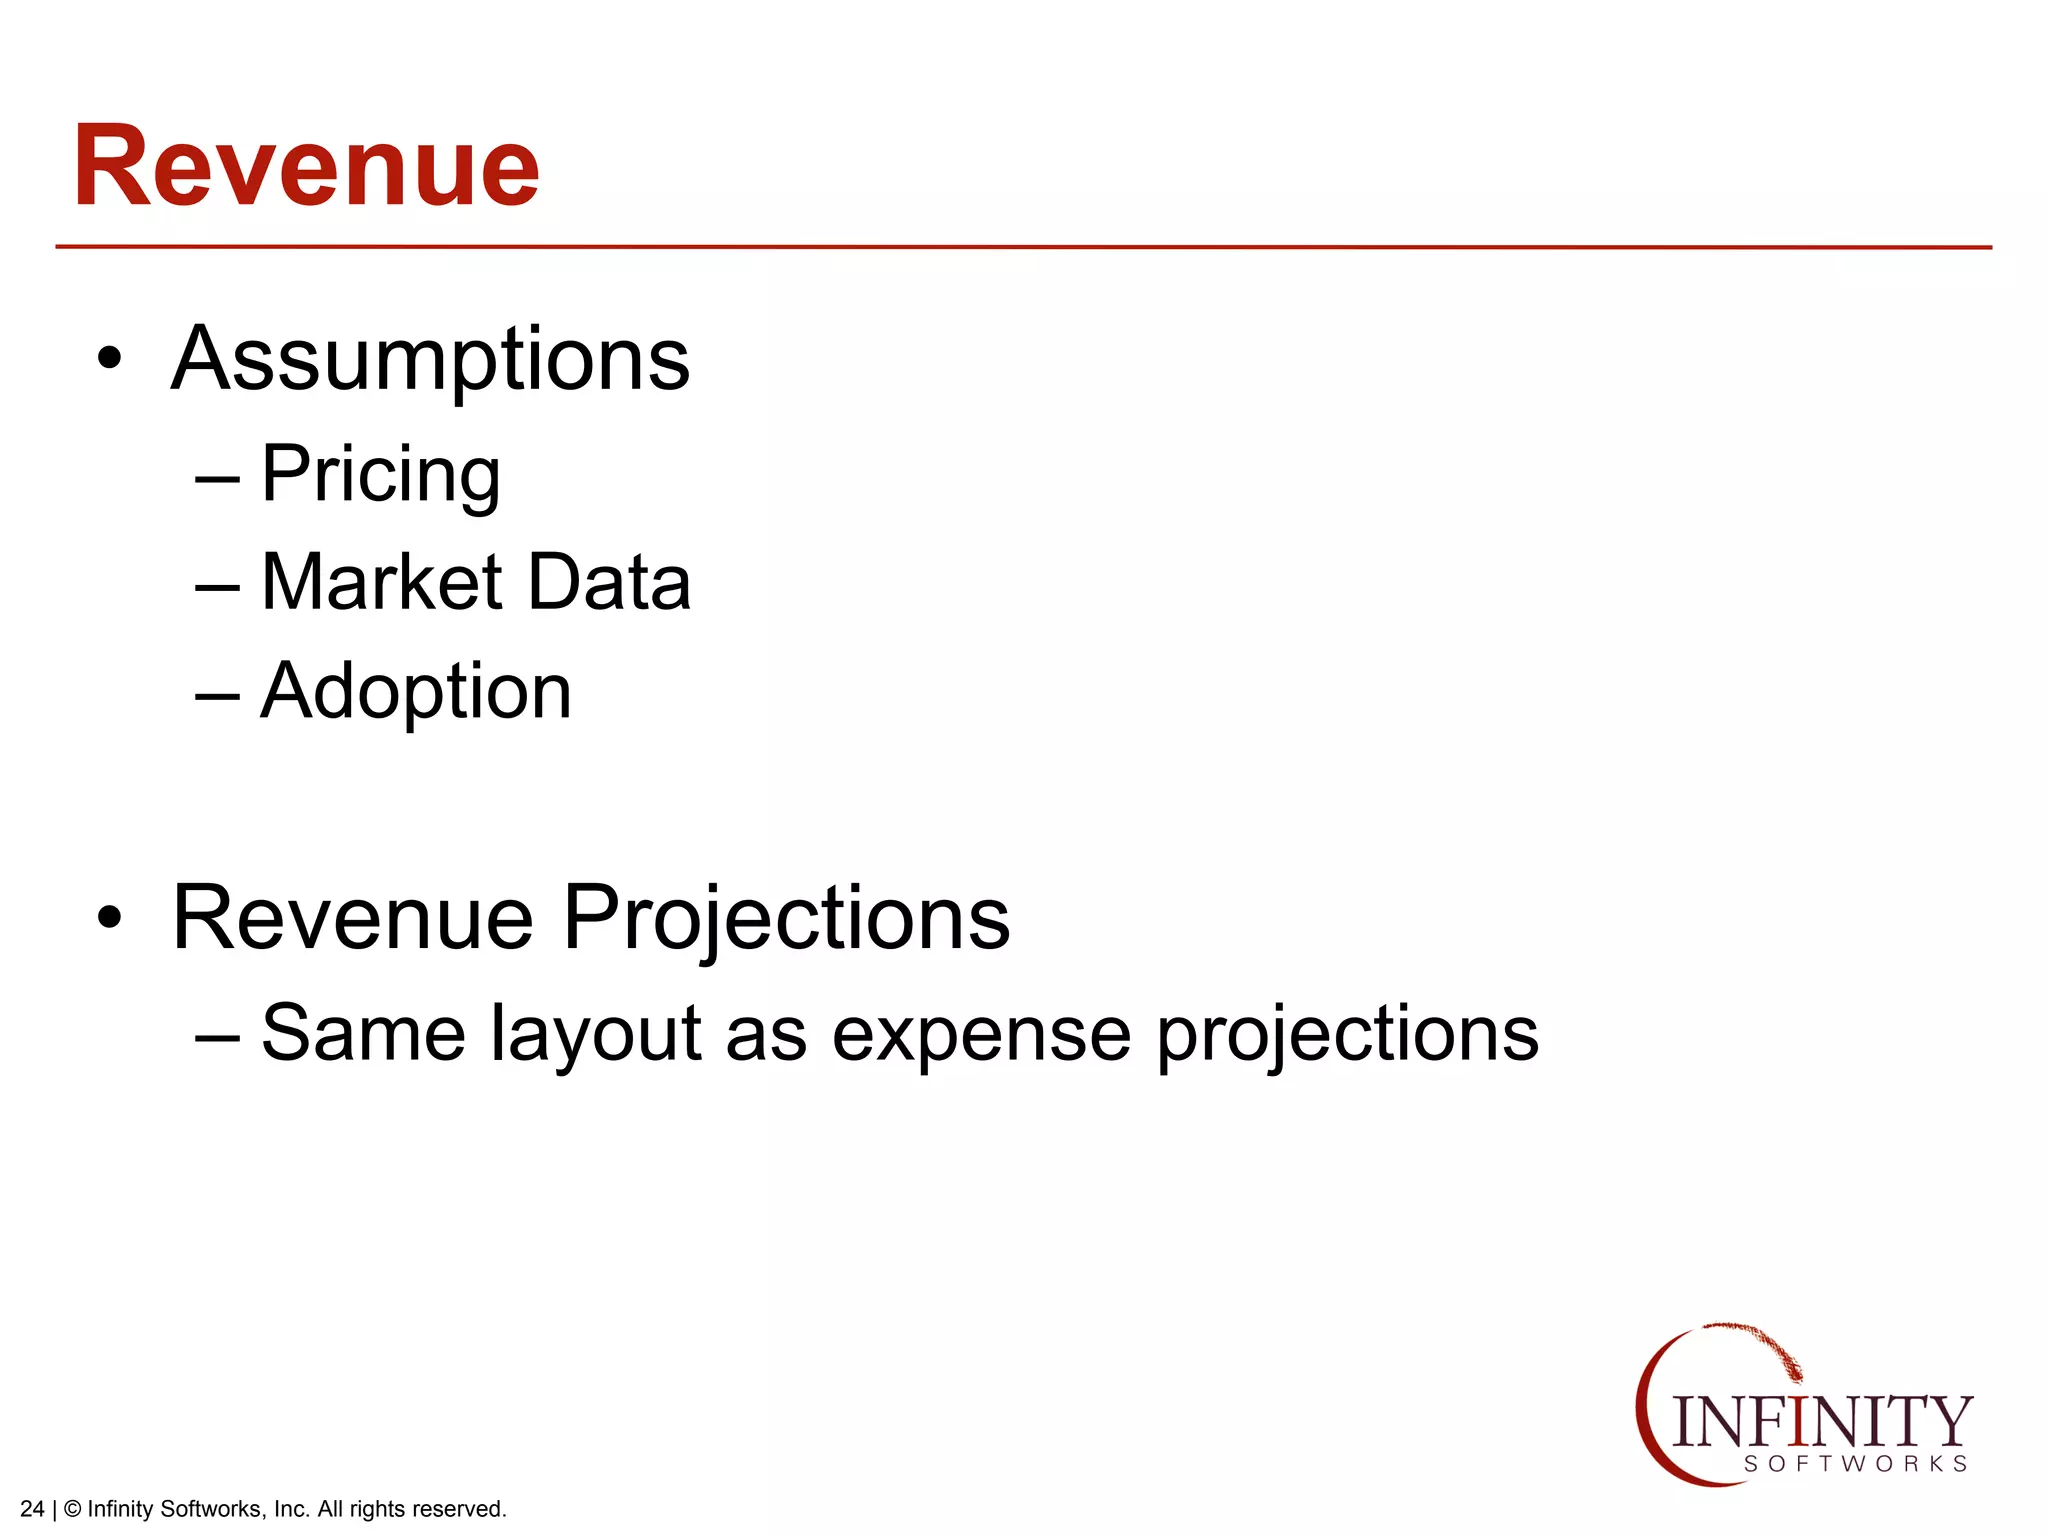
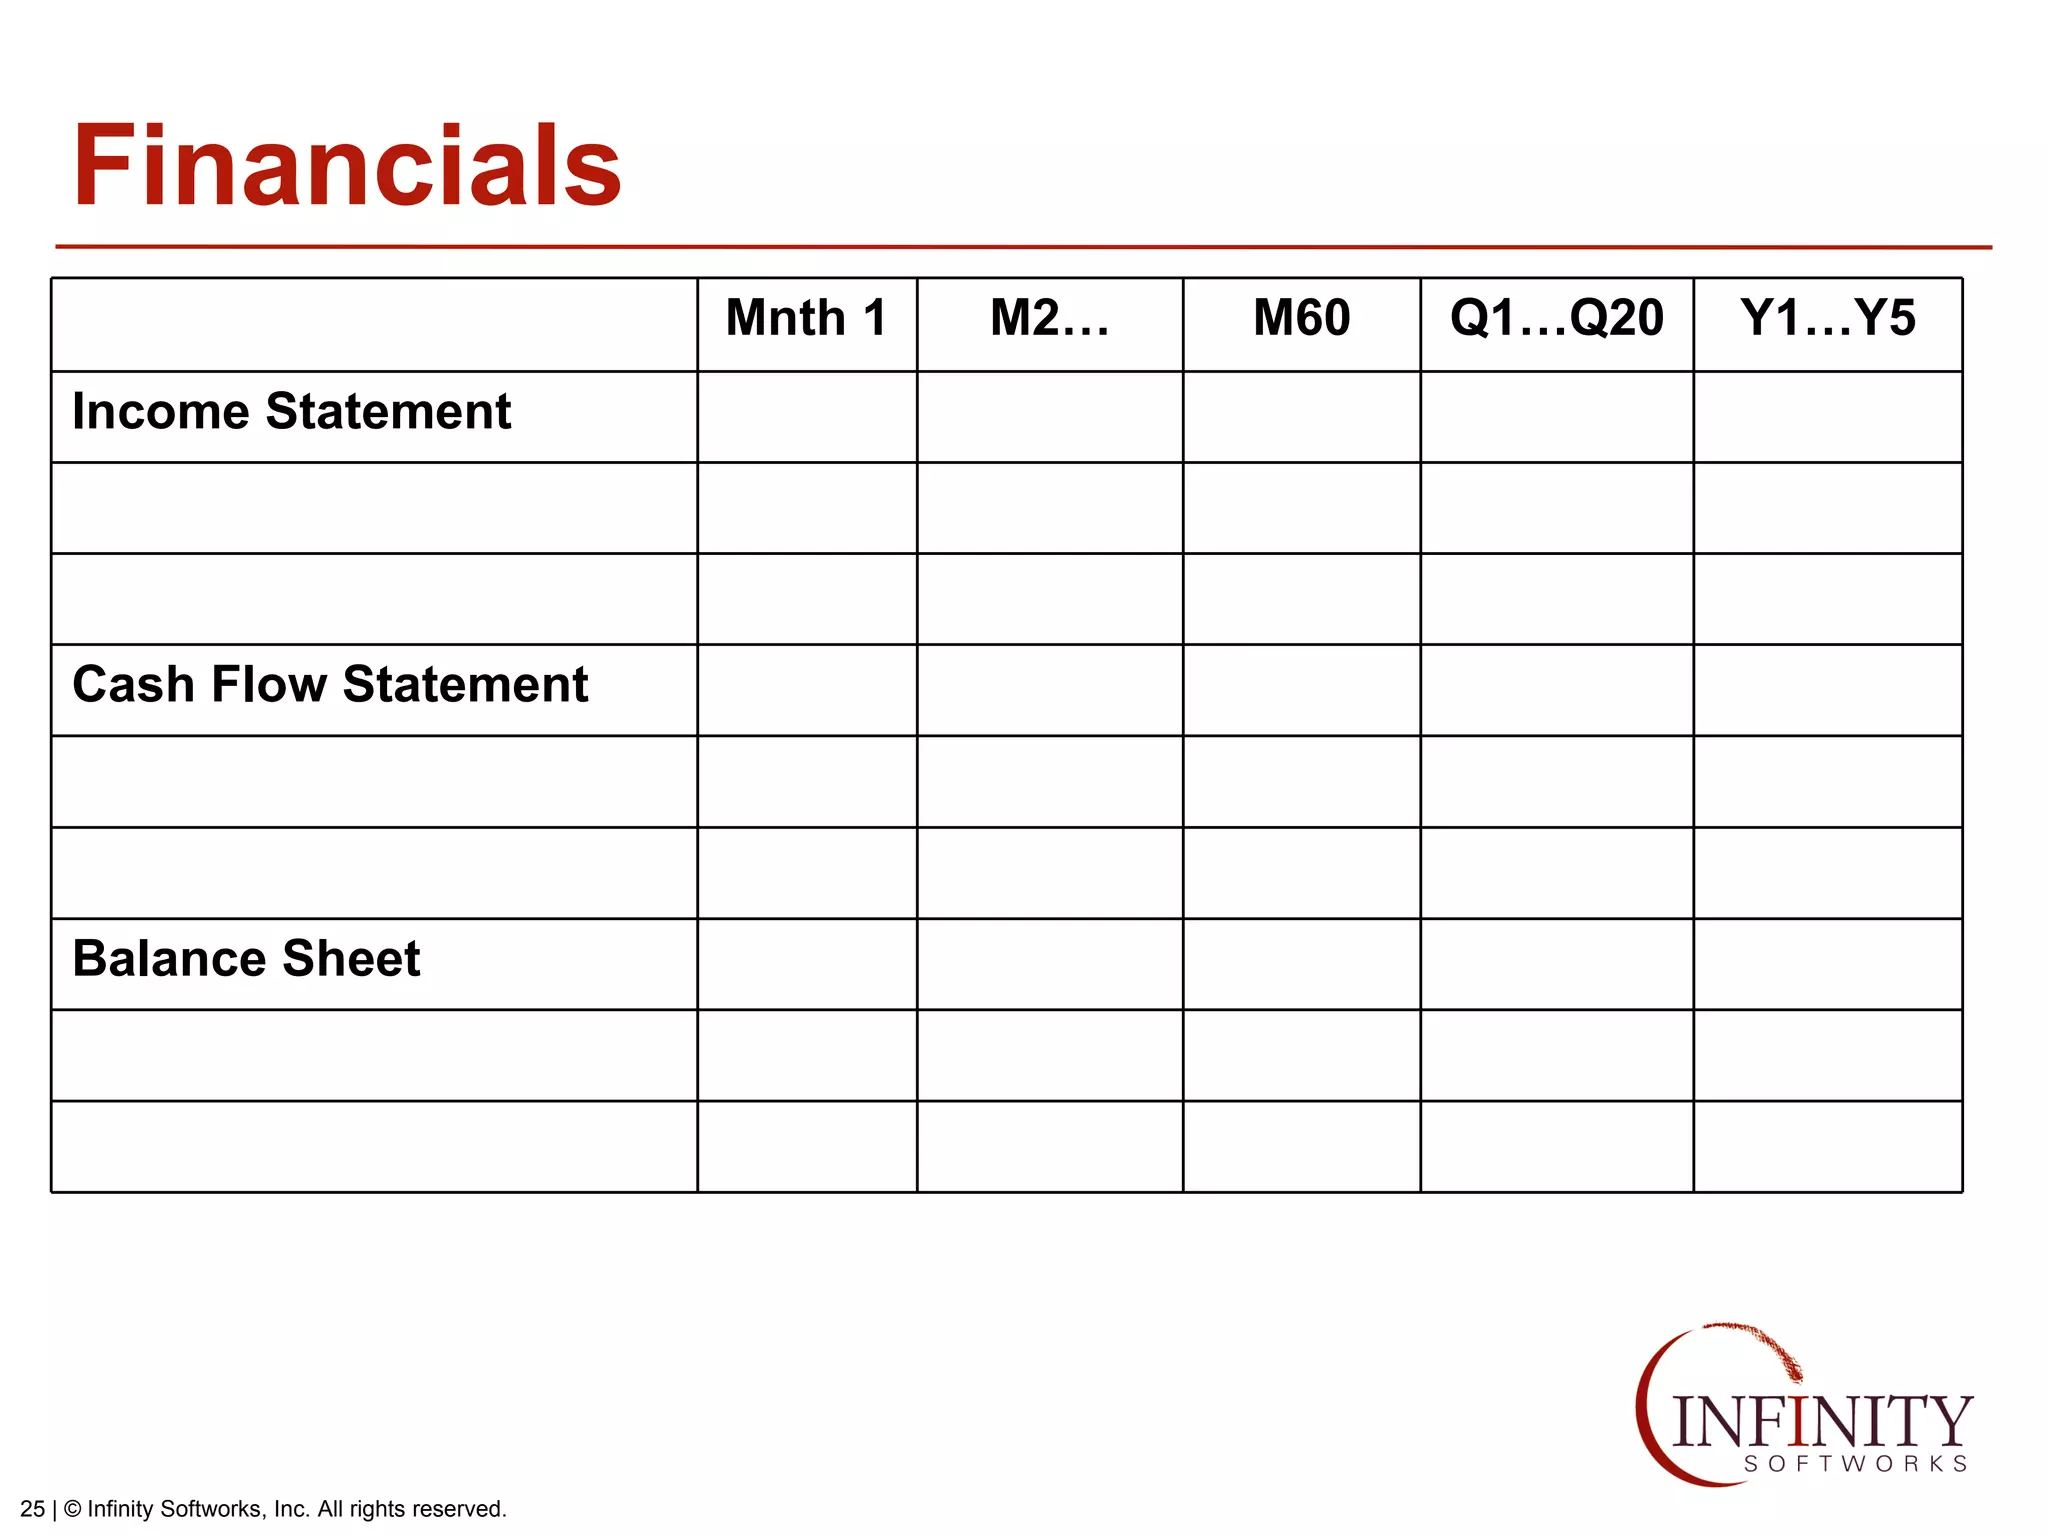
Creating/Understanding Financial Statements Elia Freedman   http://mobilesuccess.infinitysw.com
Overview Three core components Income Statement (Profit and Loss) Balance Sheet Cash Flow Statement Constructing Financials
Income Statement (IS) Measures company performance over a time period Includes Income and Expenses Answers… Am I making money? How are resources managed?
Income Statement Sample Period From XXX to YYY  ($ in thousands) $1,500 Research and Development $600 General and Administrative $1,900 Sales and Marketing Operating Expenses $480 Net Income $320 Other Expense $10 Other Income $800 EBITDA $4,000 Total Operating Expenses $4,800 Gross Margin $200 Cost of Goods Sold $5,000 Net Revenue
IS: Net Revenue Revenue recognized when goods are shipped or payment received Net Revenue equals Gross Revenue –  Returns and Allowances –  Bad Debts –  Discounts
IS: Cost of Goods Sold (COGS) COGS relate to revenues: the goods sold during that period COGS equals Retailers/Wholesalers: price paid for goods sold Manufacturers: cost to manufacture goods Service/Professional Companies: none Web services/Software download: none
IS: Operating Expenses Operating Expenses equals Expenses from Sales/Marketing (S/M) Expenses from Research/Development (R/D) Expenses from General/Administrative (G/A) S/M: costs to sell and market R/D: costs to create G/A: other costs (overhead)
IS: Other Income/Expenses Other Income Income from outside of normal business Examples: interest income, dividend income, capital gains Other Expenses Expenses from outside normal business Examples: unexpected losses (write-downs), interest payments, taxes
Balance Sheet (BS) Snapshot of company at a point in time Includes Assets, Liabilities, Owner’s Equity Answers:  What are my assets? Which assets are cash or nearly cash? How much of the assets are owned by debtors (liabilities) v. (owner’s) equity holders? What liabilities are due soon? ASSETS MUST EQUAL LIABILITIES + OWNER’S EQUITY
Balance Sheet Sample $6,550 Total Liabilities + Owner’s Equity As Of XXX  ($ in thousands) $6,550 Total Assets $50 Long-Term Assets  $250 Inventory $3,300 Owner’s Equity $1,750 Long-Term Debt $1,500 Payables Liabilities + Owner’s Equity $1,250 Receivables $5,000 Cash Assets
BS: Assets Assets have the ability to generate cash Cash: actual cash on hand Receivables: cash due to you for previous period sales Inventory: inventory on-hand Depreciable Assets: assets that are being depreciated (equipment, servers, etc.)
BS: Liabilities Liabilities are debt claims against assets Payables: cash owed to others near-term Accounts Payable Payroll Taxes Payable Taxes Payable Long-Term Debt: loan amounts outstanding
BS: Owner’s Equity O.E. is owner’s interest in the assets Owner’s Equity equals Begin Retained Earnings + Net Income: from the income statement –  Dividends: paid during the period = End Retained Earnings + Capital Stock: from previous periods + Paid-In Capital: new capital sold
Cash Flows (CF) Tracks cash changes from one period to another (CASH IS KING!) Includes cash from operations, investment and financing Answers: Where did cash come from? Where did cash go?
Cash Flow Sample Operations ($1,200) Inventory ($50) Depreciation ($2,300) Payables $5,000 Ending Cash Period From XXX to YYY  ($ in thousands) $300 Cash from Operations ($1,750) Long-Term Debt $0 Cash from Investing $200 Cash from Financing $800 Receivables $4,800 Net Income $4,500 Beginning Cash
CF: Operations Cash from operating the business Calculate difference in each account (Current Period – Last Period) Calculate Cash Flow from Operations Net Income –  Asset Accounts (excluding cash) + Liability Accounts
CF: Financing Cash from debt, equity and dividends Add inflows of cash Subtract outflows of cash Examples: Borrow or payback money Issue or buy company stock Pay dividends
CF: Investing Cash from buying, selling or paying for assets Add inflows of cash Subtract outflows of cash Examples Sell or buy equipment, land or buildings Lend money, receive loan payments Buy, sell cash equivalents
Tying It All Together Income Statement   Net Income Cash Flows   Beg Cash   Net Income   Operations   End Cash Balance Sheet   Cash   Assets   Liabilities   Owner’s Equity
Building the Projections
Assumptions $100 $500 $100 $40 $2,000 $.30 Dollars … Employee Taxes , % gross pay Entertainment , per employee/month Travel , per employee/month Telephones , per employees/month Web site , per month x customers Rents , per month x employees Support personnel , 1 per Credit card fees 2.5% 10,000 11% 11 7,500 % Units
Payroll Q1…Q20 Mnth 1 M2… Total Headcount Total Net Payroll Taxes and Benefits Total Gross Payroll General & Administrative Research & Development Director, Marcom VP Sales and Marketing Sales and Marketing Y1…Y5 M60
Non-Payroll Expenses Q1…Q20 Mnth 1 M2… Total Web Site Telephone General & Administrative Research & Development Professional Fees Travel Advertising Sales and Marketing Y1…Y5 M60
Revenue Assumptions Pricing Market Data Adoption Revenue Projections Same layout as expense projections
Financials Q1…Q20 Mnth 1 M2… Balance Sheet Cash Flow Statement Income Statement Y1…Y5 M60
Questions/Next Session/Contact Elia Freedman http://mobilesuccess.infinitysw.com

Financials: Creating Projections

  • 1.
    Creating/Understanding Financial StatementsElia Freedman http://mobilesuccess.infinitysw.com
  • 2.
    Overview Three corecomponents Income Statement (Profit and Loss) Balance Sheet Cash Flow Statement Constructing Financials
  • 3.
    Income Statement (IS)Measures company performance over a time period Includes Income and Expenses Answers… Am I making money? How are resources managed?
  • 4.
    Income Statement SamplePeriod From XXX to YYY ($ in thousands) $1,500 Research and Development $600 General and Administrative $1,900 Sales and Marketing Operating Expenses $480 Net Income $320 Other Expense $10 Other Income $800 EBITDA $4,000 Total Operating Expenses $4,800 Gross Margin $200 Cost of Goods Sold $5,000 Net Revenue
  • 5.
    IS: Net RevenueRevenue recognized when goods are shipped or payment received Net Revenue equals Gross Revenue – Returns and Allowances – Bad Debts – Discounts
  • 6.
    IS: Cost ofGoods Sold (COGS) COGS relate to revenues: the goods sold during that period COGS equals Retailers/Wholesalers: price paid for goods sold Manufacturers: cost to manufacture goods Service/Professional Companies: none Web services/Software download: none
  • 7.
    IS: Operating ExpensesOperating Expenses equals Expenses from Sales/Marketing (S/M) Expenses from Research/Development (R/D) Expenses from General/Administrative (G/A) S/M: costs to sell and market R/D: costs to create G/A: other costs (overhead)
  • 8.
    IS: Other Income/ExpensesOther Income Income from outside of normal business Examples: interest income, dividend income, capital gains Other Expenses Expenses from outside normal business Examples: unexpected losses (write-downs), interest payments, taxes
  • 9.
    Balance Sheet (BS)Snapshot of company at a point in time Includes Assets, Liabilities, Owner’s Equity Answers: What are my assets? Which assets are cash or nearly cash? How much of the assets are owned by debtors (liabilities) v. (owner’s) equity holders? What liabilities are due soon? ASSETS MUST EQUAL LIABILITIES + OWNER’S EQUITY
  • 10.
    Balance Sheet Sample$6,550 Total Liabilities + Owner’s Equity As Of XXX ($ in thousands) $6,550 Total Assets $50 Long-Term Assets $250 Inventory $3,300 Owner’s Equity $1,750 Long-Term Debt $1,500 Payables Liabilities + Owner’s Equity $1,250 Receivables $5,000 Cash Assets
  • 11.
    BS: Assets Assetshave the ability to generate cash Cash: actual cash on hand Receivables: cash due to you for previous period sales Inventory: inventory on-hand Depreciable Assets: assets that are being depreciated (equipment, servers, etc.)
  • 12.
    BS: Liabilities Liabilitiesare debt claims against assets Payables: cash owed to others near-term Accounts Payable Payroll Taxes Payable Taxes Payable Long-Term Debt: loan amounts outstanding
  • 13.
    BS: Owner’s EquityO.E. is owner’s interest in the assets Owner’s Equity equals Begin Retained Earnings + Net Income: from the income statement – Dividends: paid during the period = End Retained Earnings + Capital Stock: from previous periods + Paid-In Capital: new capital sold
  • 14.
    Cash Flows (CF)Tracks cash changes from one period to another (CASH IS KING!) Includes cash from operations, investment and financing Answers: Where did cash come from? Where did cash go?
  • 15.
    Cash Flow SampleOperations ($1,200) Inventory ($50) Depreciation ($2,300) Payables $5,000 Ending Cash Period From XXX to YYY ($ in thousands) $300 Cash from Operations ($1,750) Long-Term Debt $0 Cash from Investing $200 Cash from Financing $800 Receivables $4,800 Net Income $4,500 Beginning Cash
  • 16.
    CF: Operations Cashfrom operating the business Calculate difference in each account (Current Period – Last Period) Calculate Cash Flow from Operations Net Income – Asset Accounts (excluding cash) + Liability Accounts
  • 17.
    CF: Financing Cashfrom debt, equity and dividends Add inflows of cash Subtract outflows of cash Examples: Borrow or payback money Issue or buy company stock Pay dividends
  • 18.
    CF: Investing Cashfrom buying, selling or paying for assets Add inflows of cash Subtract outflows of cash Examples Sell or buy equipment, land or buildings Lend money, receive loan payments Buy, sell cash equivalents
  • 19.
    Tying It AllTogether Income Statement Net Income Cash Flows Beg Cash Net Income Operations End Cash Balance Sheet Cash Assets Liabilities Owner’s Equity
  • 20.
  • 21.
    Assumptions $100 $500$100 $40 $2,000 $.30 Dollars … Employee Taxes , % gross pay Entertainment , per employee/month Travel , per employee/month Telephones , per employees/month Web site , per month x customers Rents , per month x employees Support personnel , 1 per Credit card fees 2.5% 10,000 11% 11 7,500 % Units
  • 22.
    Payroll Q1…Q20 Mnth1 M2… Total Headcount Total Net Payroll Taxes and Benefits Total Gross Payroll General & Administrative Research & Development Director, Marcom VP Sales and Marketing Sales and Marketing Y1…Y5 M60
  • 23.
    Non-Payroll Expenses Q1…Q20Mnth 1 M2… Total Web Site Telephone General & Administrative Research & Development Professional Fees Travel Advertising Sales and Marketing Y1…Y5 M60
  • 24.
    Revenue Assumptions PricingMarket Data Adoption Revenue Projections Same layout as expense projections
  • 25.
    Financials Q1…Q20 Mnth1 M2… Balance Sheet Cash Flow Statement Income Statement Y1…Y5 M60
  • 26.
    Questions/Next Session/Contact EliaFreedman http://mobilesuccess.infinitysw.com