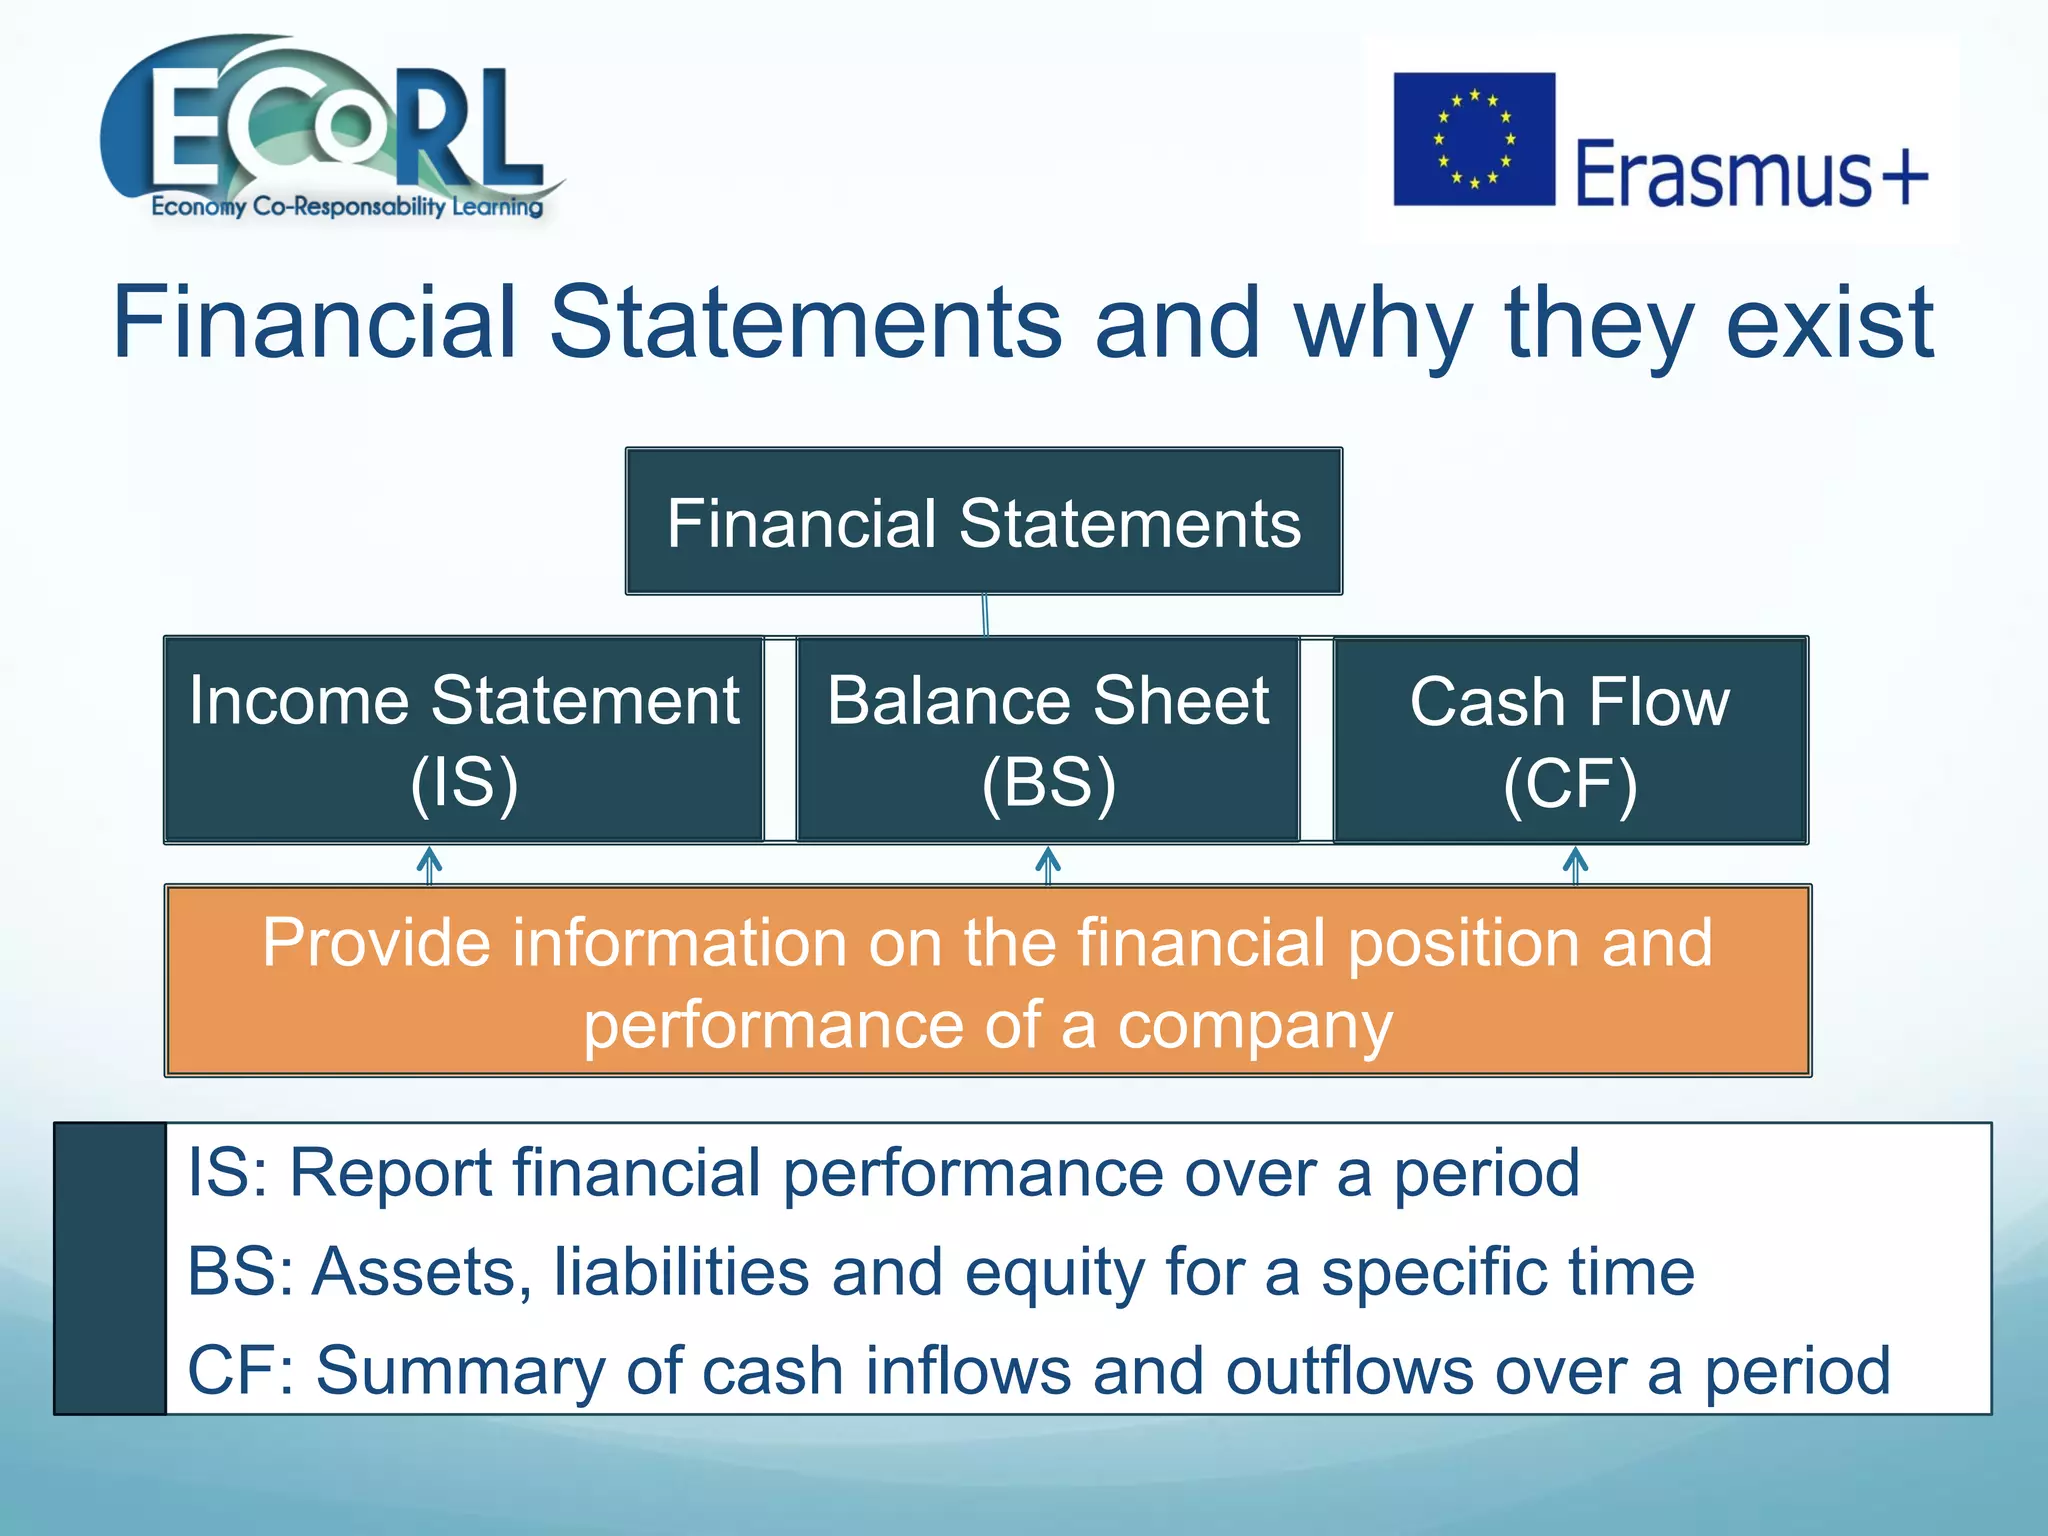
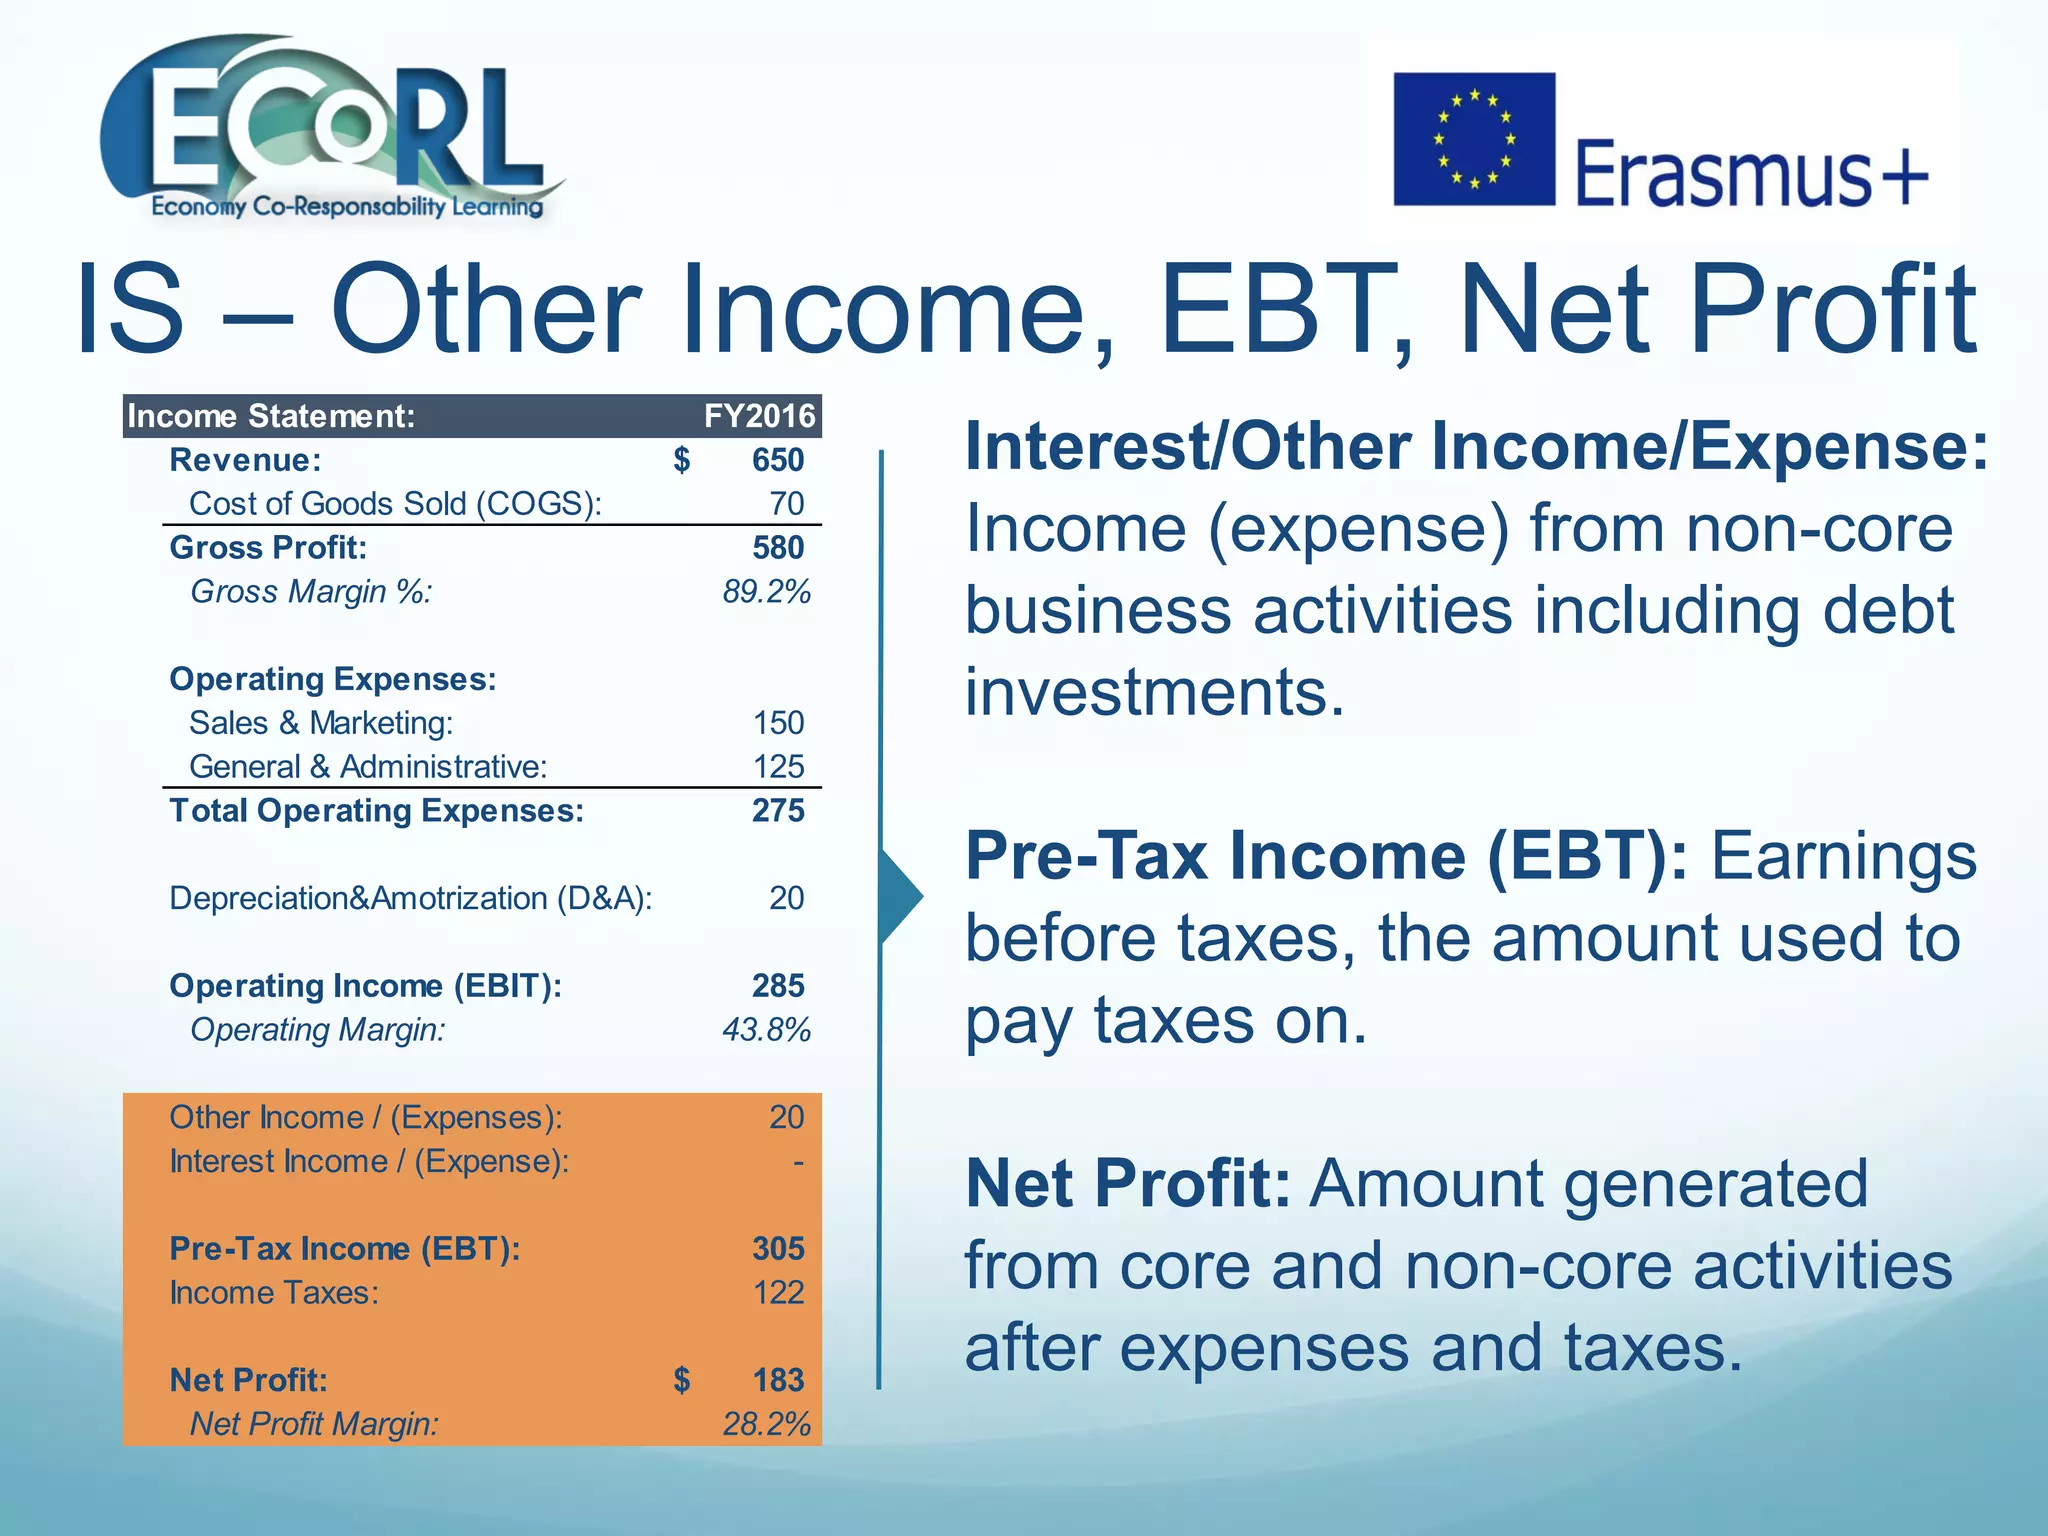
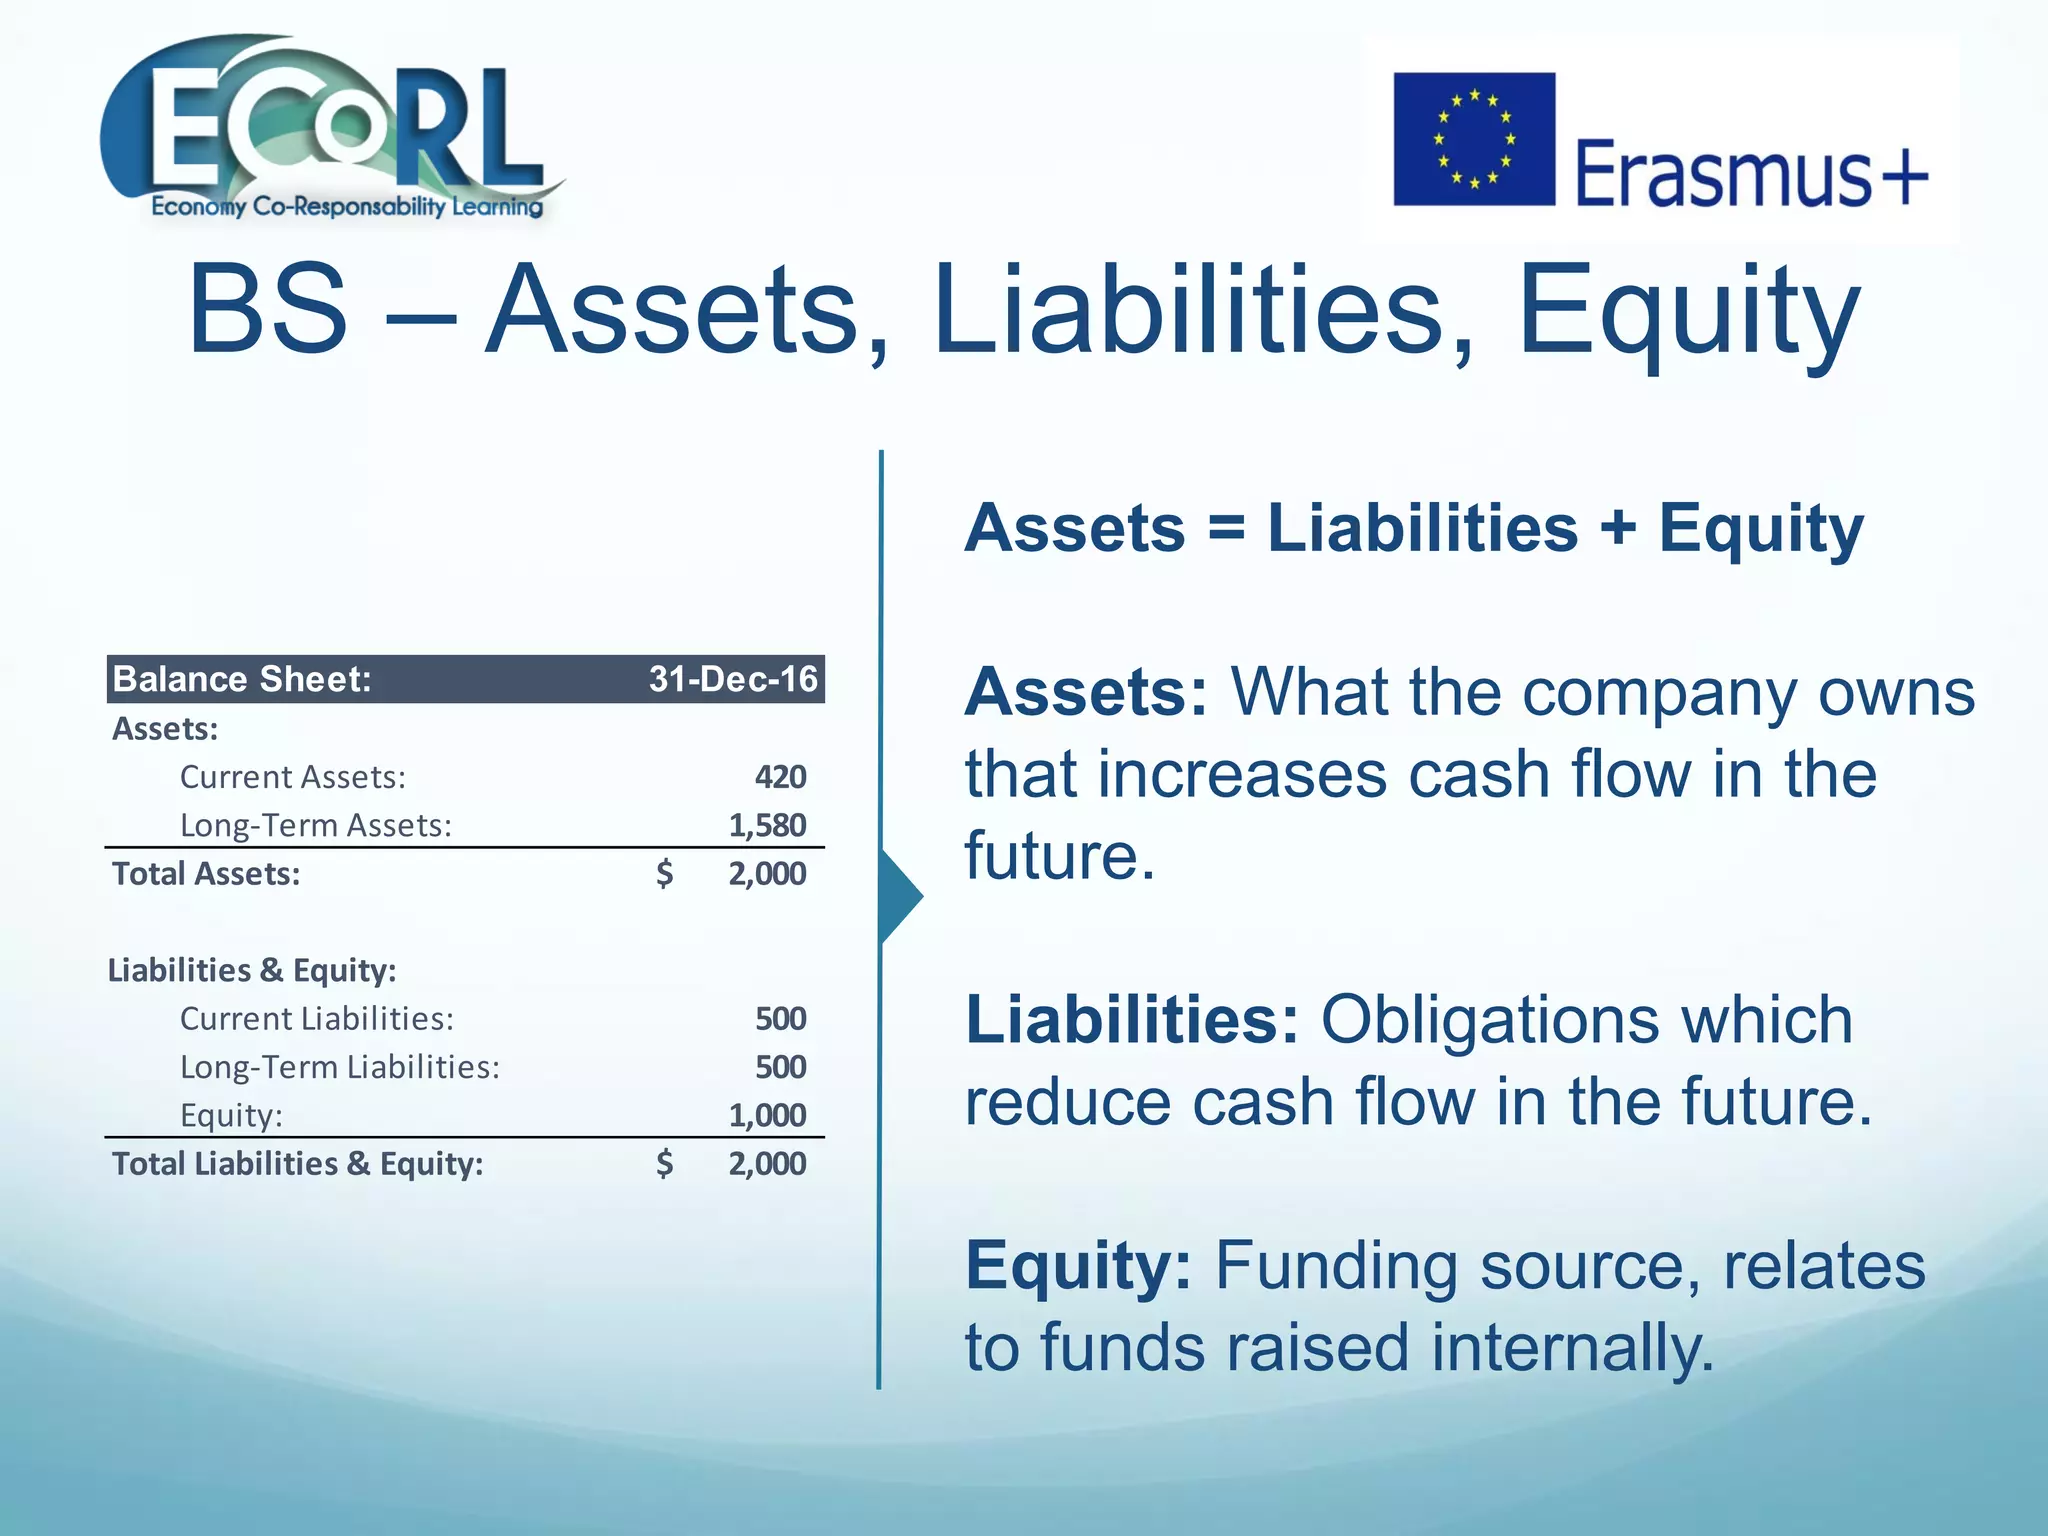
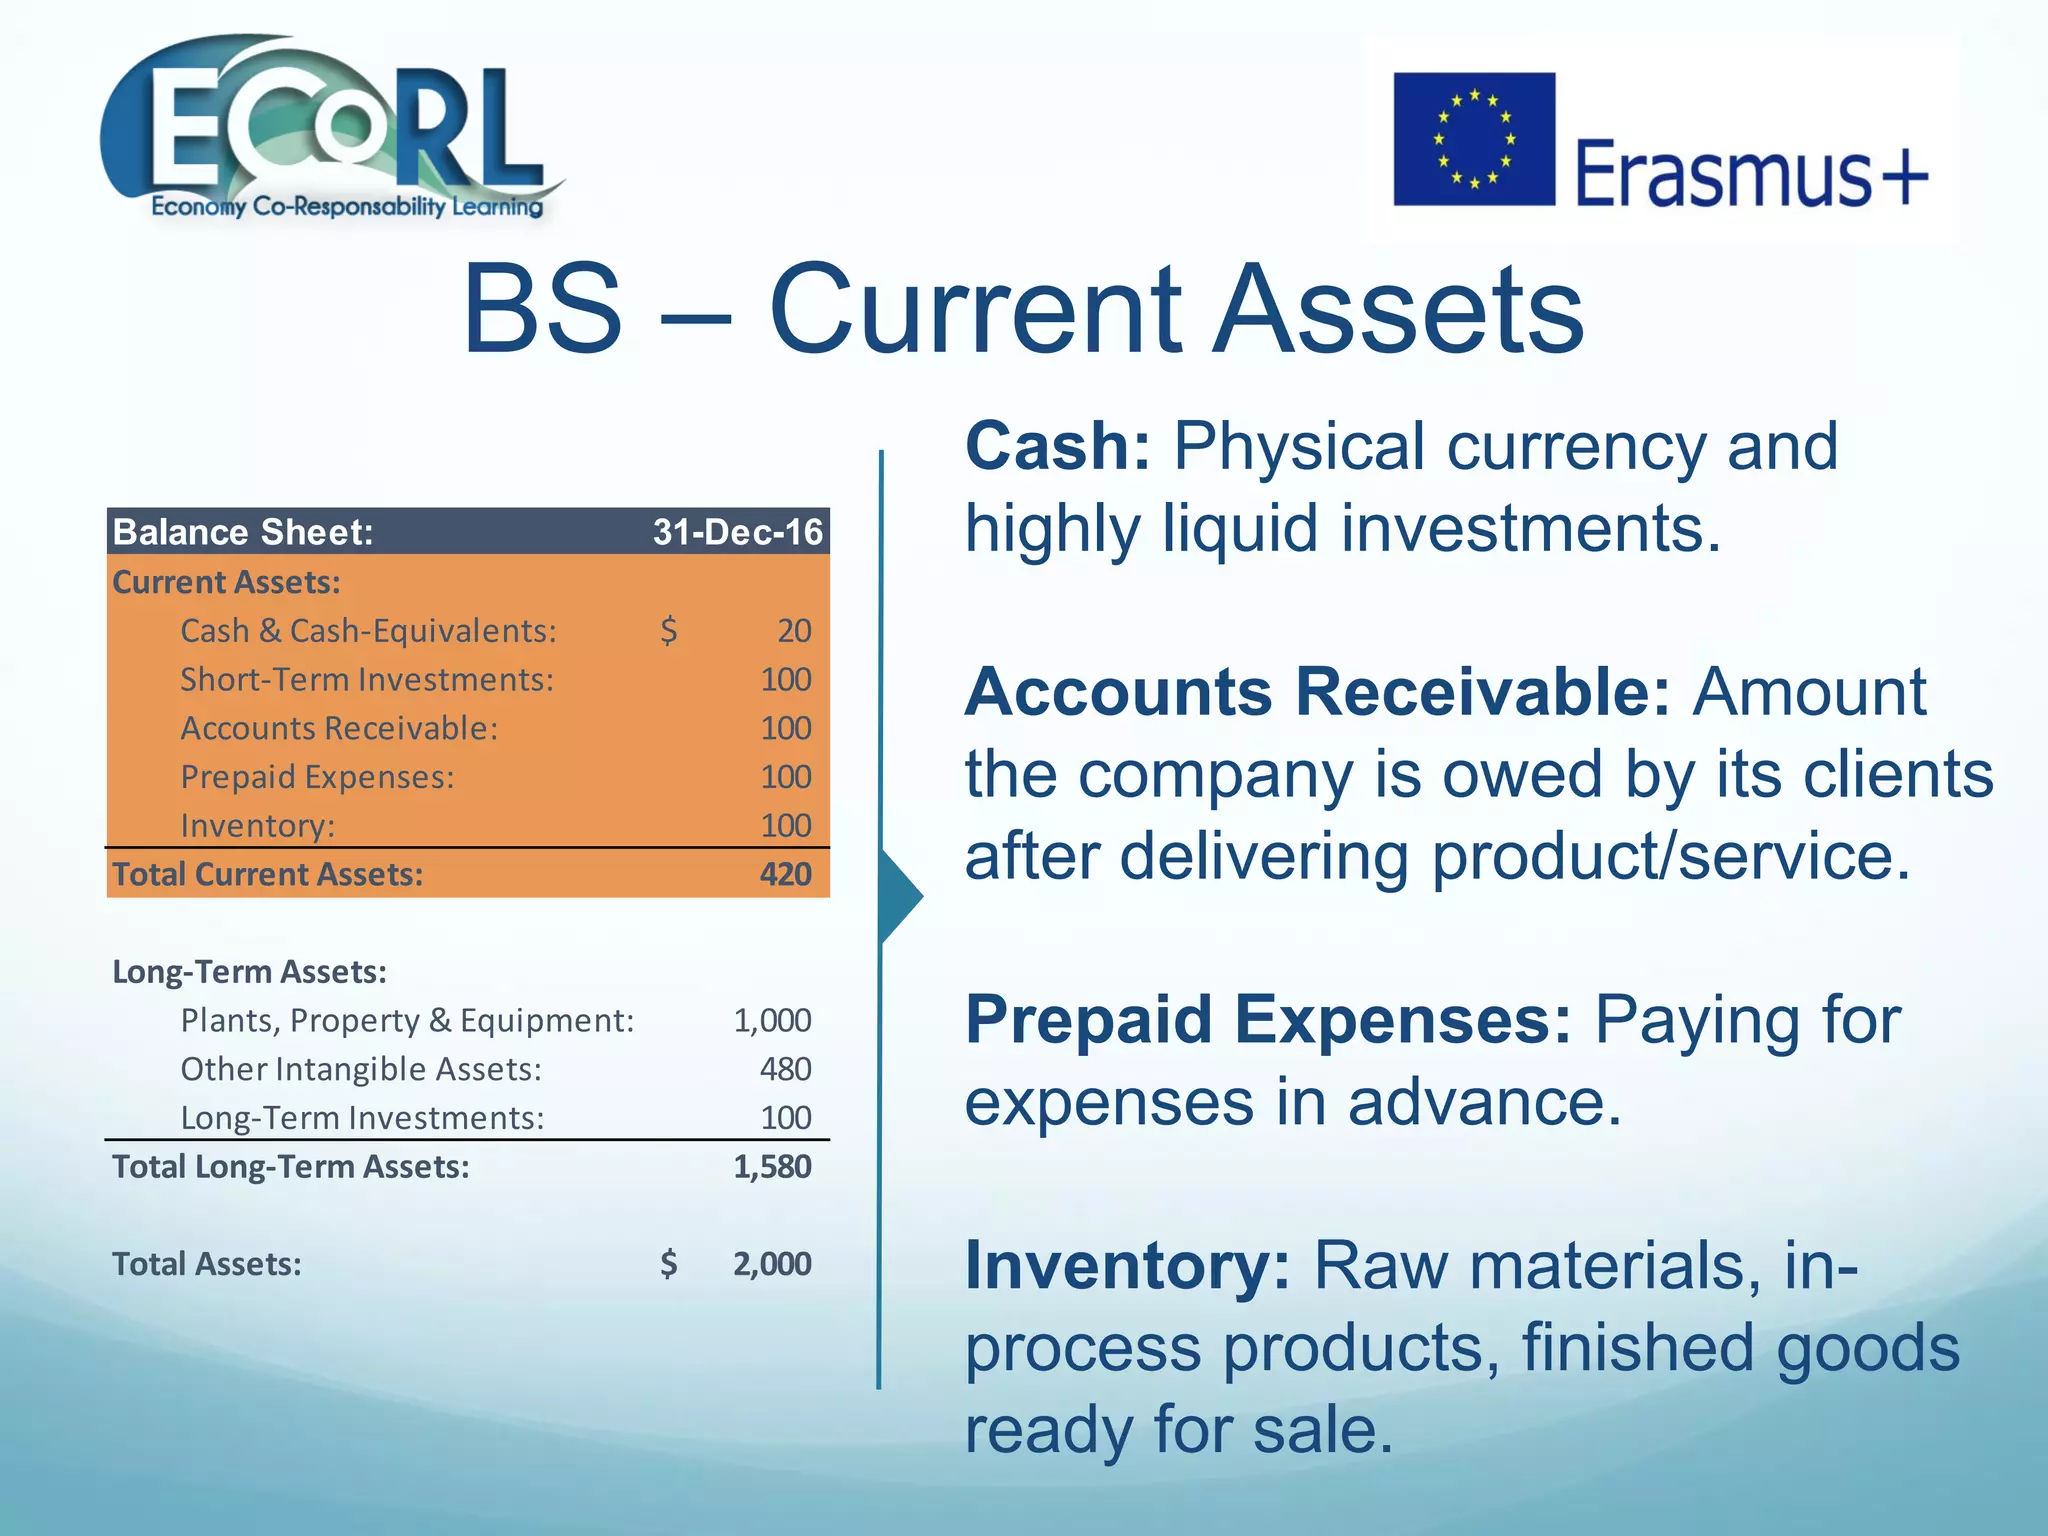
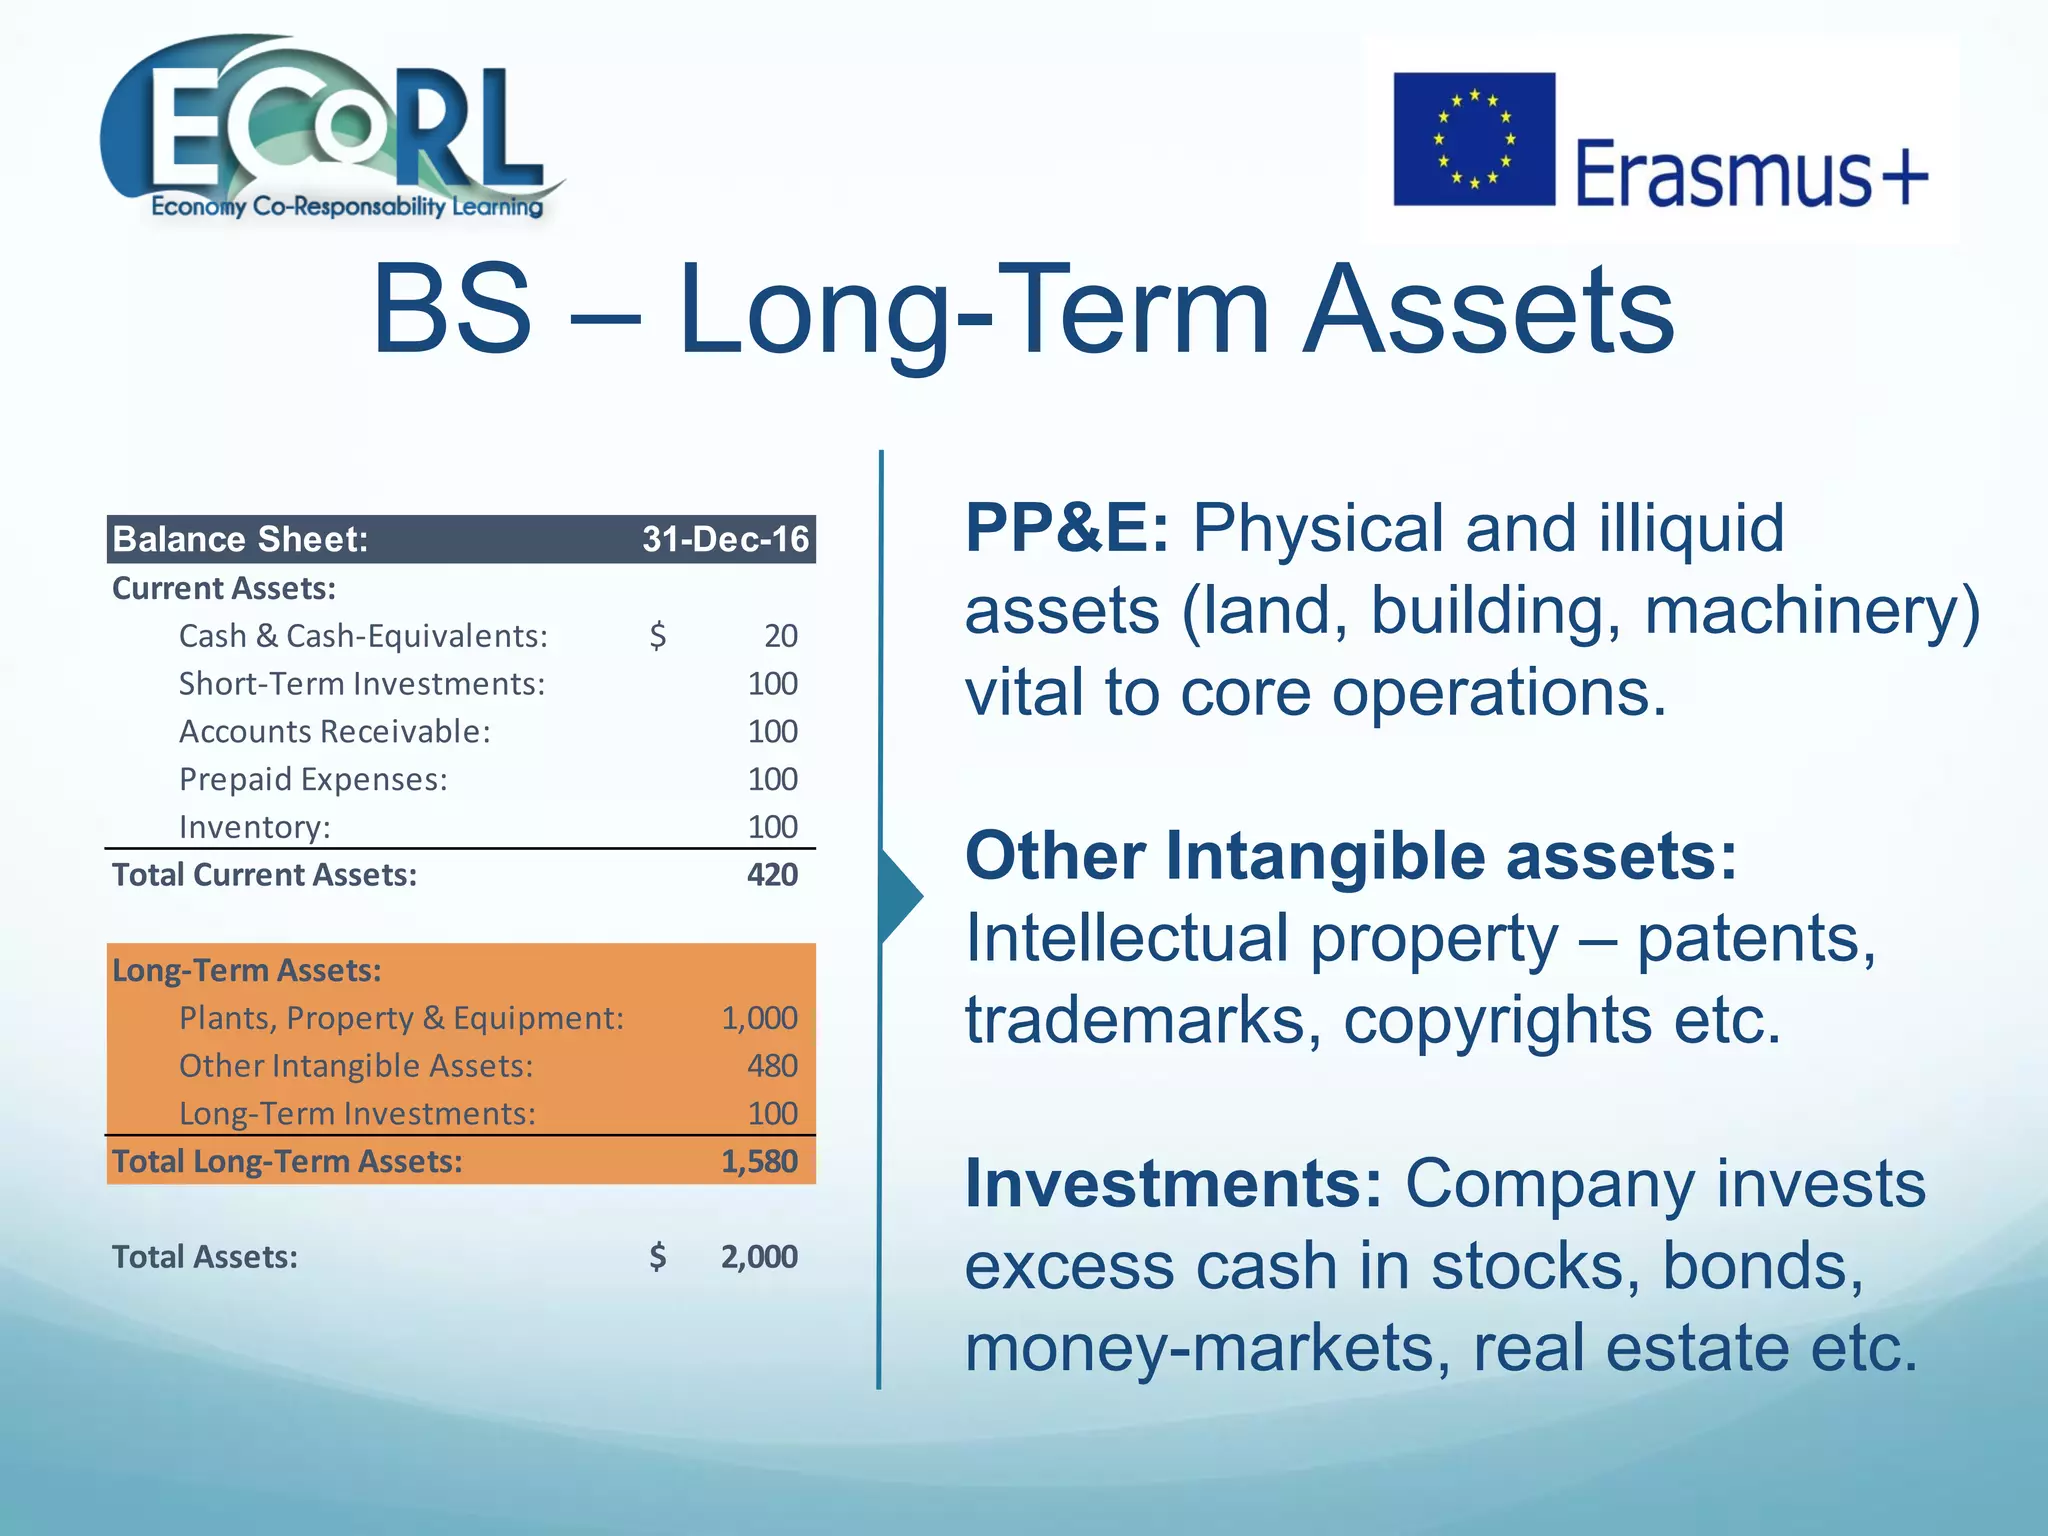
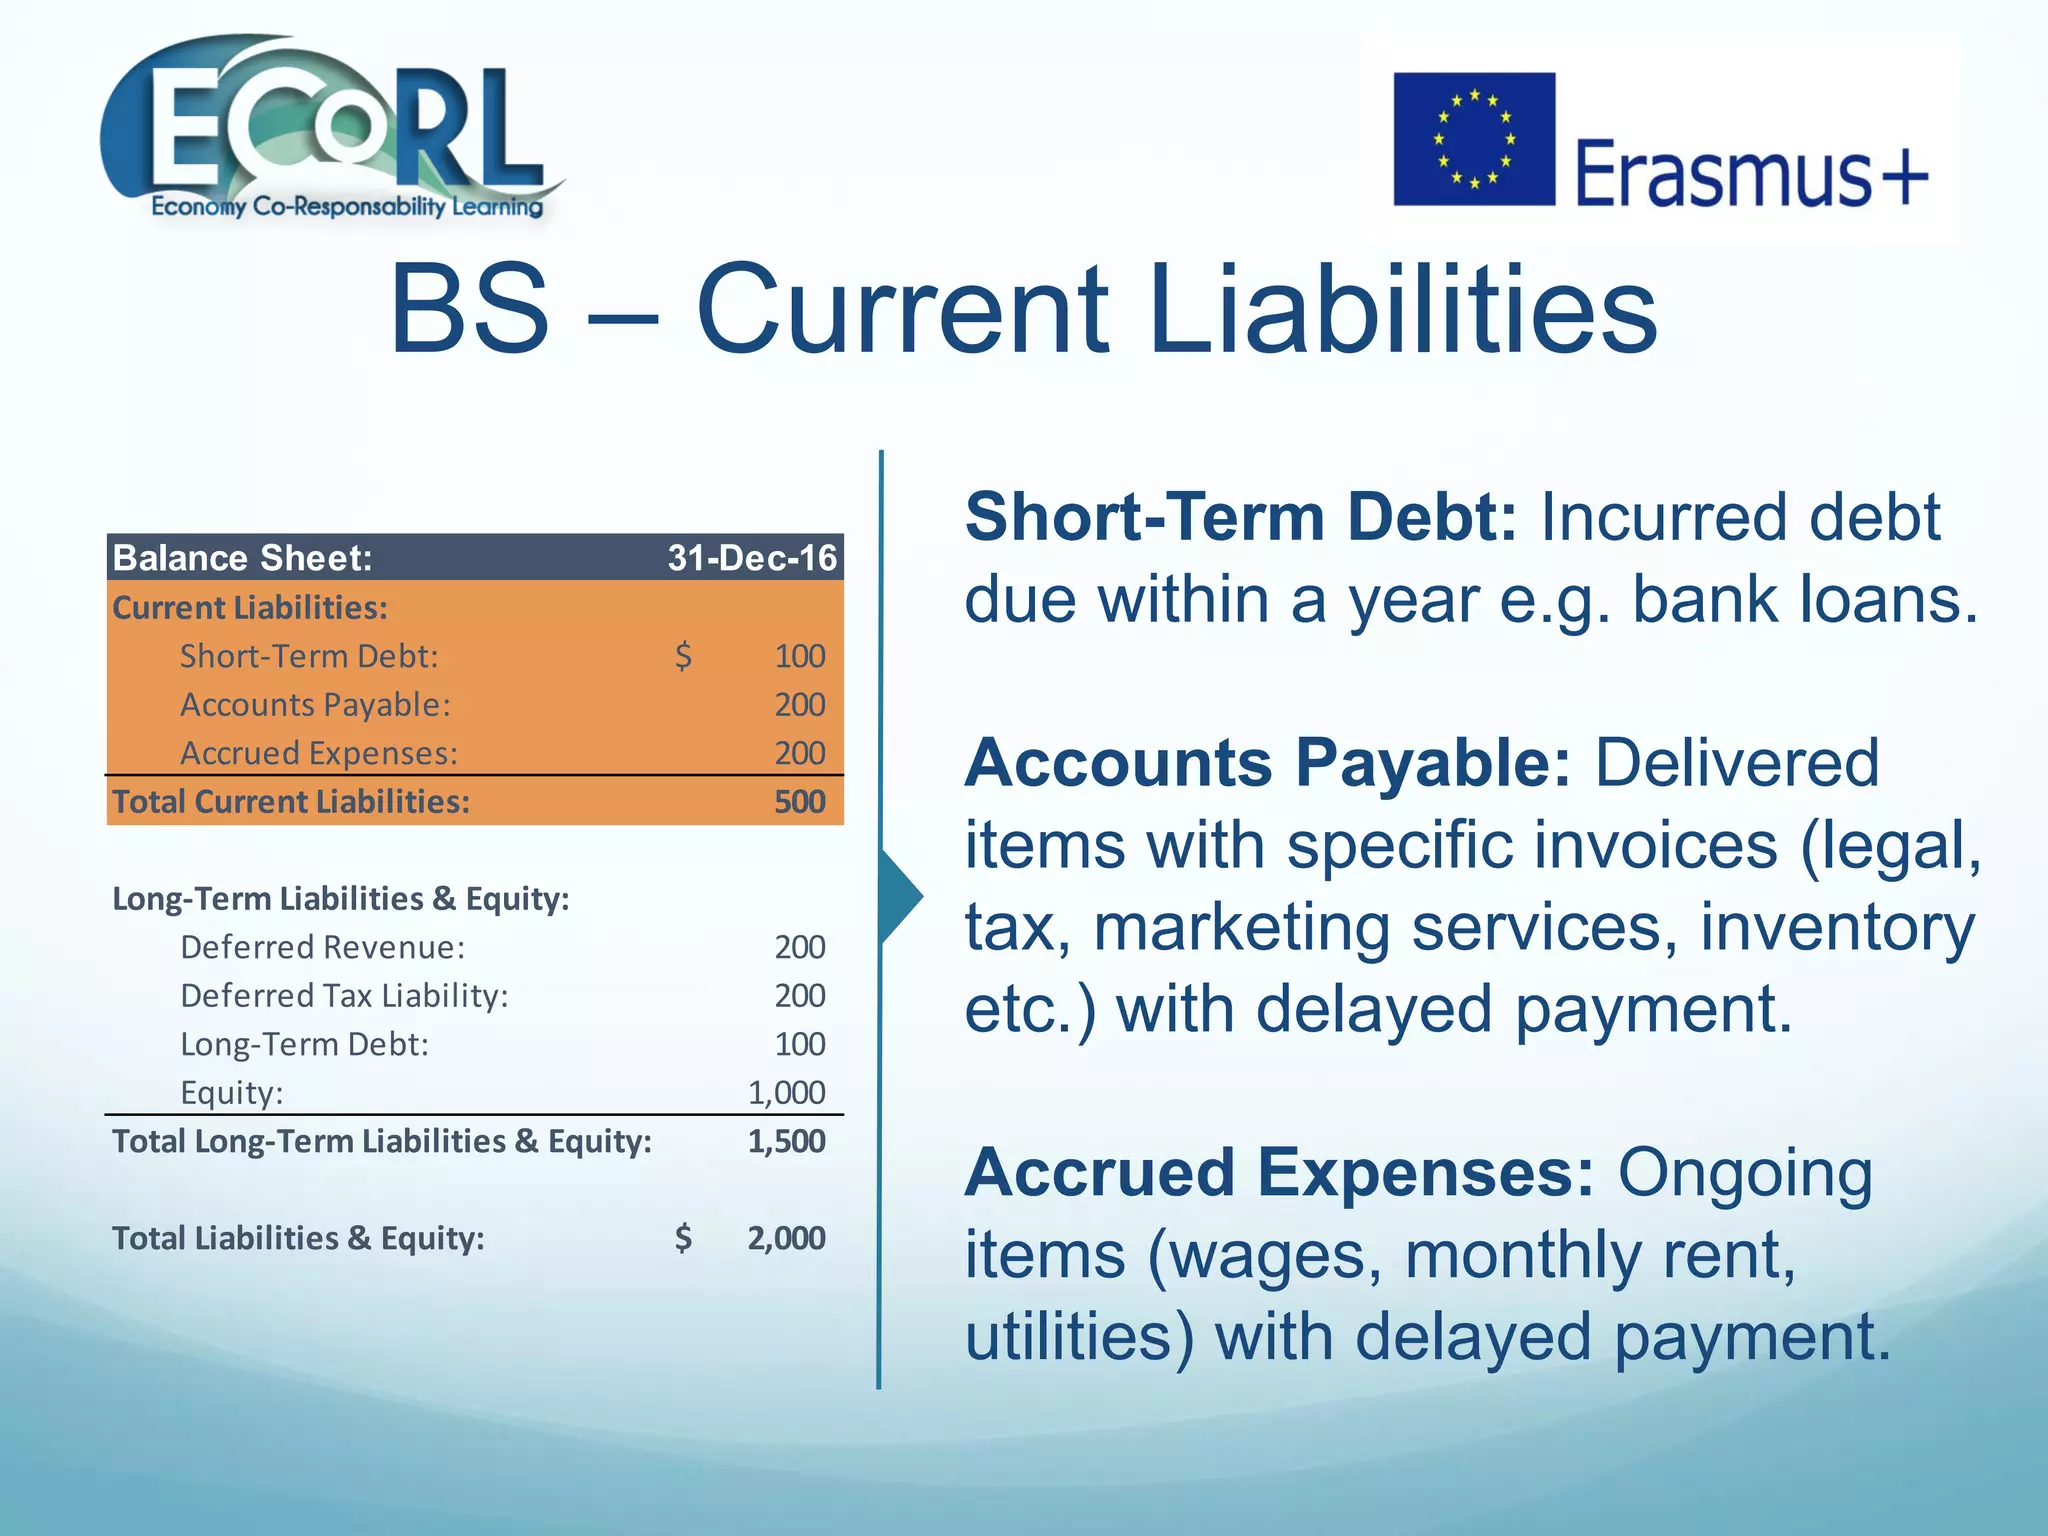
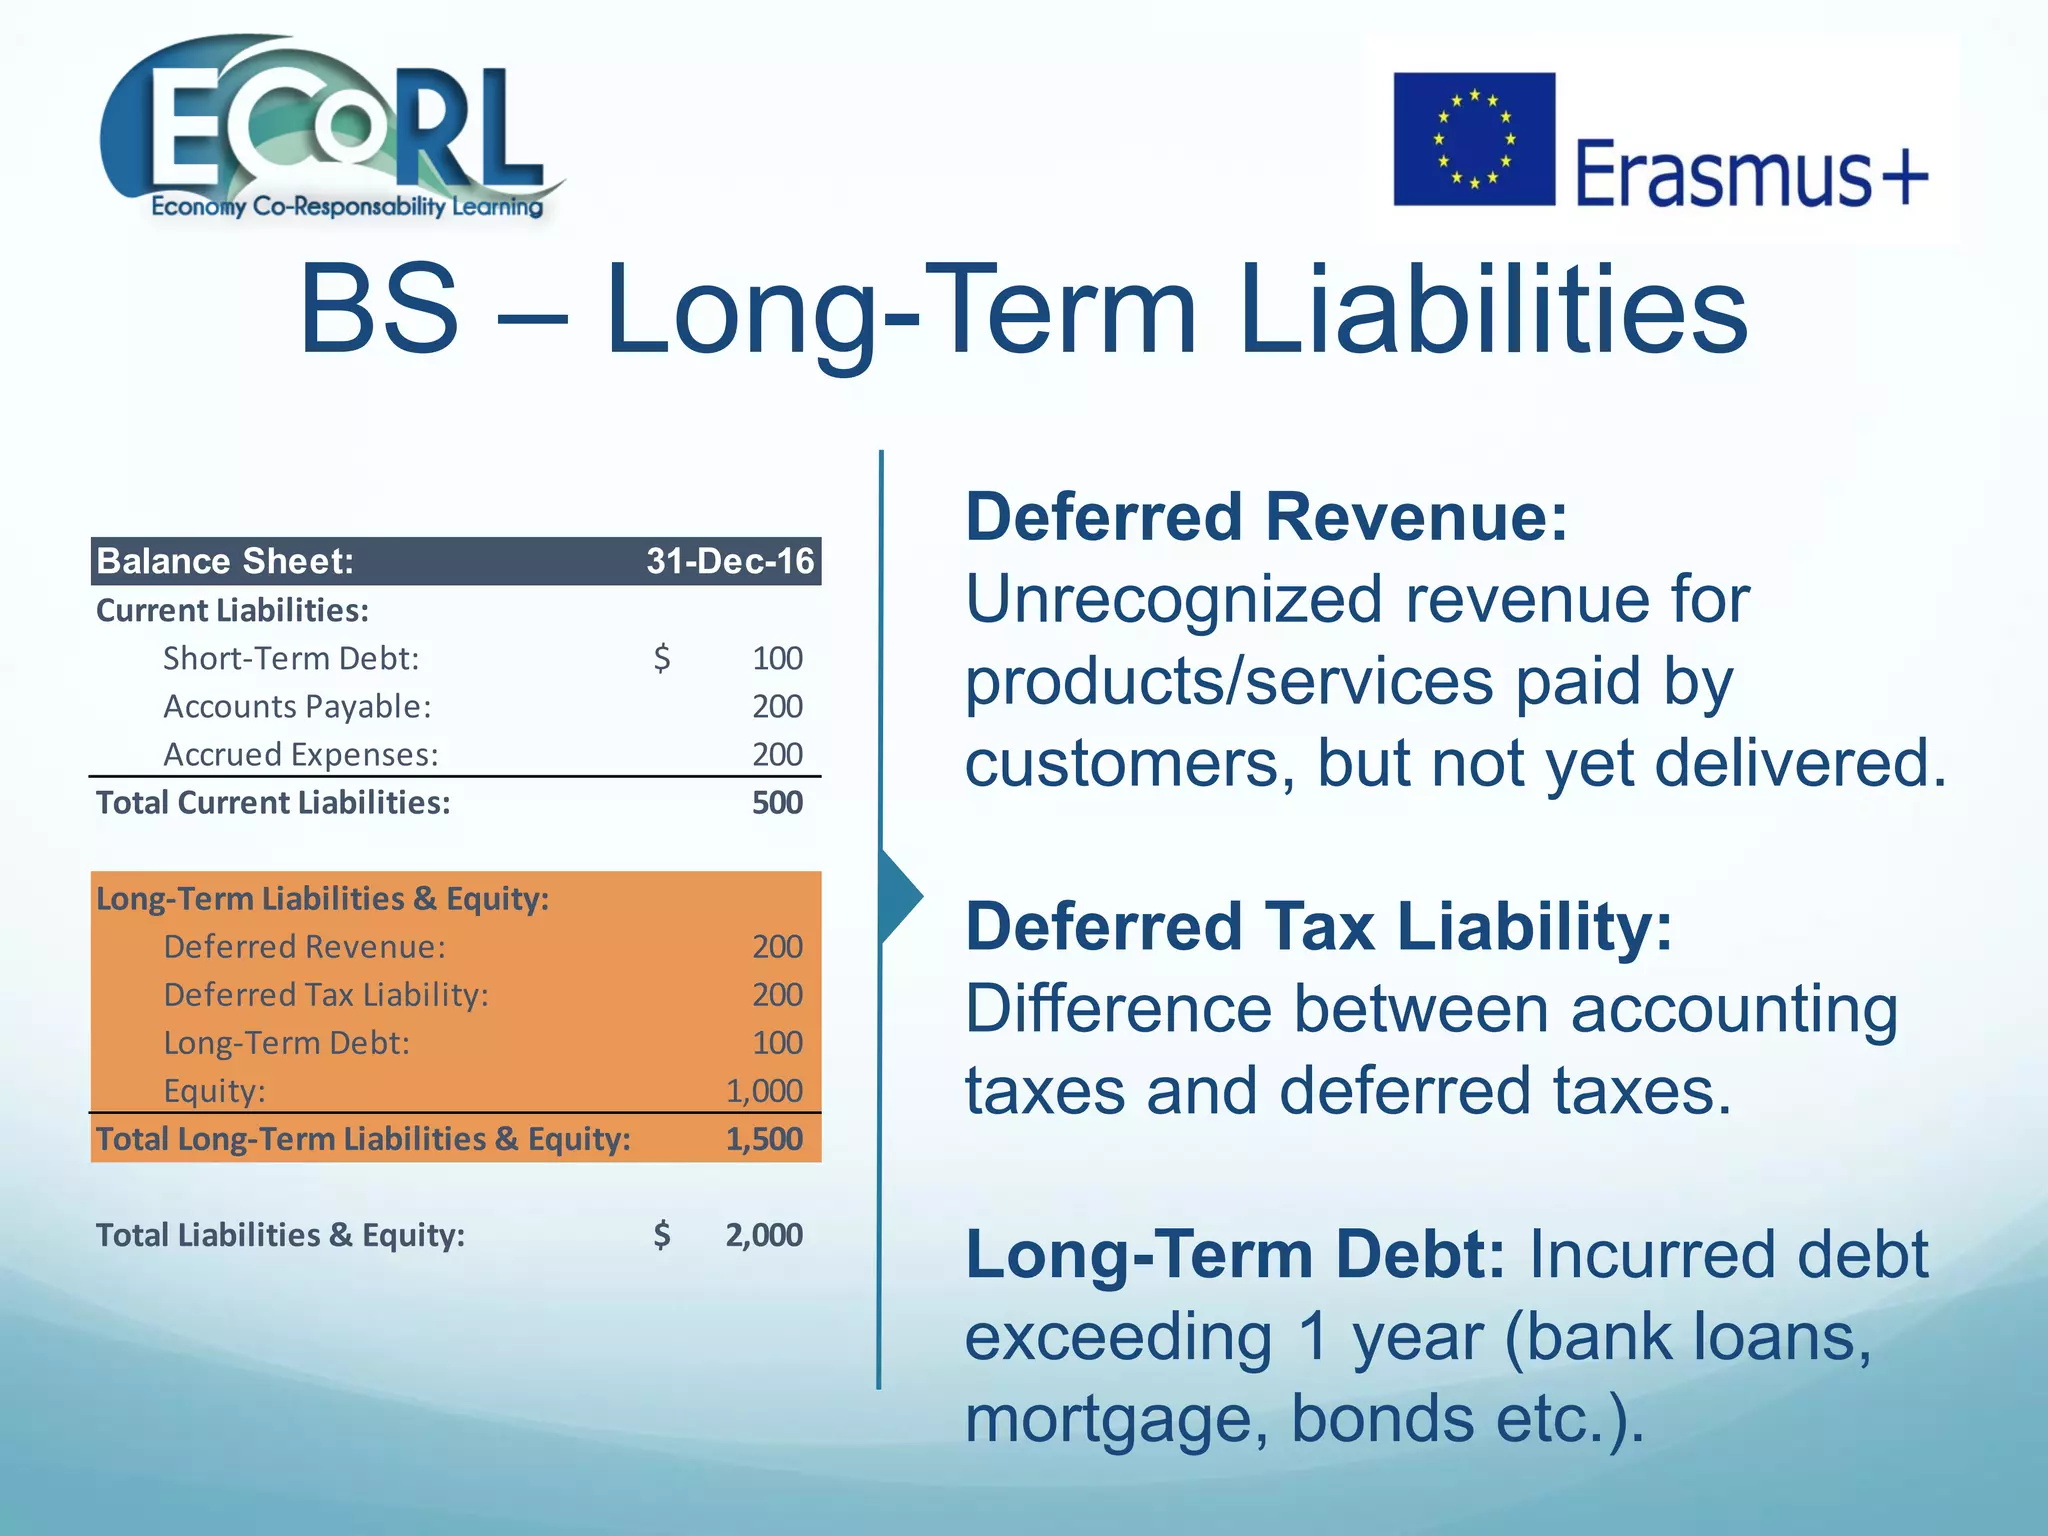
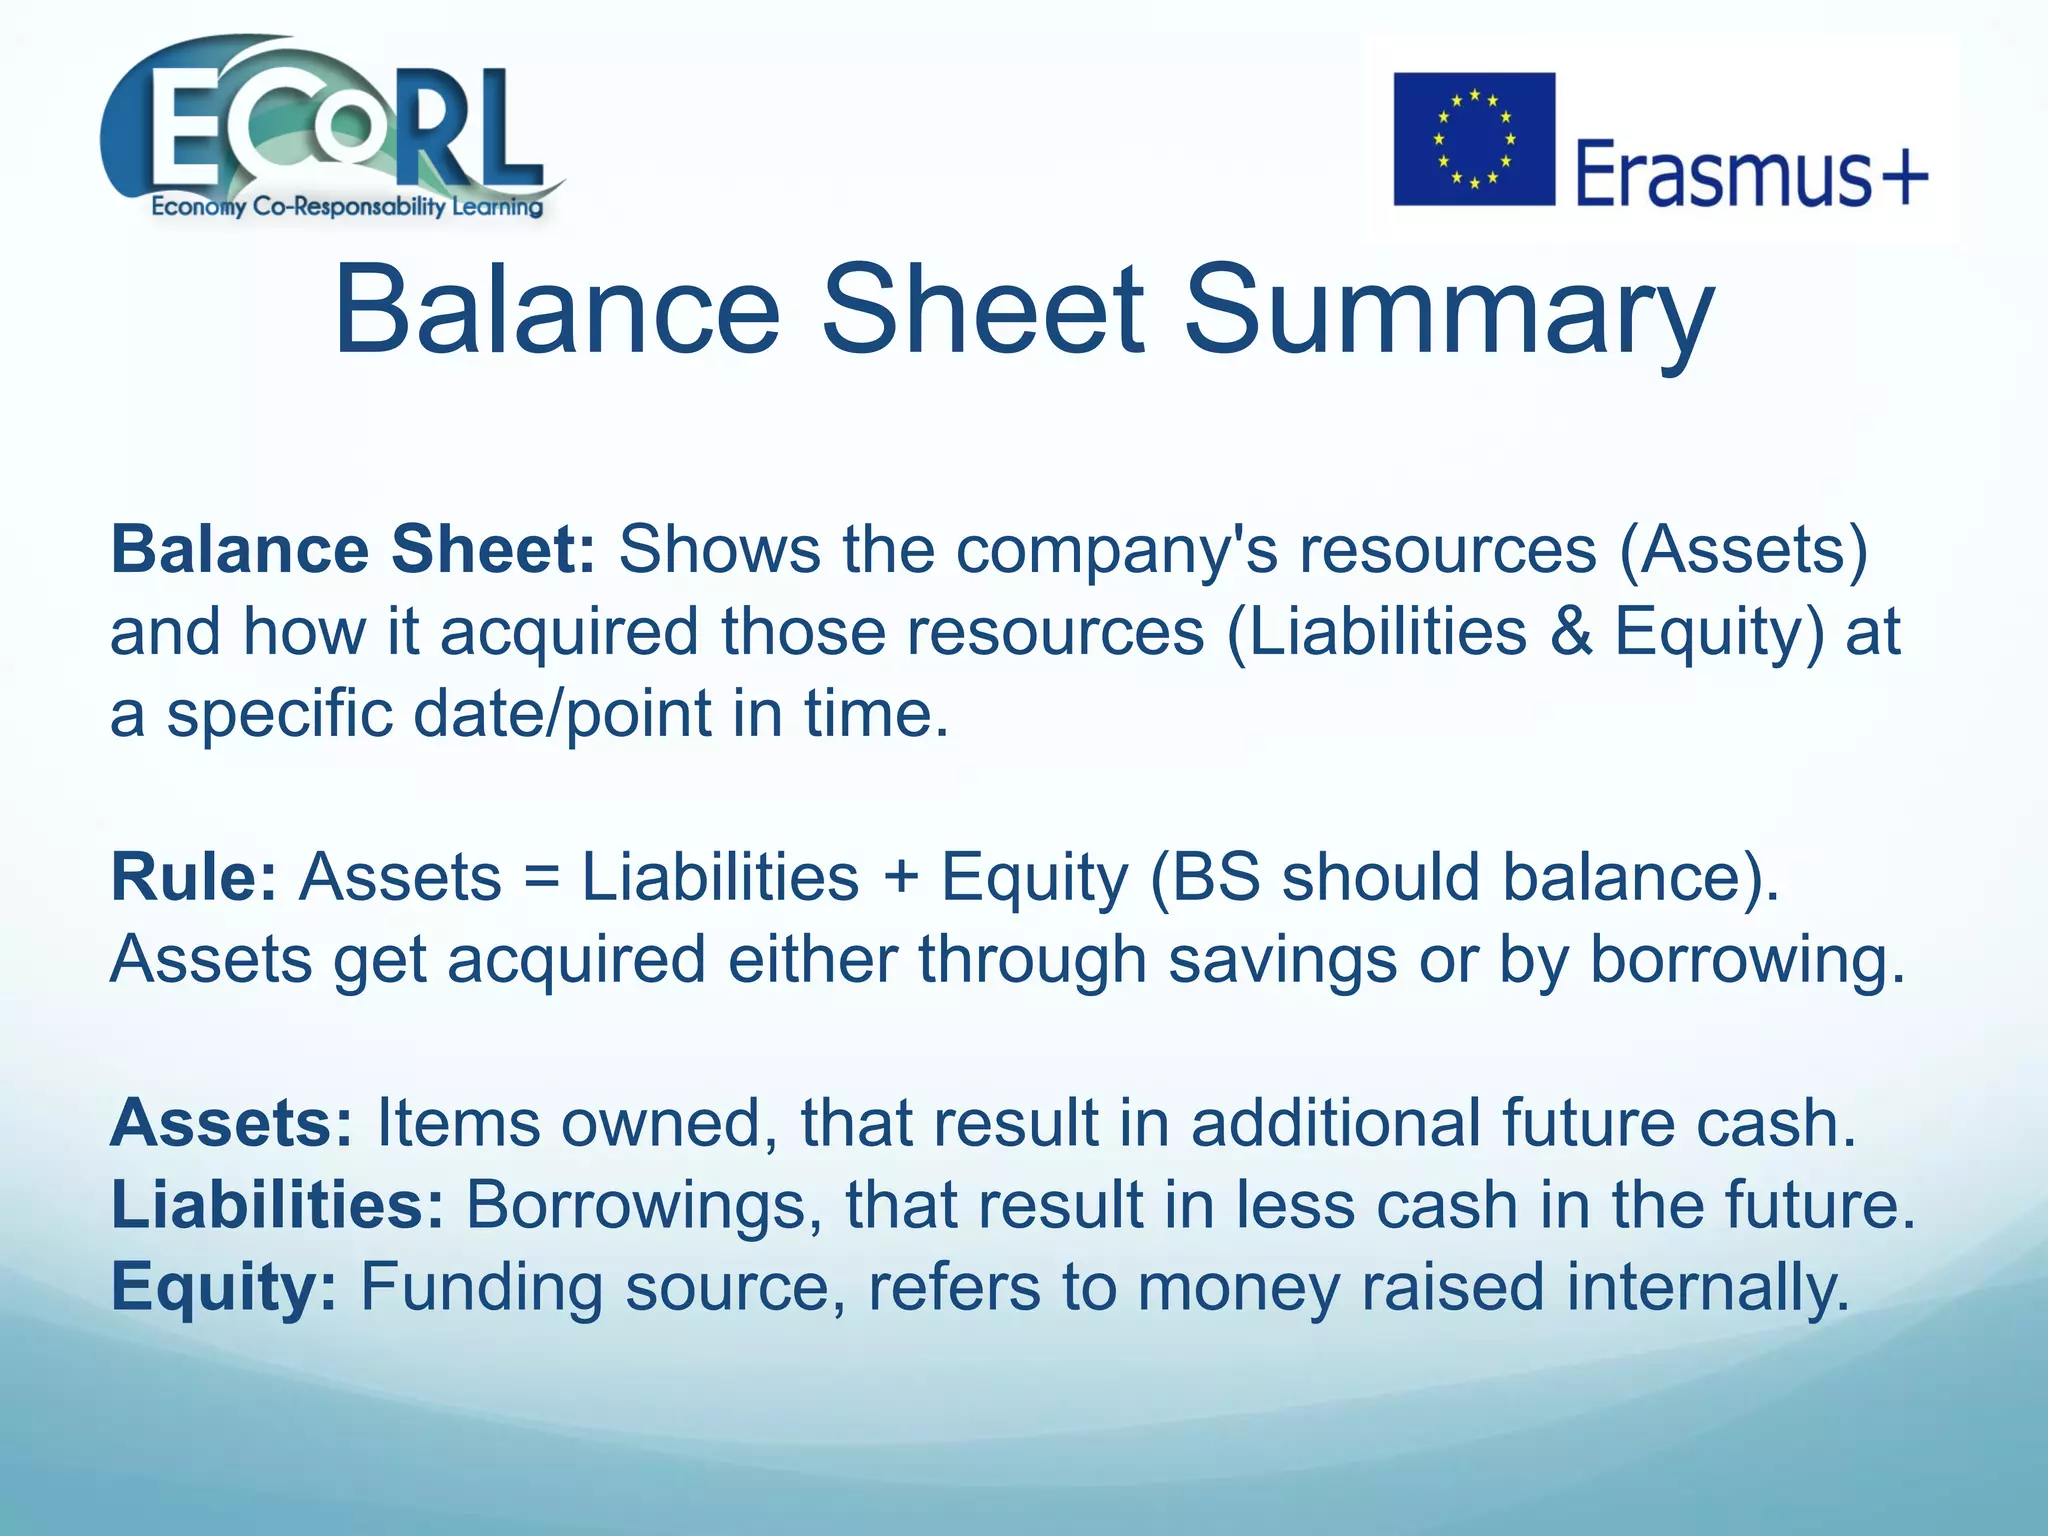
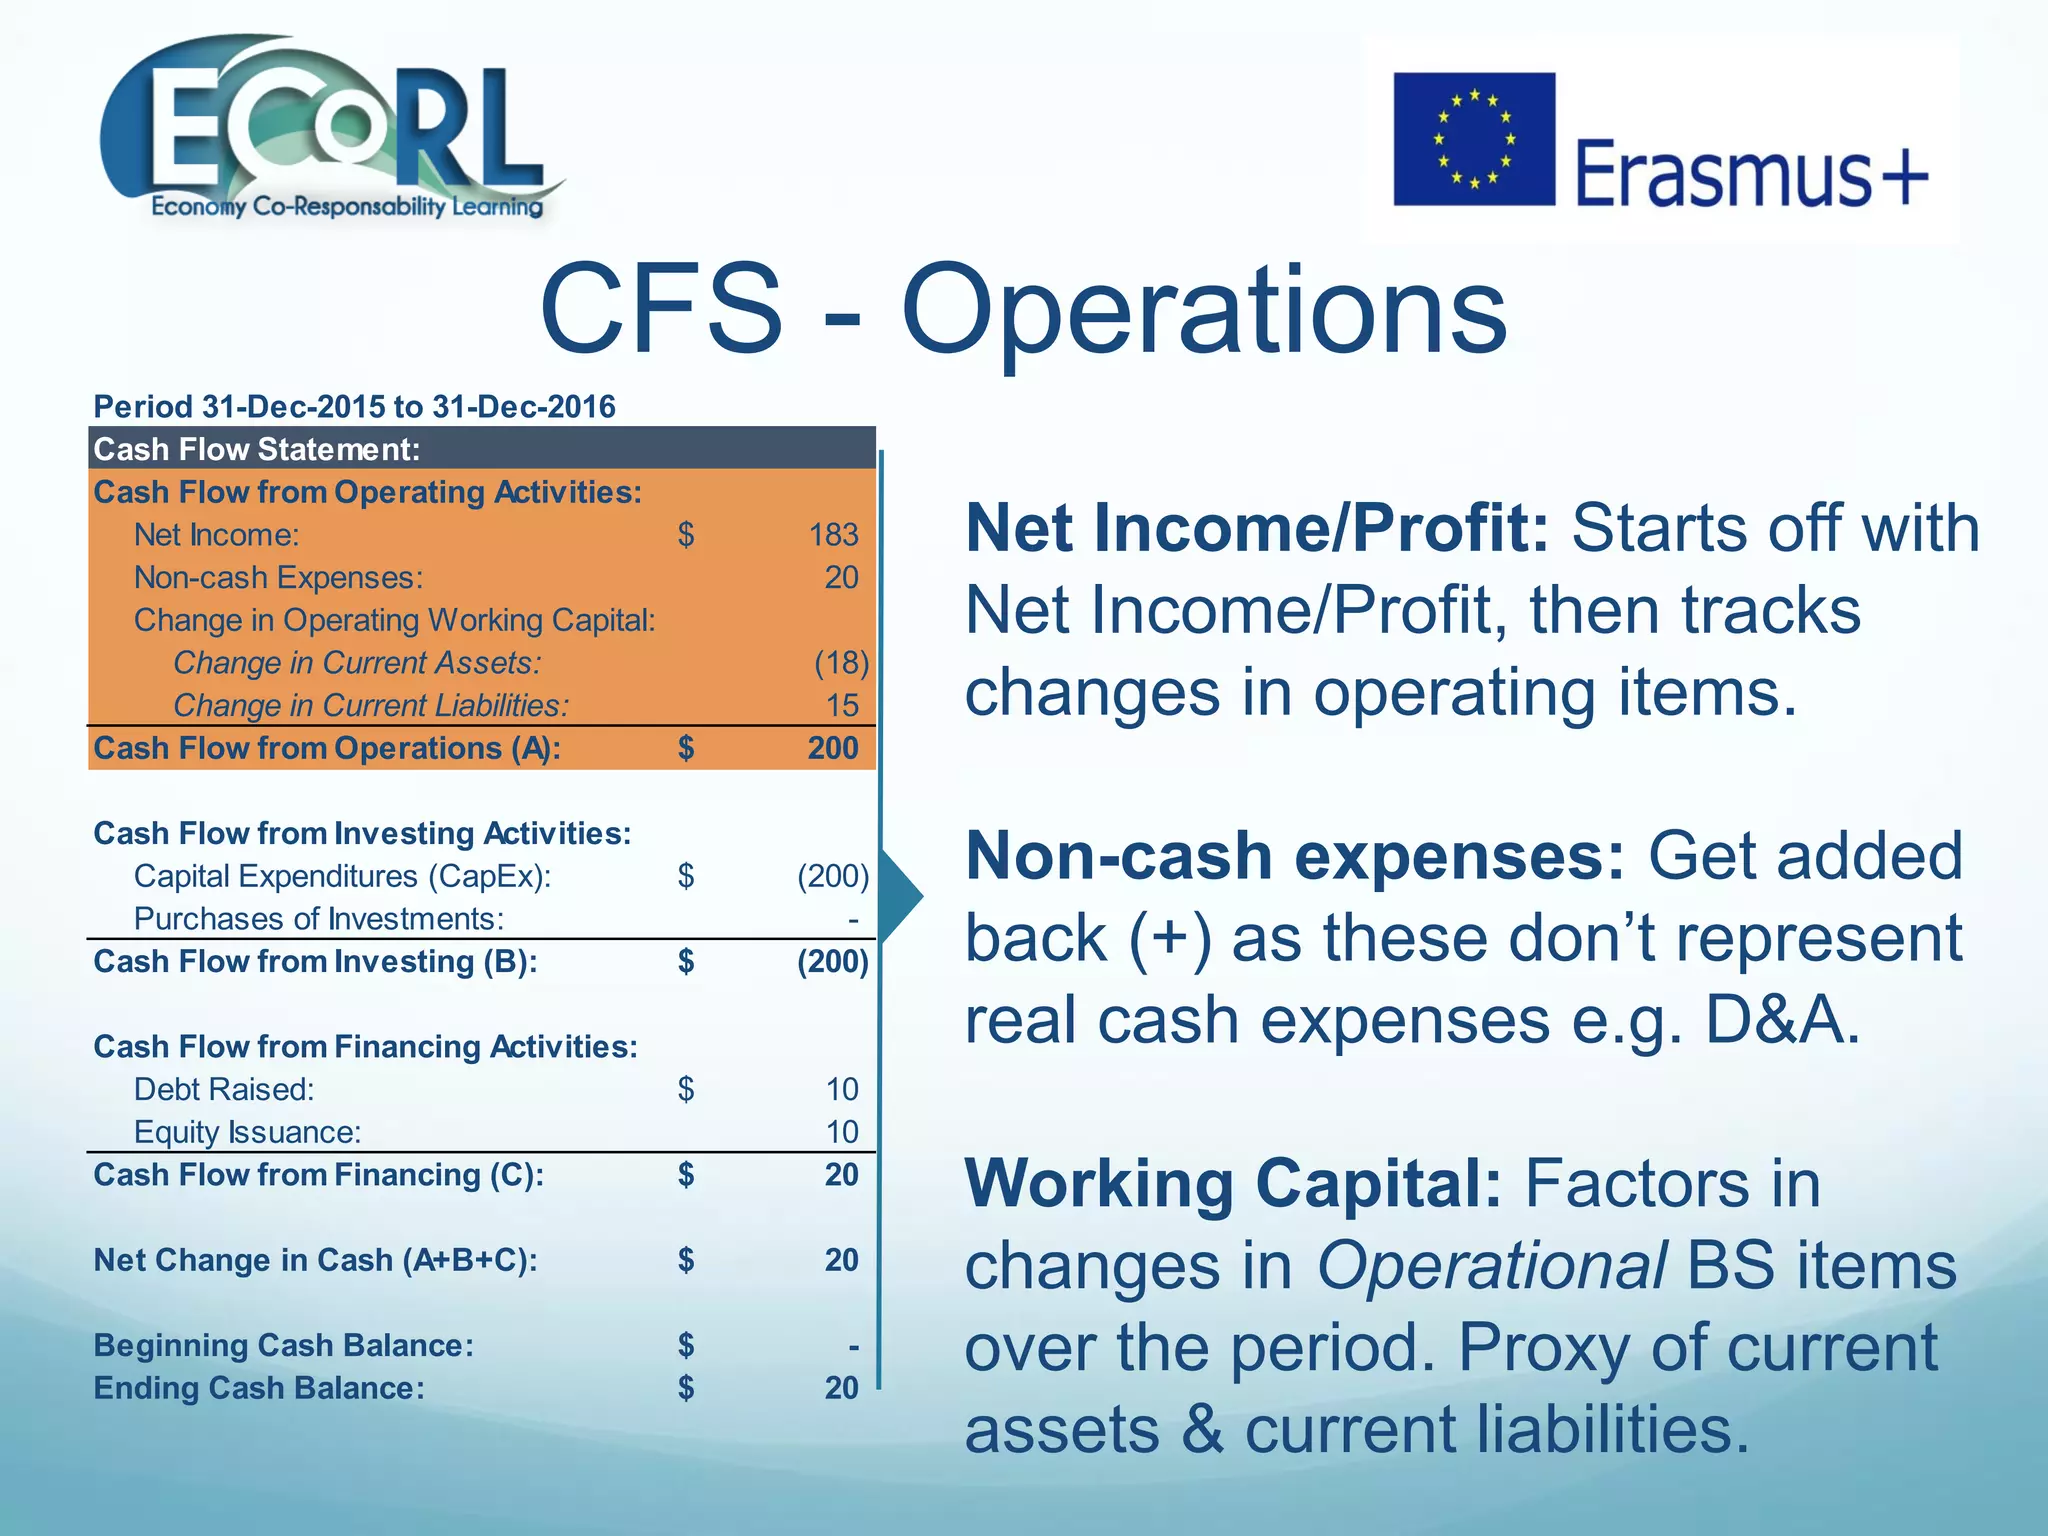
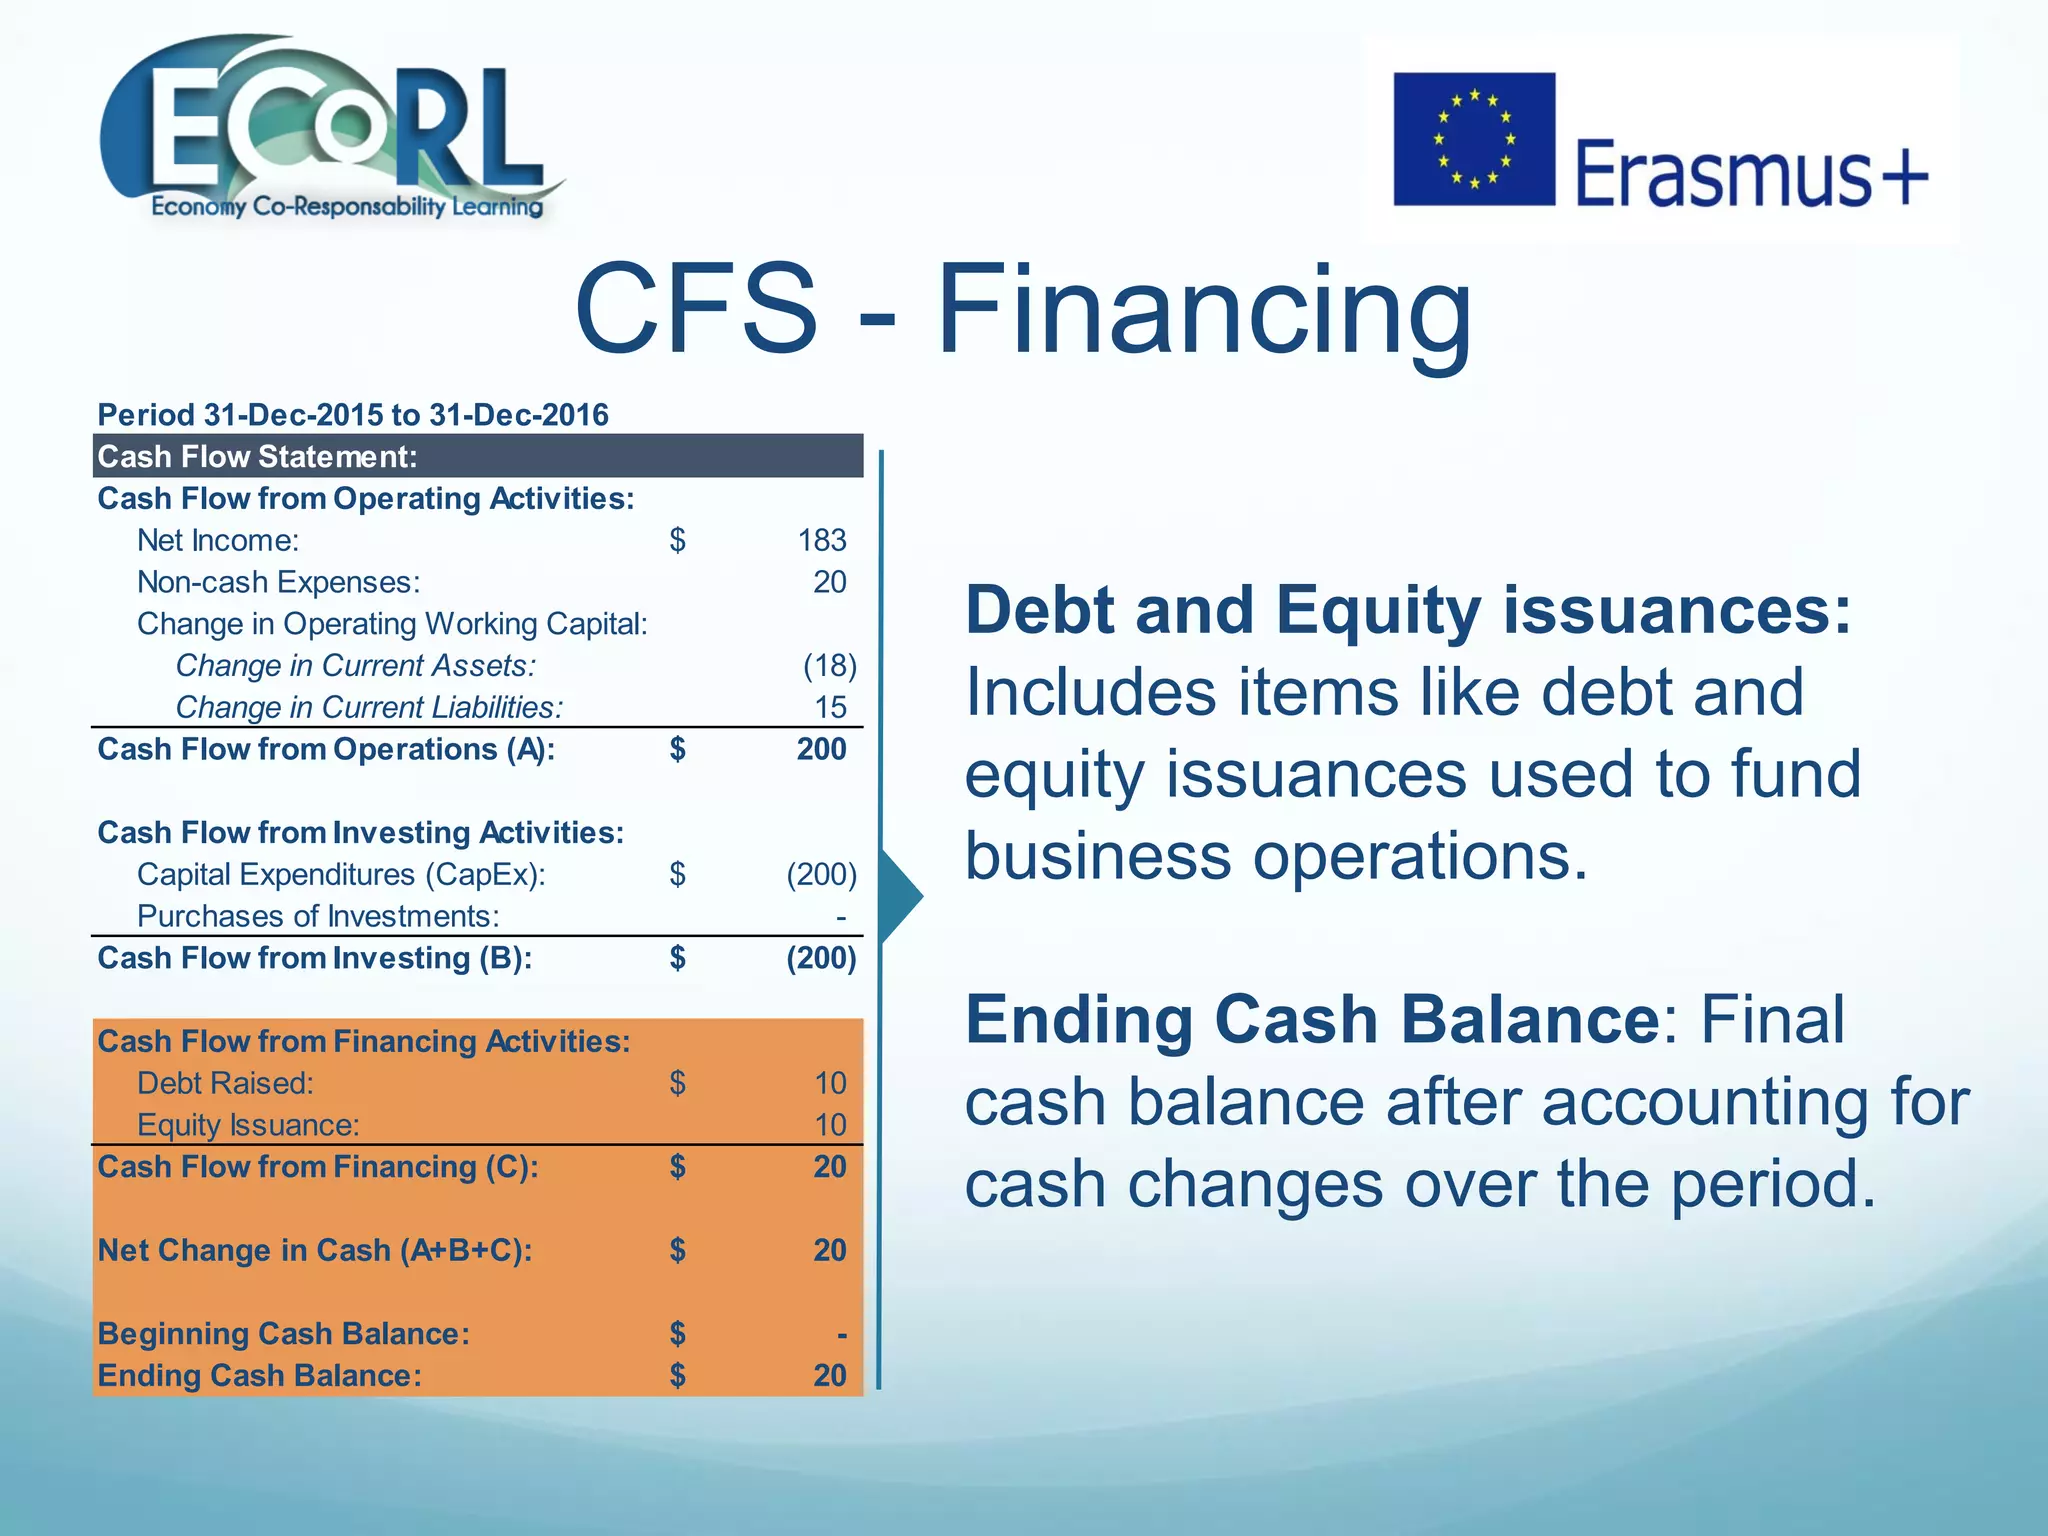
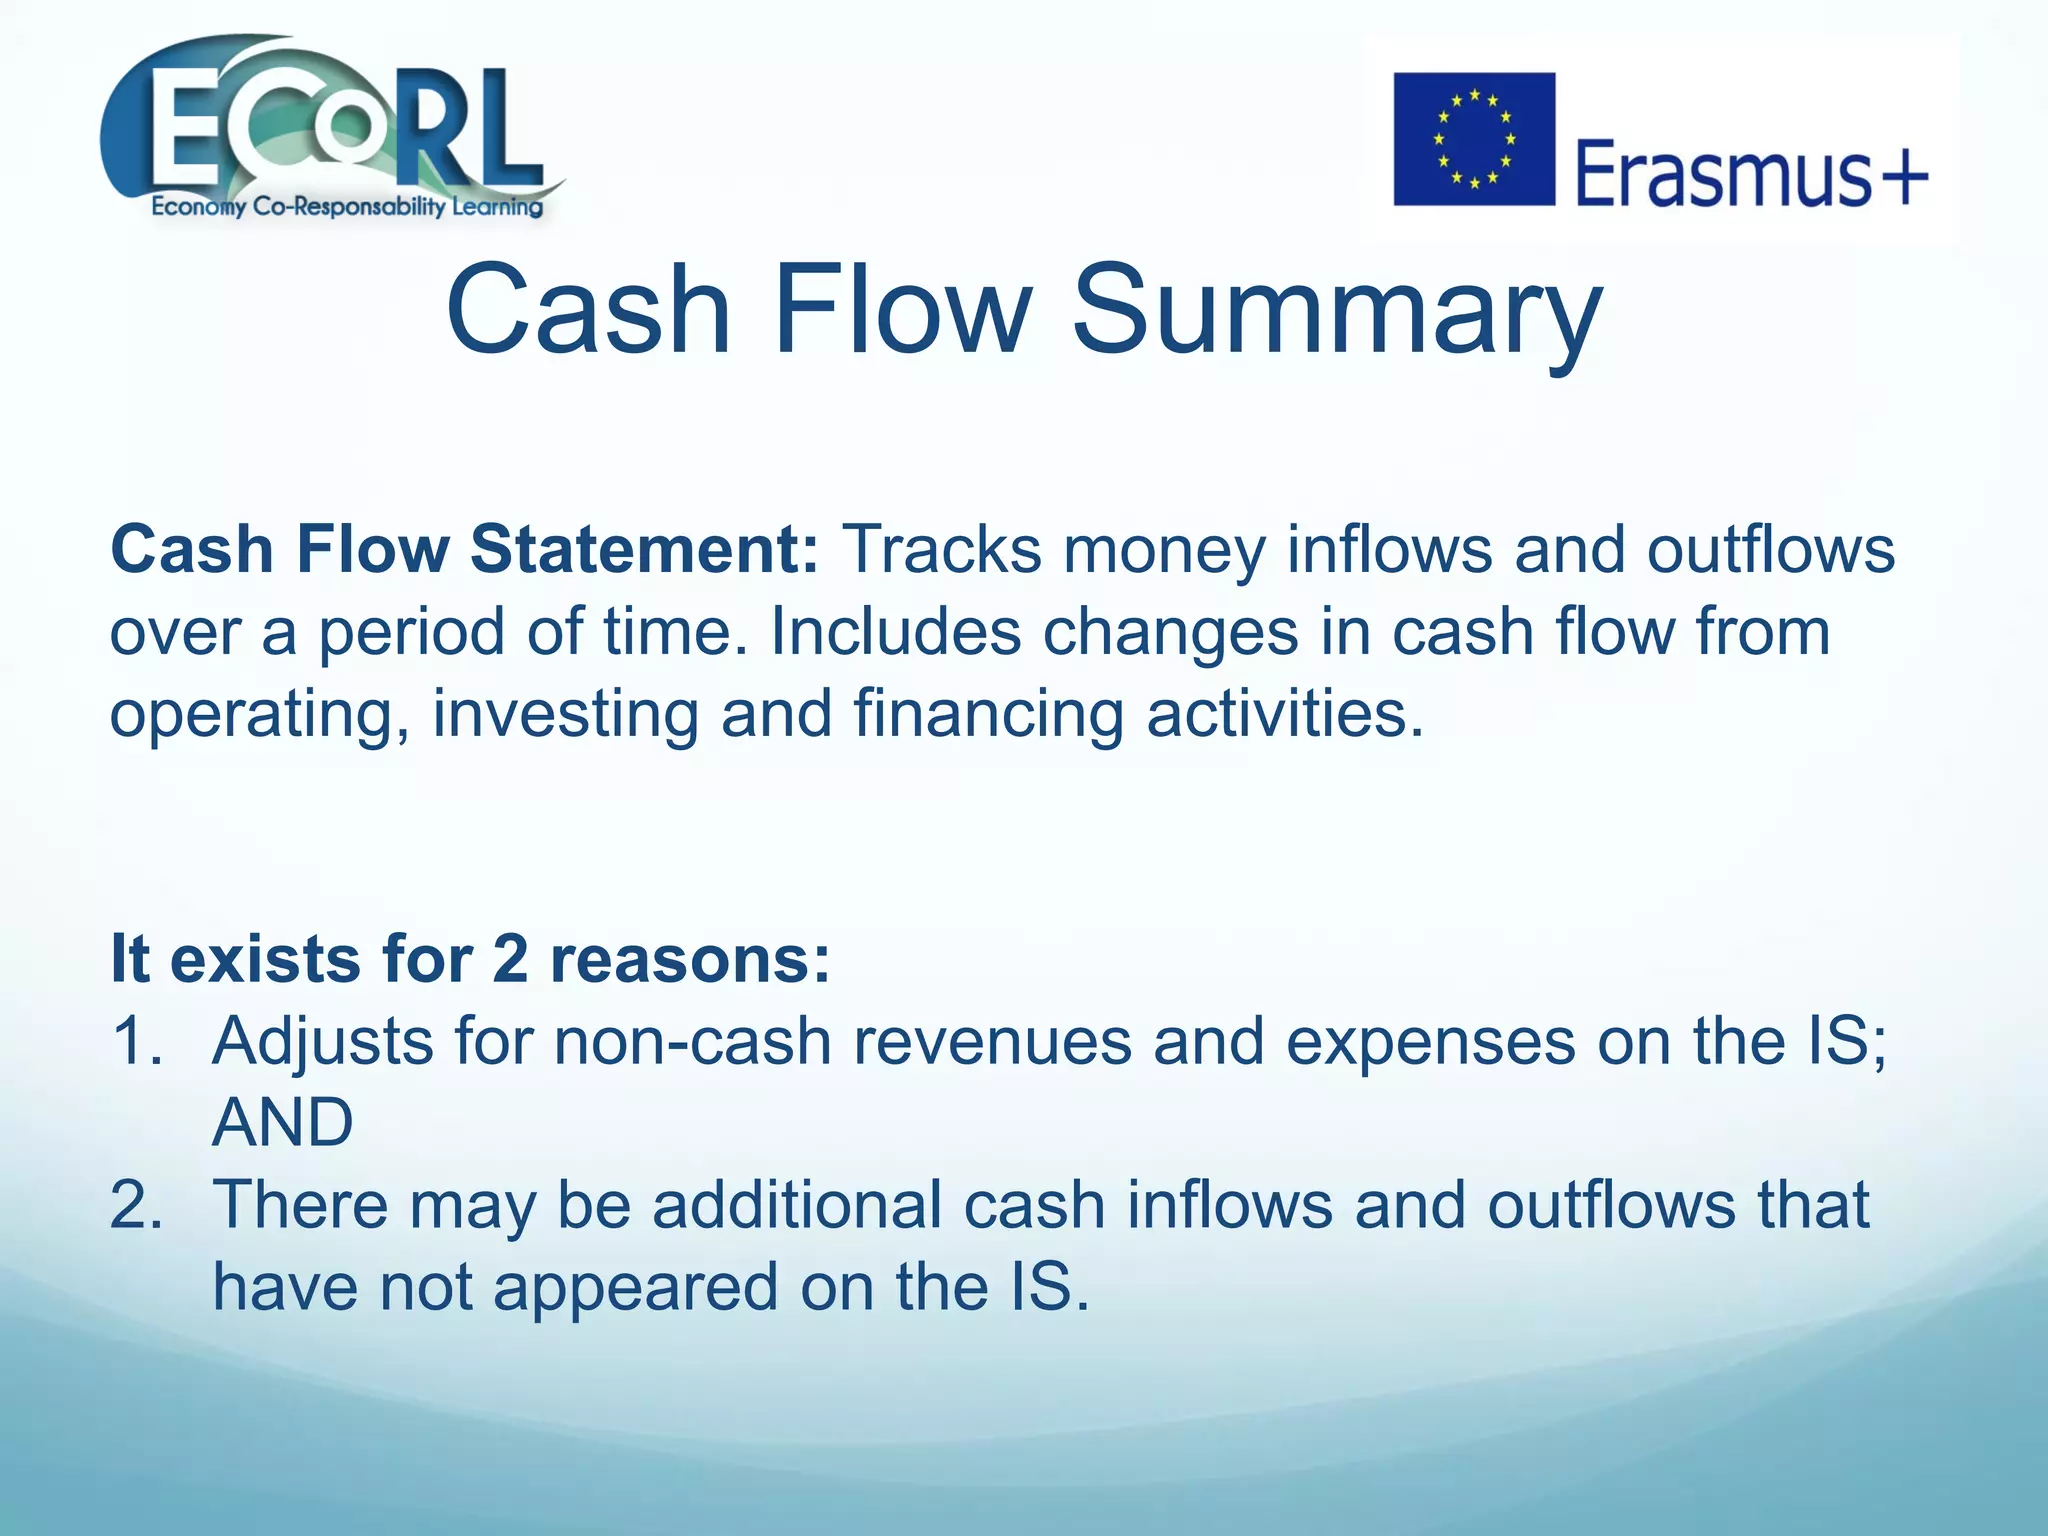
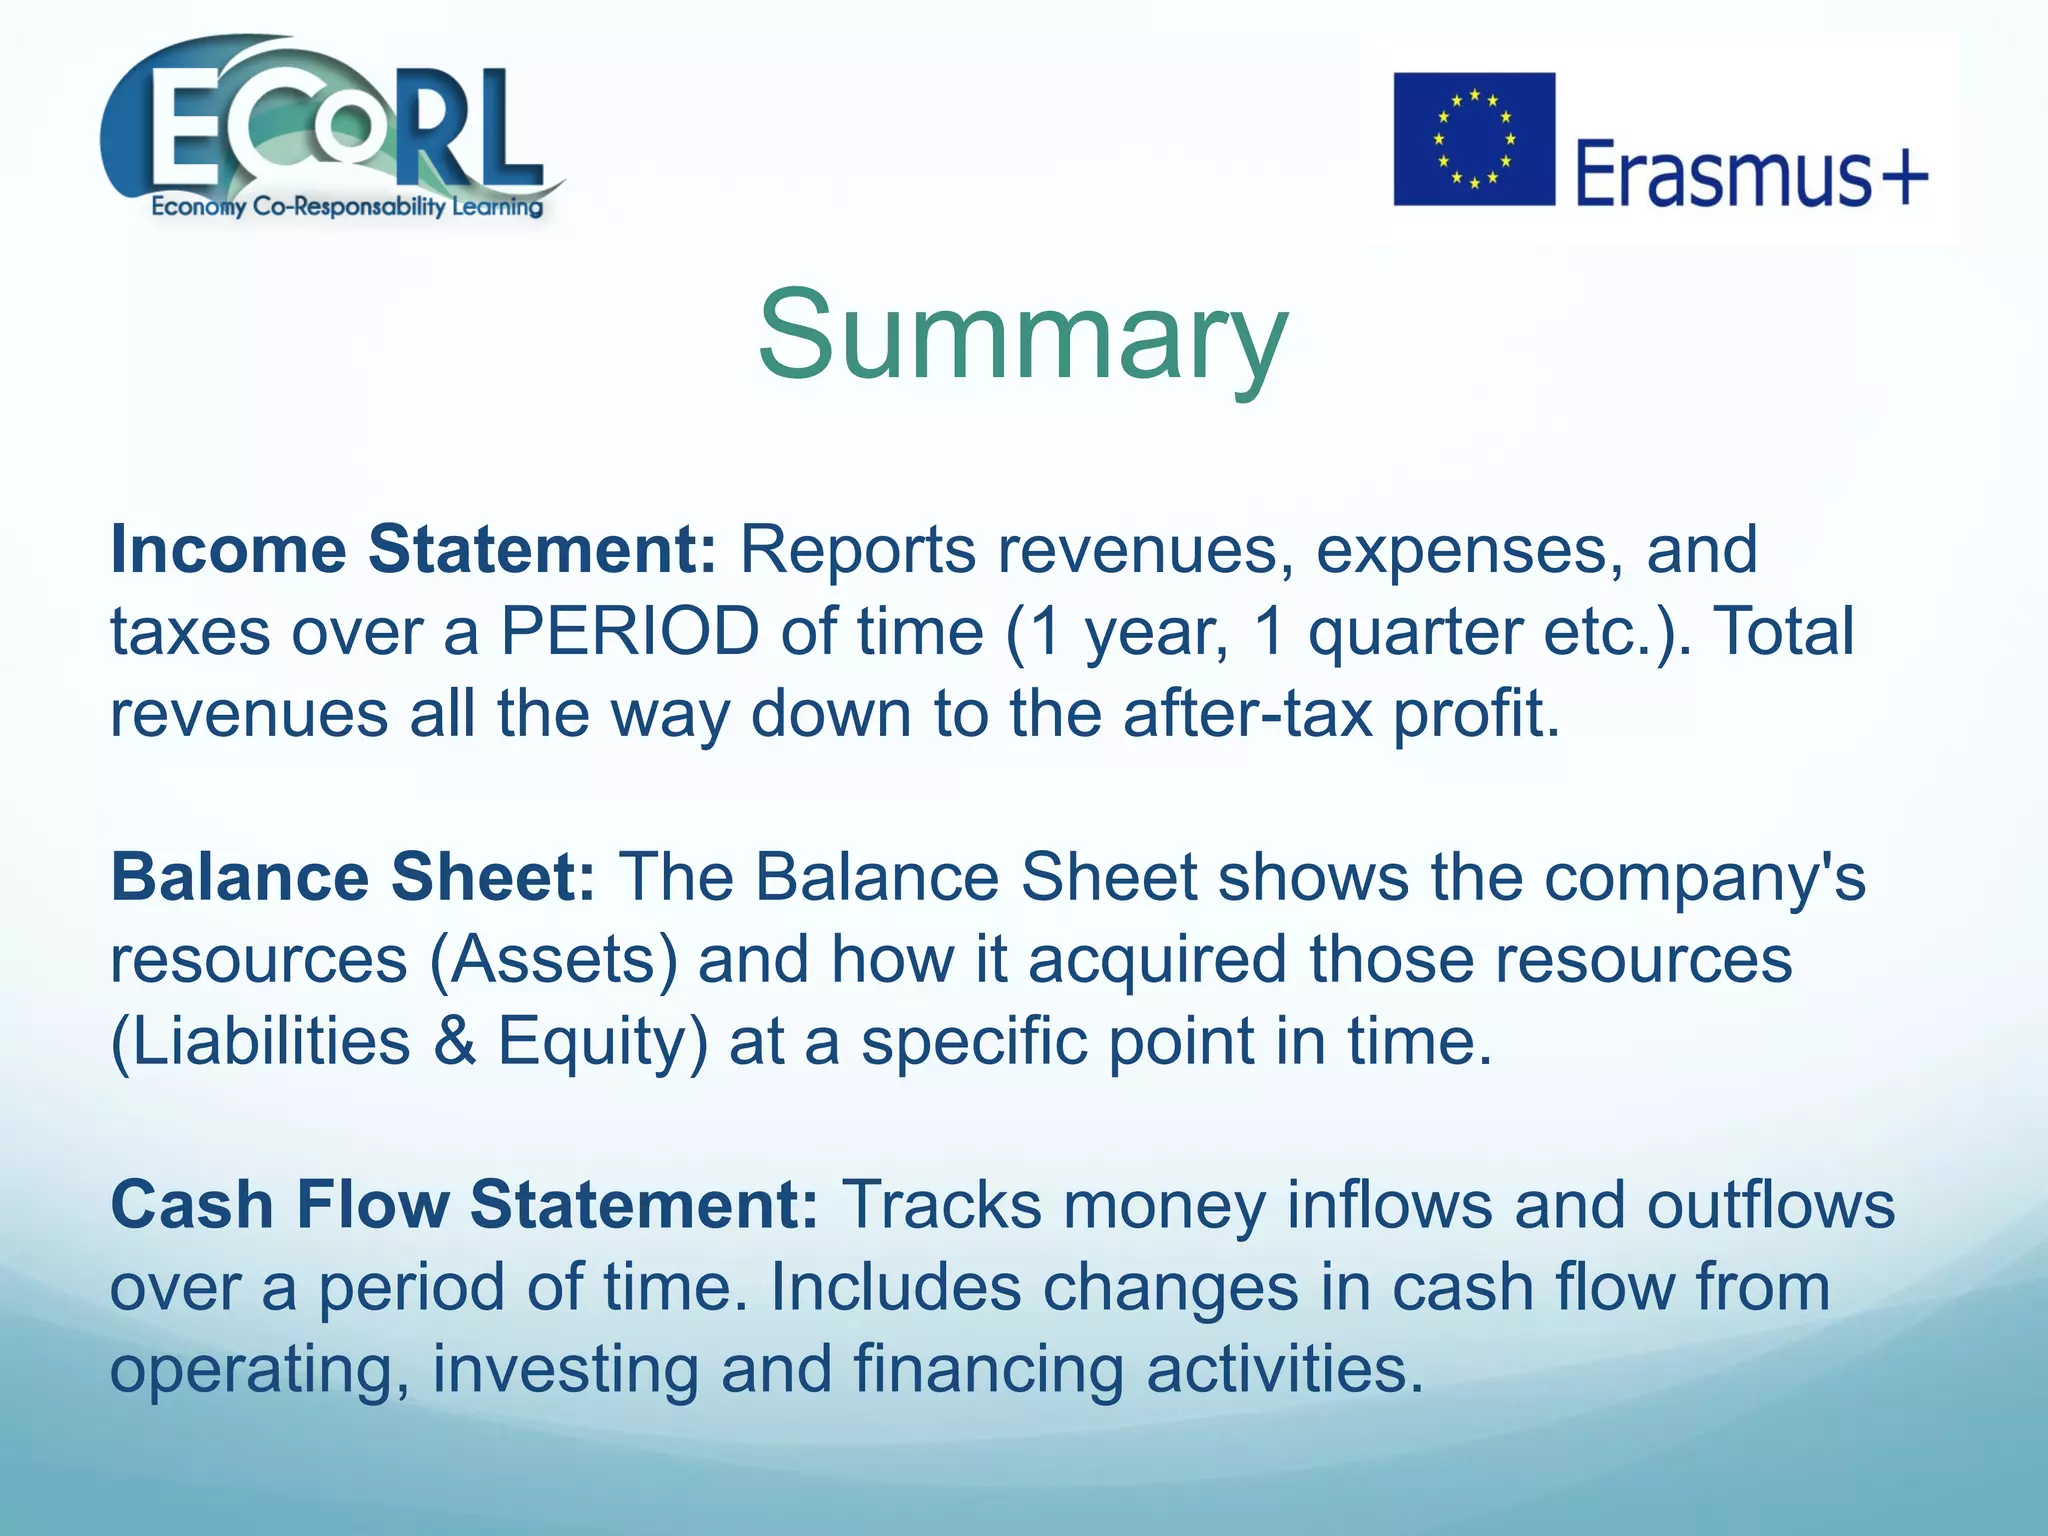
Financial Statements
Introduction
Gresilda Xhaferi
Table of Contents
 Three Financial Statements
 Income Statement
 Balance Sheet
 Cash Flow
 Summary
Three Financial Statements
Financial Statements
IS: Report financial performance over a period
BS: Assets, liabilities and equity for a specific time
CF: Summary of cash inflows and outflows over a period
Cash Flow
(CF)
Balance Sheet
(BS)
Income Statement
(IS)
Provide information on the financial position and
performance of a company
Financial Statements and why they exist
The Income Statement
IS - Revenue, COGS, Gross Profit
Revenue: Earnings recognized
when product/service actually
delivered.
COGS: Per unit expense of
selling product/service. E.g. cost
of material, cost of labor etc.
Gross Profit: Potential profit per
sale, before fixed expenses like
offices, rent, marketing etc.
Income Statement: FY2016
Revenue: 650$
Cost of Goods Sold (COGS): 70
Gross Profit: 580
Gross Margin %: 89.2%
Operating Expenses:
Sales & Marketing: 150
General & Administrative: 125
Total Operating Expenses: 275
Depreciation&Amotrization (D&A): 20
Operating Income (EBIT): 285
Operating Margin: 43.8%
Other Income / (Expenses): 20
Interest Income / (Expense): -
Pre-Tax Income (EBT): 305
Income Taxes: 122
Net Profit: 183$
Net Profit Margin: 28.2%
IS – OpEx, D&A, EBIT
Operating Expenses: Expenses
that cannot be linked directly to
individual units sold.
D&A: Non-cash expenses,
represent cost of assets being
used over time.
Operating Income (EBIT):
Earnings before non-core
activities, interest, and taxes.
Income Statement: FY2016
Revenue: 650$
Cost of Goods Sold (COGS): 70
Gross Profit: 580
Gross Margin %: 89.2%
Operating Expenses:
Sales & Marketing: 150
General & Administrative: 125
Total Operating Expenses: 275
Depreciation&Amotrization (D&A): 20
Operating Income (EBIT): 285
Operating Margin: 43.8%
Other Income / (Expenses): 20
Interest Income / (Expense): -
Pre-Tax Income (EBT): 305
Income Taxes: 122
Net Profit: 183$
Net Profit Margin: 28.2%
IS – Other Income, EBT, Net Profit
Interest/Other Income/Expense:
Income (expense) from non-core
business activities including debt
investments.
Pre-Tax Income (EBT): Earnings
before taxes, the amount used to
pay taxes on.
Net Profit: Amount generated
from core and non-core activities
after expenses and taxes.
Income Statement: FY2016
Revenue: 650$
Cost of Goods Sold (COGS): 70
Gross Profit: 580
Gross Margin %: 89.2%
Operating Expenses:
Sales & Marketing: 150
General & Administrative: 125
Total Operating Expenses: 275
Depreciation&Amotrization (D&A): 20
Operating Income (EBIT): 285
Operating Margin: 43.8%
Other Income / (Expenses): 20
Interest Income / (Expense): -
Pre-Tax Income (EBT): 305
Income Taxes: 122
Net Profit: 183$
Net Profit Margin: 28.2%
Income Statement Summary
Income Statement: Shows revenue to net profit over a
PERIOD of time e.g. 1 year. Records only if product/service
has been DELIVERED – irrelevant when payment occurs.
To appear on the Income Statement:
1. Must correspond to the CURRENT period (i.e. only what
you're paying an employee this quarter/month/year);
AND
2. Must impact the company's taxes.
The Balance Sheet
BS – Assets, Liabilities, Equity
Assets = Liabilities + Equity
Assets: What the company owns
that increases cash flow in the
future.
Liabilities: Obligations which
reduce cash flow in the future.
Equity: Funding source, relates
to funds raised internally.
Balance Sheet: 31-Dec-16
Assets:
Current Assets: 420
Long-Term Assets: 1,580
Total Assets: 2,000$
Liabilities & Equity:
Current Liabilities: 500
Long-Term Liabilities: 500
Equity: 1,000
Total Liabilities & Equity: 2,000$
BS – Current Assets
Cash: Physical currency and
highly liquid investments.
Accounts Receivable: Amount
the company is owed by its clients
after delivering product/service.
Prepaid Expenses: Paying for
expenses in advance.
Inventory: Raw materials, in-
process products, finished goods
ready for sale.
Balance Sheet: 31-Dec-16
Current Assets:
Cash & Cash-Equivalents: 20$
Short-Term Investments: 100
Accounts Receivable: 100
Prepaid Expenses: 100
Inventory: 100
Total Current Assets: 420
Long-Term Assets:
Plants, Property & Equipment: 1,000
Other Intangible Assets: 480
Long-Term Investments: 100
Total Long-Term Assets: 1,580
Total Assets: 2,000$
BS – Long-Term Assets
PP&E: Physical and illiquid
assets (land, building, machinery)
vital to core operations.
Other Intangible assets:
Intellectual property – patents,
trademarks, copyrights etc.
Investments: Company invests
excess cash in stocks, bonds,
money-markets, real estate etc.
Balance Sheet: 31-Dec-16
Current Assets:
Cash & Cash-Equivalents: 20$
Short-Term Investments: 100
Accounts Receivable: 100
Prepaid Expenses: 100
Inventory: 100
Total Current Assets: 420
Long-Term Assets:
Plants, Property & Equipment: 1,000
Other Intangible Assets: 480
Long-Term Investments: 100
Total Long-Term Assets: 1,580
Total Assets: 2,000$
BS – Current Liabilities
Short-Term Debt: Incurred debt
due within a year e.g. bank loans.
Accounts Payable: Delivered
items with specific invoices (legal,
tax, marketing services, inventory
etc.) with delayed payment.
Accrued Expenses: Ongoing
items (wages, monthly rent,
utilities) with delayed payment.
Balance Sheet: 31-Dec-16
Current Liabilities:
Short-Term Debt: 100$
Accounts Payable: 200
Accrued Expenses: 200
Total Current Liabilities: 500
Long-Term Liabilities & Equity:
Deferred Revenue: 200
Deferred Tax Liability: 200
Long-Term Debt: 100
Equity: 1,000
Total Long-Term Liabilities & Equity: 1,500
Total Liabilities & Equity: 2,000$
BS – Long-Term Liabilities
Deferred Revenue:
Unrecognized revenue for
products/services paid by
customers, but not yet delivered.
Deferred Tax Liability:
Difference between accounting
taxes and deferred taxes.
Long-Term Debt: Incurred debt
exceeding 1 year (bank loans,
mortgage, bonds etc.).
Balance Sheet: 31-Dec-16
Current Liabilities:
Short-Term Debt: 100$
Accounts Payable: 200
Accrued Expenses: 200
Total Current Liabilities: 500
Long-Term Liabilities & Equity:
Deferred Revenue: 200
Deferred Tax Liability: 200
Long-Term Debt: 100
Equity: 1,000
Total Long-Term Liabilities & Equity: 1,500
Total Liabilities & Equity: 2,000$
BS - Equity
Equity: Funding source for the
business (money contributed by
the owners, money raised by
selling ownership, saved-up
cumulative profits over time).
Balance Sheet: 31-Dec-16
Current Liabilities:
Short-Term Debt: 100$
Accounts Payable: 200
Accrued Expenses: 200
Total Current Liabilities: 500
Long-Term Liabilities & Equity:
Deferred Revenue: 200
Deferred Tax Liability: 200
Long-Term Debt: 100
Equity: 1,000
Total Long-Term Liabilities & Equity: 1,500
Total Liabilities & Equity: 2,000$
Balance Sheet Summary
Balance Sheet: Shows the company's resources (Assets)
and how it acquired those resources (Liabilities & Equity) at
a specific date/point in time.
Rule: Assets = Liabilities + Equity (BS should balance).
Assets get acquired either through savings or by borrowing.
Assets: Items owned, that result in additional future cash.
Liabilities: Borrowings, that result in less cash in the future.
Equity: Funding source, refers to money raised internally.
The Cash Flow Statement
CFS - Introduction
CF: Tracks cash flow changes
over a period of time e.g. 1 year.
Operating: Change in cash flow
from core business operations.
Investing: Change in cash flow
from purchasing investments and
spending on increasing capital.
Financing: Change in cash flow
from raising debt or equity.
Period 31-Dec-2015 to 31-Dec-2016
Cash Flow Statement:
Cash Flow from Operating Activities:
Net Income: 183$
Non-cash Expenses: 20
Change in Operating Working Capital:
Change in Current Assets: (18)
Change in Current Liabilities: 15
Cash Flow from Operations (A): 200$
Cash Flow from Investing Activities:
Capital Expenditures (CapEx): (200)$
Purchases of Investments: -
Cash Flow from Investing (B): (200)$
Cash Flow from Financing Activities:
Debt Raised: 10$
Equity Issuance: 10
Cash Flow from Financing (C): 20$
Net Change in Cash (A+B+C): 20$
Beginning Cash Balance: -$
Ending Cash Balance: 20$
CFS - Operations
Net Income/Profit: Starts off with
Net Income/Profit, then tracks
changes in operating items.
Non-cash expenses: Get added
back (+) as these don’t represent
real cash expenses e.g. D&A.
Working Capital: Factors in
changes in Operational BS items
over the period. Proxy of current
assets & current liabilities.
Period 31-Dec-2015 to 31-Dec-2016
Cash Flow Statement:
Cash Flow from Operating Activities:
Net Income: 183$
Non-cash Expenses: 20
Change in Operating Working Capital:
Change in Current Assets: (18)
Change in Current Liabilities: 15
Cash Flow from Operations (A): 200$
Cash Flow from Investing Activities:
Capital Expenditures (CapEx): (200)$
Purchases of Investments: -
Cash Flow from Investing (B): (200)$
Cash Flow from Financing Activities:
Debt Raised: 10$
Equity Issuance: 10
Cash Flow from Financing (C): 20$
Net Change in Cash (A+B+C): 20$
Beginning Cash Balance: -$
Ending Cash Balance: 20$
CFS - Investing
CapEx: Spending on a long-term
tangible asset e.g. purchasing
machinery.
Purchases/Sale of Investments:
Spend extra cash on short and
long term investments.
Period 31-Dec-2015 to 31-Dec-2016
Cash Flow Statement:
Cash Flow from Operating Activities:
Net Income: 183$
Non-cash Expenses: 20
Change in Operating Working Capital:
Change in Current Assets: (18)
Change in Current Liabilities: 15
Cash Flow from Operations (A): 200$
Cash Flow from Investing Activities:
Capital Expenditures (CapEx): (200)$
Purchases of Investments: -
Cash Flow from Investing (B): (200)$
Cash Flow from Financing Activities:
Debt Raised: 10$
Equity Issuance: 10
Cash Flow from Financing (C): 20$
Net Change in Cash (A+B+C): 20$
Beginning Cash Balance: -$
Ending Cash Balance: 20$
CFS - Financing
Debt and Equity issuances:
Includes items like debt and
equity issuances used to fund
business operations.
Ending Cash Balance: Final
cash balance after accounting for
cash changes over the period.
Period 31-Dec-2015 to 31-Dec-2016
Cash Flow Statement:
Cash Flow from Operating Activities:
Net Income: 183$
Non-cash Expenses: 20
Change in Operating Working Capital:
Change in Current Assets: (18)
Change in Current Liabilities: 15
Cash Flow from Operations (A): 200$
Cash Flow from Investing Activities:
Capital Expenditures (CapEx): (200)$
Purchases of Investments: -
Cash Flow from Investing (B): (200)$
Cash Flow from Financing Activities:
Debt Raised: 10$
Equity Issuance: 10
Cash Flow from Financing (C): 20$
Net Change in Cash (A+B+C): 20$
Beginning Cash Balance: -$
Ending Cash Balance: 20$
Cash Flow Summary
Cash Flow Statement: Tracks money inflows and outflows
over a period of time. Includes changes in cash flow from
operating, investing and financing activities.
It exists for 2 reasons:
1. Adjusts for non-cash revenues and expenses on the IS;
AND
2. There may be additional cash inflows and outflows that
have not appeared on the IS.
Summary
Income Statement: Reports revenues, expenses, and
taxes over a PERIOD of time (1 year, 1 quarter etc.). Total
revenues all the way down to the after-tax profit.
Balance Sheet: The Balance Sheet shows the company's
resources (Assets) and how it acquired those resources
(Liabilities & Equity) at a specific point in time.
Cash Flow Statement: Tracks money inflows and outflows
over a period of time. Includes changes in cash flow from
operating, investing and financing activities.
Thank you!

Lysb project-ecorl-lesson-financial-statements-deepening .docx

  • 1.
  • 2.
    Table of Contents Three Financial Statements  Income Statement  Balance Sheet  Cash Flow  Summary
  • 3.
  • 4.
    Financial Statements IS: Reportfinancial performance over a period BS: Assets, liabilities and equity for a specific time CF: Summary of cash inflows and outflows over a period Cash Flow (CF) Balance Sheet (BS) Income Statement (IS) Provide information on the financial position and performance of a company Financial Statements and why they exist
  • 5.
  • 6.
    IS - Revenue,COGS, Gross Profit Revenue: Earnings recognized when product/service actually delivered. COGS: Per unit expense of selling product/service. E.g. cost of material, cost of labor etc. Gross Profit: Potential profit per sale, before fixed expenses like offices, rent, marketing etc. Income Statement: FY2016 Revenue: 650$ Cost of Goods Sold (COGS): 70 Gross Profit: 580 Gross Margin %: 89.2% Operating Expenses: Sales & Marketing: 150 General & Administrative: 125 Total Operating Expenses: 275 Depreciation&Amotrization (D&A): 20 Operating Income (EBIT): 285 Operating Margin: 43.8% Other Income / (Expenses): 20 Interest Income / (Expense): - Pre-Tax Income (EBT): 305 Income Taxes: 122 Net Profit: 183$ Net Profit Margin: 28.2%
  • 7.
    IS – OpEx,D&A, EBIT Operating Expenses: Expenses that cannot be linked directly to individual units sold. D&A: Non-cash expenses, represent cost of assets being used over time. Operating Income (EBIT): Earnings before non-core activities, interest, and taxes. Income Statement: FY2016 Revenue: 650$ Cost of Goods Sold (COGS): 70 Gross Profit: 580 Gross Margin %: 89.2% Operating Expenses: Sales & Marketing: 150 General & Administrative: 125 Total Operating Expenses: 275 Depreciation&Amotrization (D&A): 20 Operating Income (EBIT): 285 Operating Margin: 43.8% Other Income / (Expenses): 20 Interest Income / (Expense): - Pre-Tax Income (EBT): 305 Income Taxes: 122 Net Profit: 183$ Net Profit Margin: 28.2%
  • 8.
    IS – OtherIncome, EBT, Net Profit Interest/Other Income/Expense: Income (expense) from non-core business activities including debt investments. Pre-Tax Income (EBT): Earnings before taxes, the amount used to pay taxes on. Net Profit: Amount generated from core and non-core activities after expenses and taxes. Income Statement: FY2016 Revenue: 650$ Cost of Goods Sold (COGS): 70 Gross Profit: 580 Gross Margin %: 89.2% Operating Expenses: Sales & Marketing: 150 General & Administrative: 125 Total Operating Expenses: 275 Depreciation&Amotrization (D&A): 20 Operating Income (EBIT): 285 Operating Margin: 43.8% Other Income / (Expenses): 20 Interest Income / (Expense): - Pre-Tax Income (EBT): 305 Income Taxes: 122 Net Profit: 183$ Net Profit Margin: 28.2%
  • 9.
    Income Statement Summary IncomeStatement: Shows revenue to net profit over a PERIOD of time e.g. 1 year. Records only if product/service has been DELIVERED – irrelevant when payment occurs. To appear on the Income Statement: 1. Must correspond to the CURRENT period (i.e. only what you're paying an employee this quarter/month/year); AND 2. Must impact the company's taxes.
  • 10.
  • 11.
    BS – Assets,Liabilities, Equity Assets = Liabilities + Equity Assets: What the company owns that increases cash flow in the future. Liabilities: Obligations which reduce cash flow in the future. Equity: Funding source, relates to funds raised internally. Balance Sheet: 31-Dec-16 Assets: Current Assets: 420 Long-Term Assets: 1,580 Total Assets: 2,000$ Liabilities & Equity: Current Liabilities: 500 Long-Term Liabilities: 500 Equity: 1,000 Total Liabilities & Equity: 2,000$
  • 12.
    BS – CurrentAssets Cash: Physical currency and highly liquid investments. Accounts Receivable: Amount the company is owed by its clients after delivering product/service. Prepaid Expenses: Paying for expenses in advance. Inventory: Raw materials, in- process products, finished goods ready for sale. Balance Sheet: 31-Dec-16 Current Assets: Cash & Cash-Equivalents: 20$ Short-Term Investments: 100 Accounts Receivable: 100 Prepaid Expenses: 100 Inventory: 100 Total Current Assets: 420 Long-Term Assets: Plants, Property & Equipment: 1,000 Other Intangible Assets: 480 Long-Term Investments: 100 Total Long-Term Assets: 1,580 Total Assets: 2,000$
  • 13.
    BS – Long-TermAssets PP&E: Physical and illiquid assets (land, building, machinery) vital to core operations. Other Intangible assets: Intellectual property – patents, trademarks, copyrights etc. Investments: Company invests excess cash in stocks, bonds, money-markets, real estate etc. Balance Sheet: 31-Dec-16 Current Assets: Cash & Cash-Equivalents: 20$ Short-Term Investments: 100 Accounts Receivable: 100 Prepaid Expenses: 100 Inventory: 100 Total Current Assets: 420 Long-Term Assets: Plants, Property & Equipment: 1,000 Other Intangible Assets: 480 Long-Term Investments: 100 Total Long-Term Assets: 1,580 Total Assets: 2,000$
  • 14.
    BS – CurrentLiabilities Short-Term Debt: Incurred debt due within a year e.g. bank loans. Accounts Payable: Delivered items with specific invoices (legal, tax, marketing services, inventory etc.) with delayed payment. Accrued Expenses: Ongoing items (wages, monthly rent, utilities) with delayed payment. Balance Sheet: 31-Dec-16 Current Liabilities: Short-Term Debt: 100$ Accounts Payable: 200 Accrued Expenses: 200 Total Current Liabilities: 500 Long-Term Liabilities & Equity: Deferred Revenue: 200 Deferred Tax Liability: 200 Long-Term Debt: 100 Equity: 1,000 Total Long-Term Liabilities & Equity: 1,500 Total Liabilities & Equity: 2,000$
  • 15.
    BS – Long-TermLiabilities Deferred Revenue: Unrecognized revenue for products/services paid by customers, but not yet delivered. Deferred Tax Liability: Difference between accounting taxes and deferred taxes. Long-Term Debt: Incurred debt exceeding 1 year (bank loans, mortgage, bonds etc.). Balance Sheet: 31-Dec-16 Current Liabilities: Short-Term Debt: 100$ Accounts Payable: 200 Accrued Expenses: 200 Total Current Liabilities: 500 Long-Term Liabilities & Equity: Deferred Revenue: 200 Deferred Tax Liability: 200 Long-Term Debt: 100 Equity: 1,000 Total Long-Term Liabilities & Equity: 1,500 Total Liabilities & Equity: 2,000$
  • 16.
    BS - Equity Equity:Funding source for the business (money contributed by the owners, money raised by selling ownership, saved-up cumulative profits over time). Balance Sheet: 31-Dec-16 Current Liabilities: Short-Term Debt: 100$ Accounts Payable: 200 Accrued Expenses: 200 Total Current Liabilities: 500 Long-Term Liabilities & Equity: Deferred Revenue: 200 Deferred Tax Liability: 200 Long-Term Debt: 100 Equity: 1,000 Total Long-Term Liabilities & Equity: 1,500 Total Liabilities & Equity: 2,000$
  • 17.
    Balance Sheet Summary BalanceSheet: Shows the company's resources (Assets) and how it acquired those resources (Liabilities & Equity) at a specific date/point in time. Rule: Assets = Liabilities + Equity (BS should balance). Assets get acquired either through savings or by borrowing. Assets: Items owned, that result in additional future cash. Liabilities: Borrowings, that result in less cash in the future. Equity: Funding source, refers to money raised internally.
  • 18.
    The Cash FlowStatement
  • 19.
    CFS - Introduction CF:Tracks cash flow changes over a period of time e.g. 1 year. Operating: Change in cash flow from core business operations. Investing: Change in cash flow from purchasing investments and spending on increasing capital. Financing: Change in cash flow from raising debt or equity. Period 31-Dec-2015 to 31-Dec-2016 Cash Flow Statement: Cash Flow from Operating Activities: Net Income: 183$ Non-cash Expenses: 20 Change in Operating Working Capital: Change in Current Assets: (18) Change in Current Liabilities: 15 Cash Flow from Operations (A): 200$ Cash Flow from Investing Activities: Capital Expenditures (CapEx): (200)$ Purchases of Investments: - Cash Flow from Investing (B): (200)$ Cash Flow from Financing Activities: Debt Raised: 10$ Equity Issuance: 10 Cash Flow from Financing (C): 20$ Net Change in Cash (A+B+C): 20$ Beginning Cash Balance: -$ Ending Cash Balance: 20$
  • 20.
    CFS - Operations NetIncome/Profit: Starts off with Net Income/Profit, then tracks changes in operating items. Non-cash expenses: Get added back (+) as these don’t represent real cash expenses e.g. D&A. Working Capital: Factors in changes in Operational BS items over the period. Proxy of current assets & current liabilities. Period 31-Dec-2015 to 31-Dec-2016 Cash Flow Statement: Cash Flow from Operating Activities: Net Income: 183$ Non-cash Expenses: 20 Change in Operating Working Capital: Change in Current Assets: (18) Change in Current Liabilities: 15 Cash Flow from Operations (A): 200$ Cash Flow from Investing Activities: Capital Expenditures (CapEx): (200)$ Purchases of Investments: - Cash Flow from Investing (B): (200)$ Cash Flow from Financing Activities: Debt Raised: 10$ Equity Issuance: 10 Cash Flow from Financing (C): 20$ Net Change in Cash (A+B+C): 20$ Beginning Cash Balance: -$ Ending Cash Balance: 20$
  • 21.
    CFS - Investing CapEx:Spending on a long-term tangible asset e.g. purchasing machinery. Purchases/Sale of Investments: Spend extra cash on short and long term investments. Period 31-Dec-2015 to 31-Dec-2016 Cash Flow Statement: Cash Flow from Operating Activities: Net Income: 183$ Non-cash Expenses: 20 Change in Operating Working Capital: Change in Current Assets: (18) Change in Current Liabilities: 15 Cash Flow from Operations (A): 200$ Cash Flow from Investing Activities: Capital Expenditures (CapEx): (200)$ Purchases of Investments: - Cash Flow from Investing (B): (200)$ Cash Flow from Financing Activities: Debt Raised: 10$ Equity Issuance: 10 Cash Flow from Financing (C): 20$ Net Change in Cash (A+B+C): 20$ Beginning Cash Balance: -$ Ending Cash Balance: 20$
  • 22.
    CFS - Financing Debtand Equity issuances: Includes items like debt and equity issuances used to fund business operations. Ending Cash Balance: Final cash balance after accounting for cash changes over the period. Period 31-Dec-2015 to 31-Dec-2016 Cash Flow Statement: Cash Flow from Operating Activities: Net Income: 183$ Non-cash Expenses: 20 Change in Operating Working Capital: Change in Current Assets: (18) Change in Current Liabilities: 15 Cash Flow from Operations (A): 200$ Cash Flow from Investing Activities: Capital Expenditures (CapEx): (200)$ Purchases of Investments: - Cash Flow from Investing (B): (200)$ Cash Flow from Financing Activities: Debt Raised: 10$ Equity Issuance: 10 Cash Flow from Financing (C): 20$ Net Change in Cash (A+B+C): 20$ Beginning Cash Balance: -$ Ending Cash Balance: 20$
  • 23.
    Cash Flow Summary CashFlow Statement: Tracks money inflows and outflows over a period of time. Includes changes in cash flow from operating, investing and financing activities. It exists for 2 reasons: 1. Adjusts for non-cash revenues and expenses on the IS; AND 2. There may be additional cash inflows and outflows that have not appeared on the IS.
  • 24.
    Summary Income Statement: Reportsrevenues, expenses, and taxes over a PERIOD of time (1 year, 1 quarter etc.). Total revenues all the way down to the after-tax profit. Balance Sheet: The Balance Sheet shows the company's resources (Assets) and how it acquired those resources (Liabilities & Equity) at a specific point in time. Cash Flow Statement: Tracks money inflows and outflows over a period of time. Includes changes in cash flow from operating, investing and financing activities.
  • 25.