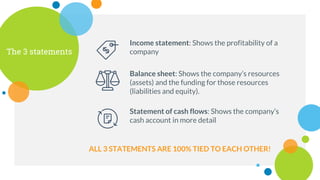
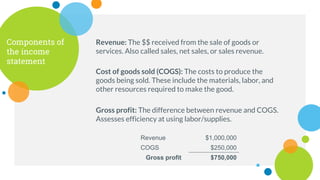
The document provides an overview of financial statement analysis and accounting principles. It explains that the three main financial statements - the income statement, balance sheet, and statement of cash flows - are interconnected and provide important information about a company's performance, financial position, and cash flows. Key accounting concepts discussed include the accounting equation, double-entry bookkeeping, accrual vs cash accounting, depreciation, and the components and uses of each financial statement. Understanding these statements and principles is important for evaluating business decisions.
There are 76 red xxx’s – each worth 1.18 points. You only need to.docxchristalgrieg
There are 76 red xxx’s – each worth 1.18 points. You only need to fill in where you see red xxx’s (big or small)
CHAPTER 1
THE McGEE CAKE COMPANY
1. The advantages to a LLC are: xxxx
The biggest disadvantage is: xxxx
2. .xxxx
C-2 CASE SOLUTIONS
3. .xxxx
CHAPTER 2
CASH FLOWS AND FINANCIAL STATEMENTS
Below are the financial statements that you are asked to prepare.
1. The income statement for each year will look like this:
Income Statement
2010
2011
Sales
xxxx
xxxx
Cost of goods sold
163,849
206,886
Selling and administrative
xxxx
xxxx
Depreciation
46,255
52,282
EBIT
$79,110
$90,584
Interest
10,056
11,526
EBT
$69,054
$79,058
Taxes (use the problem to figure
This amount out
xxxx
xxxx
Net income
$55,243
$63,246
Dividends(read the case to find out how much this is)
xxxx
xxxx
Addition to retained earnings
(this would be whatever the net income is less the dividends paid out)
xxxx
xxxx
2. The balance sheet for each year will be:
Balance Sheet as of Dec. 31, 2010
Cash
xxxx
Accounts payable
xxxx
Accounts receivable
xxxx
Notes payable
xxxx
Inventory
xxxx
Current liabilities
$60,832
Current assets
$72,651
Long-term debt
xxxxx
Net fixed assets
xxxxxx
Owners' equity
xxxxx
Total assets
$276,719
Total liab. and equity
$276,719
In the first year, equity is not given. Therefore, we must calculate equity as a plug variable. Since total liabilities and equity is equal to total assets, equity can be calculated as:
Equity = $276,719 – 60,832 – 103,006
Equity = $112,881
Balance Sheet as of Dec. 31, 2011
Cash
xxxx
Accounts payable
xxxx
Accounts receivable
xxxx
Notes payable
xxxx
Inventory
xxxx
Current liabilities
$68,121
Current assets
$100,834
Long-term debt
xxxx
Net fixed assets
xxxx
Owners' equity
Xxxx(see below)
Total assets
$349,459
Total liab. and equity
$349,459
The owner’s equity for 2011 is the beginning of year owner’s equity, plus the addition to retained earnings, plus the new equity, so:
Equity = $112,881 + 31,623 + 20,500
Equity = $165,004
3-6 are completed for you so you can answer the questions
3. Using the OCF equation: (
OCF = EBIT + Depreciation – Taxes
The OCF for each year is:
OCF2010 = $79,110 + 46,255 – 13,811
OCF2010 = $111,554
OCF2011 = $90,584 + 52,282 – 15,812
OCF2011 = $127,054
4.
To calculate the cash flow from assets, we need to find the capital spending and change in net working capital. The capital spending for the year was:
Capital spending
Ending net fixed assets
$248,625
– Beginning net fixed assets
204,068
+ Depreciation
52,282
Net capital spending
$96,839
And the change in net working capital was:
Change in net working capital
Ending NWC
$32,713
– Beginning NWC
11,819
Change in NWC
$20,894
So, the cash flow from assets was:
Cash flow from assets
Operating cash flow
$127,054
– Net capital spending
96,839
– Change in NWC
...
Answer discussion question in your own words. Answer must be at l.docxrossskuddershamus
Answer discussion question in your own words. Answer must be at least one paragraph.
Class, one of my favorite advertising subjects is subliminal advertising. What do you think? Is it going on and we don't know it? Describe how you think subliminal perception could be used by marketers to the detriment of us consumers.
Question 2
The income statement of Rodriquez Company is shown below.
RODRIQUEZ COMPANY
INCOME STATEMENT
FOR THE YEAR ENDED DECEMBER 31, 2012
Sales
$6,849,850
Cost of goods sold
Beginning inventory
$1,894,420
Purchases
4,331,190
Goods available for sale
6,225,610
Ending inventory
1,609,610
Cost of goods sold
4,616,000
Gross profit
2,233,850
Operating expenses
Selling expenses
450,650
Administrative expenses
700,340
1,150,990
Net income
$1,082,860
Additional information:
1.
Accounts receivable decreased $313,340 during the year.
2.
Prepaid expenses increased $166,770 during the year.
3.
Accounts payable to suppliers of merchandise decreased $281,430 during the year.
4.
Accrued expenses payable decreased $125,410 during the year.
5.
Administrative expenses include depreciation expense of $56,070.
Prepare the operating activities section of the statement of cash flows using the direct method.
RODRIQUEZ COMPANY
Statement of Cash Flows (Partial)
For the Year Ended December 31, 2012
363043671_0_9181195130080833_dropdown_93_resp_5
363043671_0_9181195130080833_dropdown_95_resp_1
$313340
63043671_0_9181195130080833_dropdown_1171_resp_2
$281430
63043671_0_9181195130080833_dropdown_1181_resp_3
281430
63043671_0_9181195130080833_dropdown_113_resp_8
$
LINK TO TEXT
First Example—2011
To illustrate a statement of cash flows, we use the first year of operations for Tax Consultants Inc. The company started on January 1, 2011, when it issued 60,000 shares of $1 par value common stock for $60,000 cash. The company rented its office space, furniture, and equipment, and performed tax consulting services throughout the first year. The comparative balance sheets at the beginning and end of the year 2011 appear in Illustration 23.3.
ILLUSTRATION 23.3
Comparative Balance Sheets, Tax Consultants Inc., Year 1
Illustration 23.4 shows the income statement and additional information for Tax Consultants.
ILLUSTRATION 23.4
Income Statement, Tax Consultants Inc., Year 1
Step 1: Determine the Change in Cash
LEARNING OBJECTIVE 3
Differentiate between net income and net cash flow from operating activities.
To prepare a statement of cash flows, the first step is to determine the change in cash. This is a simple computation. Tax Consultants had no cash on hand at the beginning of the year 2011. It had $49,000 on hand at the end of 2011. Thus, cash changed (increased) in 2011 by $49,000.
Step 2: Determine Net Cash Flow From Operating Activities
To determine net cash flow from operating activities,
3
“Net cash flow from operating activities” is a generic .
CFO Insight For Business Owners: How to Utilize Financial StatementsChase R. Morrison
CFO Insight: This is a primer on how to use financial statements to more effectively operate a privately held business and was used to educate new entrepreneurs at the Valley Economic Development Corporation in Sherman Oaks, CA.
Running head NAYBROSTRAND COMPANY1NAYBROSTRAND COMPANY 3.docxcharisellington63520
Running head: NAYBROSTRAND COMPANY 1
NAYBROSTRAND COMPANY 3
Naybrostrand Company
Name
Course Title
Institution
Date
Financial accounting is an important discipline in management of financial resources of an organization not to mention that it is a statutory requirement for organizations because it forms basis for determining statutory deductions such as taxes (Pinson, 2001). Various financial statements go into management of financial resources of an organization. Income statement is one such financial statement, which is useful in calculation of the profitability of an organization. It entails having the revenues for a given accounting period matched against the cost of goods sold in the same period to arrive at the gross profit realized in that period. The gross profit is then matched against the operating expenses for a given period to arrive at the profit before tax after, which tax is deducted to arrive at net income (Pinson, 2001).
It important to realize that, for matching principle to be followed strictly, some adjustments have to be done to the various accounts to ensure that they match with the period they are meant to represent. Failure to do the adjustment will defeat the very purpose of matching principle and accrual accounting. In the case of Naybrostrand, the first income statement was prepared without adjustment for sales, which were not purchased and therefore the net income had been overstated. Below is a new income statement where the adjustments for the sales had been done on the cost of goods sold (deduction of $42,500) this has led to higher gross profit and net income as well (Dupuis & Canada, 2004).
Naybrostrand income statement for the year ended
31st dec, 2012
Amount ($) amount ($)
Revenues 586,000
Cost of goods sold 264,500
Gross profit 321,500
Operating expenses
Depreciation expense 24,350
Insurance 1,400
Marketing 4,500
Rent 28,000
Salaries 78,500
Utilities 6,700
Total expenses 143,450
Profit before tax 178,050
Property taxes 16900
Net income/profit 161150
From the very outset, it is unrealistic to expect the income (notice that the accounts are in profit) to compare with the original income statement. It was important and material to adjust the accounts for the 42500 sales, which never materialized. This in return brought the cost of goods sold down and subsequently the gross profit and the net profit came up. Therefore, the earnings for the organization went up (Dupuis & Canada, 2004).
The accrual basis of accounting advocates that revenues and expenses be recognized in the accounting period when they are earned irrespective of whether cash is received or not. On the other hand, cash basis accounting advocates that revenues and expenses be recognized when cash is received or paid. The matching principle entails having the expenses and revenues being put in the same period they oc.
This presentation was made at the Washington Area Community Investment Fund (Wacif). This presentation goes over how to use financial statements and tools to make decisions.
Similar to Financial-Stmt-Analysis-Bootcamp-Slides.pdf (20)
how can I sell my pi coins for cash in a pi APPDOT TECH
You can't sell your pi coins in the pi network app. because it is not listed yet on any exchange.
The only way you can sell is by trading your pi coins with an investor (a person looking forward to hold massive amounts of pi coins before mainnet launch) .
You don't need to meet the investor directly all the trades are done with a pi vendor/merchant (a person that buys the pi coins from miners and resell it to investors)
I Will leave The telegram contact of my personal pi vendor, if you are finding a legitimate one.
@Pi_vendor_247
#pi network
#pi coins
#money
The European Unemployment Puzzle: implications from population agingGRAPE
We study the link between the evolving age structure of the working population and unemployment. We build a large new Keynesian OLG model with a realistic age structure, labor market frictions, sticky prices, and aggregate shocks. Once calibrated to the European economy, we quantify the extent to which demographic changes over the last three decades have contributed to the decline of the unemployment rate. Our findings yield important implications for the future evolution of unemployment given the anticipated further aging of the working population in Europe. We also quantify the implications for optimal monetary policy: lowering inflation volatility becomes less costly in terms of GDP and unemployment volatility, which hints that optimal monetary policy may be more hawkish in an aging society. Finally, our results also propose a partial reversal of the European-US unemployment puzzle due to the fact that the share of young workers is expected to remain robust in the US.
what is the best method to sell pi coins in 2024DOT TECH
The best way to sell your pi coins safely is trading with an exchange..but since pi is not launched in any exchange, and second option is through a VERIFIED pi merchant.
Who is a pi merchant?
A pi merchant is someone who buys pi coins from miners and pioneers and resell them to Investors looking forward to hold massive amounts before mainnet launch in 2026.
I will leave the telegram contact of my personal pi merchant to trade pi coins with.
@Pi_vendor_247
when will pi network coin be available on crypto exchange.DOT TECH
There is no set date for when Pi coins will enter the market.
However, the developers are working hard to get them released as soon as possible.
Once they are available, users will be able to exchange other cryptocurrencies for Pi coins on designated exchanges.
But for now the only way to sell your pi coins is through verified pi vendor.
Here is the telegram contact of my personal pi vendor
@Pi_vendor_247
Latino Buying Power - May 2024 Presentation for Latino CaucusDanay Escanaverino
Unlock the potential of Latino Buying Power with this in-depth SlideShare presentation. Explore how the Latino consumer market is transforming the American economy, driven by their significant buying power, entrepreneurial contributions, and growing influence across various sectors.
**Key Sections Covered:**
1. **Economic Impact:** Understand the profound economic impact of Latino consumers on the U.S. economy. Discover how their increasing purchasing power is fueling growth in key industries and contributing to national economic prosperity.
2. **Buying Power:** Dive into detailed analyses of Latino buying power, including its growth trends, key drivers, and projections for the future. Learn how this influential group’s spending habits are shaping market dynamics and creating opportunities for businesses.
3. **Entrepreneurial Contributions:** Explore the entrepreneurial spirit within the Latino community. Examine how Latino-owned businesses are thriving and contributing to job creation, innovation, and economic diversification.
4. **Workforce Statistics:** Gain insights into the role of Latino workers in the American labor market. Review statistics on employment rates, occupational distribution, and the economic contributions of Latino professionals across various industries.
5. **Media Consumption:** Understand the media consumption habits of Latino audiences. Discover their preferences for digital platforms, television, radio, and social media. Learn how these consumption patterns are influencing advertising strategies and media content.
6. **Education:** Examine the educational achievements and challenges within the Latino community. Review statistics on enrollment, graduation rates, and fields of study. Understand the implications of education on economic mobility and workforce readiness.
7. **Home Ownership:** Explore trends in Latino home ownership. Understand the factors driving home buying decisions, the challenges faced by Latino homeowners, and the impact of home ownership on community stability and economic growth.
This SlideShare provides valuable insights for marketers, business owners, policymakers, and anyone interested in the economic influence of the Latino community. By understanding the various facets of Latino buying power, you can effectively engage with this dynamic and growing market segment.
Equip yourself with the knowledge to leverage Latino buying power, tap into their entrepreneurial spirit, and connect with their unique cultural and consumer preferences. Drive your business success by embracing the economic potential of Latino consumers.
**Keywords:** Latino buying power, economic impact, entrepreneurial contributions, workforce statistics, media consumption, education, home ownership, Latino market, Hispanic buying power, Latino purchasing power.
Falcon stands out as a top-tier P2P Invoice Discounting platform in India, bridging esteemed blue-chip companies and eager investors. Our goal is to transform the investment landscape in India by establishing a comprehensive destination for borrowers and investors with diverse profiles and needs, all while minimizing risk. What sets Falcon apart is the elimination of intermediaries such as commercial banks and depository institutions, allowing investors to enjoy higher yields.
Currently pi network is not tradable on binance or any other exchange because we are still in the enclosed mainnet.
Right now the only way to sell pi coins is by trading with a verified merchant.
What is a pi merchant?
A pi merchant is someone verified by pi network team and allowed to barter pi coins for goods and services.
Since pi network is not doing any pre-sale The only way exchanges like binance/huobi or crypto whales can get pi is by buying from miners. And a merchant stands in between the exchanges and the miners.
I will leave the telegram contact of my personal pi merchant. I and my friends has traded more than 6000pi coins successfully
Tele-gram
@Pi_vendor_247
NO1 Uk Rohani Baba In Karachi Bangali Baba Karachi Online Amil Baba WorldWide...Amil baba
Contact with Dawood Bhai Just call on +92322-6382012 and we'll help you. We'll solve all your problems within 12 to 24 hours and with 101% guarantee and with astrology systematic. If you want to take any personal or professional advice then also you can call us on +92322-6382012 , ONLINE LOVE PROBLEM & Other all types of Daily Life Problem's.Then CALL or WHATSAPP us on +92322-6382012 and Get all these problems solutions here by Amil Baba DAWOOD BANGALI
#vashikaranspecialist #astrologer #palmistry #amliyaat #taweez #manpasandshadi #horoscope #spiritual #lovelife #lovespell #marriagespell#aamilbabainpakistan #amilbabainkarachi #powerfullblackmagicspell #kalajadumantarspecialist #realamilbaba #AmilbabainPakistan #astrologerincanada #astrologerindubai #lovespellsmaster #kalajaduspecialist #lovespellsthatwork #aamilbabainlahore#blackmagicformarriage #aamilbaba #kalajadu #kalailam #taweez #wazifaexpert #jadumantar #vashikaranspecialist #astrologer #palmistry #amliyaat #taweez #manpasandshadi #horoscope #spiritual #lovelife #lovespell #marriagespell#aamilbabainpakistan #amilbabainkarachi #powerfullblackmagicspell #kalajadumantarspecialist #realamilbaba #AmilbabainPakistan #astrologerincanada #astrologerindubai #lovespellsmaster #kalajaduspecialist #lovespellsthatwork #aamilbabainlahore #blackmagicforlove #blackmagicformarriage #aamilbaba #kalajadu #kalailam #taweez #wazifaexpert #jadumantar #vashikaranspecialist #astrologer #palmistry #amliyaat #taweez #manpasandshadi #horoscope #spiritual #lovelife #lovespell #marriagespell#aamilbabainpakistan #amilbabainkarachi #powerfullblackmagicspell #kalajadumantarspecialist #realamilbaba #AmilbabainPakistan #astrologerincanada #astrologerindubai #lovespellsmaster #kalajaduspecialist #lovespellsthatwork #aamilbabainlahore #Amilbabainuk #amilbabainspain #amilbabaindubai #Amilbabainnorway #amilbabainkrachi #amilbabainlahore #amilbabaingujranwalan #amilbabainislamabad
Resume
• Real GDP growth slowed down due to problems with access to electricity caused by the destruction of manoeuvrable electricity generation by Russian drones and missiles.
• Exports and imports continued growing due to better logistics through the Ukrainian sea corridor and road. Polish farmers and drivers stopped blocking borders at the end of April.
• In April, both the Tax and Customs Services over-executed the revenue plan. Moreover, the NBU transferred twice the planned profit to the budget.
• The European side approved the Ukraine Plan, which the government adopted to determine indicators for the Ukraine Facility. That approval will allow Ukraine to receive a EUR 1.9 bn loan from the EU in May. At the same time, the EU provided Ukraine with a EUR 1.5 bn loan in April, as the government fulfilled five indicators under the Ukraine Plan.
• The USA has finally approved an aid package for Ukraine, which includes USD 7.8 bn of budget support; however, the conditions and timing of the assistance are still unknown.
• As in March, annual consumer inflation amounted to 3.2% yoy in April.
• At the April monetary policy meeting, the NBU again reduced the key policy rate from 14.5% to 13.5% per annum.
• Over the past four weeks, the hryvnia exchange rate has stabilized in the UAH 39-40 per USD range.
US Economic Outlook - Being Decided - M Capital Group August 2021.pdfpchutichetpong
The U.S. economy is continuing its impressive recovery from the COVID-19 pandemic and not slowing down despite re-occurring bumps. The U.S. savings rate reached its highest ever recorded level at 34% in April 2020 and Americans seem ready to spend. The sectors that had been hurt the most by the pandemic specifically reduced consumer spending, like retail, leisure, hospitality, and travel, are now experiencing massive growth in revenue and job openings.
Could this growth lead to a “Roaring Twenties”? As quickly as the U.S. economy contracted, experiencing a 9.1% drop in economic output relative to the business cycle in Q2 2020, the largest in recorded history, it has rebounded beyond expectations. This surprising growth seems to be fueled by the U.S. government’s aggressive fiscal and monetary policies, and an increase in consumer spending as mobility restrictions are lifted. Unemployment rates between June 2020 and June 2021 decreased by 5.2%, while the demand for labor is increasing, coupled with increasing wages to incentivize Americans to rejoin the labor force. Schools and businesses are expected to fully reopen soon. In parallel, vaccination rates across the country and the world continue to rise, with full vaccination rates of 50% and 14.8% respectively.
However, it is not completely smooth sailing from here. According to M Capital Group, the main risks that threaten the continued growth of the U.S. economy are inflation, unsettled trade relations, and another wave of Covid-19 mutations that could shut down the world again. Have we learned from the past year of COVID-19 and adapted our economy accordingly?
“In order for the U.S. economy to continue growing, whether there is another wave or not, the U.S. needs to focus on diversifying supply chains, supporting business investment, and maintaining consumer spending,” says Grace Feeley, a research analyst at M Capital Group.
While the economic indicators are positive, the risks are coming closer to manifesting and threatening such growth. The new variants spreading throughout the world, Delta, Lambda, and Gamma, are vaccine-resistant and muddy the predictions made about the economy and health of the country. These variants bring back the feeling of uncertainty that has wreaked havoc not only on the stock market but the mindset of people around the world. MCG provides unique insight on how to mitigate these risks to possibly ensure a bright economic future.
how to sell pi coins on Bitmart crypto exchangeDOT TECH
Yes. Pi network coins can be exchanged but not on bitmart exchange. Because pi network is still in the enclosed mainnet. The only way pioneers are able to trade pi coins is by reselling the pi coins to pi verified merchants.
A verified merchant is someone who buys pi network coins and resell it to exchanges looking forward to hold till mainnet launch.
I will leave the telegram contact of my personal pi merchant to trade with.
@Pi_vendor_247
Introduction to Indian Financial System ()Avanish Goel
The financial system of a country is an important tool for economic development of the country, as it helps in creation of wealth by linking savings with investments.
It facilitates the flow of funds form the households (savers) to business firms (investors) to aid in wealth creation and development of both the parties
3. Why do you need
to know the
financial
statements?
Why everyone in business needs to understand the
financial statements:
1. Financial statements help you evaluate the
performance of a product, division, new initiative,
and/or the company as a whole.
2. Financial statements are a universal language that can
speak to everyone at the firm.
3. Financial statements help evaluate new business
decisions, investments, or initiatives.
4. The 3 statements
Income statement: Shows the profitability of a
company
Balance sheet: Shows the company’s resources
(assets) and the funding for those resources
(liabilities and equity).
Statement of cash flows: Shows the company’s
cash account in more detail
ALL 3 STATEMENTS ARE 100% TIED TO EACH OTHER!
7. Balance sheet: Shows the company’s resources
(assets) and the funding for those resources
(liabilities and equity).
Accounting equation: Assets = Liabilities + Equity
The accounting
equation
8. Accounting equation: Assets = Liabilities + Equity
The accounting
equation
Assets 2017 2016 2015
Current assets
Cash and cash equivalents 5,512,150
$ 723,050
$ 1,827,000
$
Accounts receivable 10,780,000 9,217,000 7,316,000
Inventory 6,135,000 5,093,000 2,268,000
Prepaid expenses and other assets 5,182,000 5,627,000 1,118,000
Total current assets 27,609,150
$ 20,660,050
$ 12,529,000
$
Property and equipment 26,598,000
$ 22,038,000
$ 11,296,000
$
Accumulated depreciation (9,444,000) (6,192,000) (3,801,000)
Property and equipment, net 17,154,000
$ 15,846,000
$ 7,495,000
$
Goodwill and other intangibles, net 47,600,000
$ 49,300,000
$ 300,000
$
Other long-term assets 3,389,000 3,146,000 3,085,000
Total other assets 50,989,000
$ 52,446,000
$ 3,385,000
$
Total assets 95,752,150
$ 88,952,050
$ 23,409,000
$
Liabilities and Stockholders' Equity
Current liabilities
Accounts payable 10,521,000
$ 9,753,000
$ 4,651,000
$
Accrued expenses 2,016,000 1,302,000 1,296,000
Current portion of long-term debt 5,505,500 5,141,000 546,000
Other current liabilities 7,330,000 7,968,000 3,081,000
Total current liabilities 25,372,500
$ 24,164,000
$ 9,574,000
$
Long-term liabilities
Long-term debt 13,820,000
$ 13,461,000
$ -
$
Other long-term liabilities 9,034,000 11,463,000 2,537,000
Total long-term liabilities 22,854,000
$ 24,924,000
$ 2,537,000
$
Stockholders' Equity
Common stock 34,736,500
$ 32,429,100
$ 4,623,100
$
Accumulated earnings 12,789,150 7,434,950 6,674,900
Total stockholders' equity 47,525,650
$ 39,864,050
$ 11,298,000
$
Total liabilities and stockholders' equity 95,752,150
$ 88,952,050
$ 23,409,000
$
10. Double entry
accounting
Definition: Every transaction involves two or more
accounts.
Example #1 (two accounts)
You borrow $25,000 from the bank. Your cash account
(asset on the balance sheet) will increase by $25,000 and
your notes payable account (liability on the balance sheet)
will also increase by $25,000.
Cash (asset)
$25,000
Note payable (liability)
$25,000
Equation balances:
Assets = Liabilities + SHE
11. Example #2 (three accounts)
You record revenue for the year of $75,000. You’ve been
paid $50,000 and $25,000 remains outstanding.
You would record $50,000 in cash (asset) and $25,000 in
accounts receivable (asset). You’d also record $75,000 in
retained earnings (stock holders equity).
Double entry
accounting
Cash (asset)
$50,000
A/R (asset)
$25,000
Retained earnings (SHE)
$75,000
Equation balances:
Assets = Liabilities + SHE
13. Cash vs. accrual
Cash accounting: Revenues and expenses are recorded
when money is actually received or spent. Only small
companies use this method due to ease of calculating.
14. Cash vs. accrual
Cash accounting: Revenues and expenses are recorded
when money is actually received or spent. Only small
companies use this method due to ease of calculating.
Example
You do $25,000 of work in 2017 and send these invoices
to customers. Of these invoices, you receive $15,000. The
remaining $10,000 is still outstanding. Income for 2017
would be $15,000 (the actual cash you received).
15. Cash vs. accrual
Accrual accounting: Revenues and expenses are recorded
when they are incurred. Larger companies use this method
to normalize earnings and give a more accurate picture of
the company.
16. Cash vs. accrual
Accrual accounting: Revenues and expenses are recorded
when they are incurred. Larger companies use this method
to normalize earnings and give a more accurate picture of
the company.
Example
You do $25,000 of work in 2017 and send these invoices
to customers. Of these invoices, you receive $15,000. The
remaining $10,000 is still outstanding. Income for 2017
would be $25,000 (the total revenue earned during the
year).
20. Depreciation and
amortization 2) You estimate that the machine has a useful life of 7
years. Because you are using it for 7 years, the accrual
principle states we shouldn’t expense it all in one year, but
rather over 7 years (depreciate it). So, when you buy the
machine, no expense is recorded. Therefore, the initial
double-entry would be:
How it works:
Cash (asset)
$70,000
Property and equipment (asset)
$70,000
Equation balances:
Assets = Liabilities + SHE
21. $10,000
Depreciation and
amortization 3) You’ll spread the expense of the machine (depreciate)
over a 7 year period, or $10,000/year. Notice that all the
cash went out when we bought it but there was no
“expense” recorded on the income stmt. We now record a
$10,000 expense each year, but it is a non-cash expense.
How it works:
Equipment (asset)
$10,000
Retained earnings (SHE)
Equation balances:
Assets = Liabilities + SHE
Retained earnings reduced b/c each year
net income is being reduced due to the
depreciation expense.
24. Income
statement
What is the purpose of the income statement?
1) Shows all of the revenues and expenses of the company
over a period of time.
2) As a result, shows the profitability of a company. But,
net income doesn’t tell you the whole profitability story.
3) Due to accrual accounting and one-off
expenses/income, net income might be under or over
stated.
25. Components of
the income
statement
Revenue: The $$ received from the sale of goods or
services. Also called sales, net sales, or sales revenue.
Cost of goods sold (COGS): The costs to produce the
goods being sold. These include the materials, labor, and
other resources required to make the good.
Gross profit: The difference between revenue and COGS.
Assesses efficiency at using labor/supplies.
Revenue $1,000,000
COGS $250,000
Gross profit $750,000
26. Selling, general, and administrative (SG&A): Includes
selling expenses, advertising expenses, rent, general
operating expenses, executive salaries, and everything
related to the general administration of the company.
Components of
the income
statement
Depreciation and amortization: The allocation of an
asset’s cost over the useful life of that asset.
Other operating expenses: Any other expense that is
related to the operation of the company. This does NOT
include one-time event items like merger expenses or
write-offs.
27. Interest expense: The interest, but NOT the principal,
paid on debt obligations. This is not considered an
operating expense and is put below the operating items
mentioned before.
Components of
the income
statement
Taxes: The federal and state taxes paid on the company’s
earnings. Does not include payroll taxes.
Net income: The revenue plus/minus all other
income/expenses at the company.
28. EBITDA
EBITDA is a way to evaluate a company's performance
without factoring in financing decisions, one-time events,
tax environments, and non-cash accounting items.
Generally, EBITDA more accurately shows the company’s
profitability.
EBITDA (pronounced e-bit-dah): Earnings Before Interest
Tax, Depreciation, and Amortization
29. EBITDA
Net income $500,000
+ Taxes $75,000
+ Interest $25,000
+Depr & amort $50,000
+/- One-time items ($15,000)
EBITDA $635,000
Example
EBITDA (pronounced e-bit-dah): Earnings Before Interest Tax,
Depreciation, and Amortization
32. EBITDA
Depreciation, amortization, and stock-
based compensation are both
“accounting” / non-cash expenses so we
can add these back in.
Real-life example
33. EBITDA
Net loss from operations ($2,213,767)
+ Depreciation & amortization $12,450
+ Stock-based compensation $1,992,121
EBITDA ($209,196)
There are other components we did not
include, but we can get close enough to
their reported number.
Real-life example
35. Balance sheet
What is the purpose of the balance sheet?
1) Shows all of the company’s resources (assets) and how
those resources are funded (liabilities and shareholders’
equity) at a single point in time.
2) Gives a fuller picture of the company’s financial
position.
3) Helps understand (in conjunction with the income
statement) the solvency and liquidity of the company
36. Assets vs.
liabilities vs.
stockholders’
equity
Assets: Something the company owns that will provide
future economic benefits.
Liabilities: The company’s future obligations to either pay
money or perform a service.
Stockholders’ equity: The amount of equity (on the books)
held by the company’s equity investors.
Accounting equation: Assets = Liabilities + Equity
37. Components of
the balance sheet
Current assets: Assets that are expected to be converted
into cash in the next year. Includes cash, short-term
investments, accounts receivable (outstanding invoices),
and inventory.
Property, plant, and equipment (PP&E): Any property,
buildings, machinery, computers, systems, etc. Value
usually shown as net, in other words, excluding the
accumulated depreciation.
Goodwill: An intangible asset (not a physical one) that is
the result of an acquisition of another company (paying
more than the assets are worth).
38. Components of
the balance sheet
Current liabilities: Liabilities that are debts or obligations
that are due in the next year. Includes accounts payable ($
you owe other companies), accrued expenses (expenses
not yet paid for, like salaries), and short-term debt (like a
credit card).
Long-term liabilities: A debt or obligation that is due after
one year. The biggest long-term liability is usually longer-
term debt.
Accumulated earnings (retained earnings): The
accumulated sum of the company’s net income, less any
dividends paid, from the beginning of time.
39. The link between
the income
statement and
balance sheet
Income
statement
Balance
sheet
+ =
Retained
earnings
Net income
Less: Dividends
41. Statement of
cash flows
What is the purpose of the cash flow statement?
1) Provides much greater detail of the cash line item on
the balance sheet (hint, this is how they are linked to each
other)
2) Gives a fuller picture of the income statement (helps us
calculate EBITDA).
3) Shows exactly how the company’s cash is being used
and where cash is coming from.
42. Components of
the cash flow
statement
Cash from operating activities: Cash coming in and going
out of the company as a result of day-to-day operations.
It’s usually calculated by starting with net income, adding
non-cash items, and adding and subtracting the difference
between current assets and liabilities from one period to
another.
43. Components of
the cash flow
statement
Revenue
+$10,000
Example
Cash flow statement
+$10,000
Accounts Receivable
BUT!!!
2016
$1,000
2017
$2,000
= $1,000 increase in A/R
So…
Only received $9,000 in cash
$10,000 in revenue - $1,000 in increase in A/R
44. Components of
the cash flow
statement
Cash from operating activities: Cash coming in and going
out of the company as a result of day-to-day operations.
It’s usually calculated by starting with net income, adding
non-cash items, and adding and subtracting the difference
between current assets and liabilities from one period to
another.
Cash from investing activities: Cash going out (almost
always going out) to buy long-term assets like property or
machinery.
45. Components of
the cash flow
statement
Cash from financing activities: Cash going out to
investors (interest, dividends, etc.) and cash coming in
from investors (debt proceeds, bonds, stock sales, etc.)
46. Cash flow
statement
Balance
sheet
+ =
Cash and cash
equivalents
(current asset)
Cash from ops
+ Cash from financing
+ Cash from investing
+ Beg. cash balance
= Ending cash
Link between
income
statement, BS,
and cash flow
statement
Income
statement
Net income
+
49. Revenue growth
Revenue growth: The annual (or monthly/quarterly) growth of
top-line revenue.
Calculation
(New value – Old value)/Old value
Example
Revenue in 2017 was $100,000 and $75,000 in 2016. The growth
would be 33.3% calculated as: ($100,000-$75,000)/$75,000.
General Rule: What is considered a “good” growth rate depends on your
industry, size of company, etc. You should compare your growth rate to
your closest competitors.
50. Compound
annual growth
rate (CAGR)
CAGR: The average growth rate over a period of time.
Calculation
(
𝐸𝑛𝑑𝑖𝑛𝑔 𝑣𝑎𝑙𝑢𝑒
𝐵𝑒𝑔𝑖𝑛𝑛𝑖𝑛𝑔 𝑣𝑎𝑙𝑢𝑒
)
(
1
#𝑦𝑒𝑎𝑟𝑠
)
− 1
Example
Revenue was $75,000, $100,000, and $125,000 from 2015-2017.
The CAGR would be [($125,000/$75,000)^(1/2)] -1 = 29.1%
Caution: This is not the actual growth rate each year, it is just a
convenient way to “normalize” the growth rate to one number.
51. EBITDA growth
EBITDA growth: The annual (or monthly/quarterly) growth of
EBITDA.
Calculation
(New value – Old value)/Old value
Example
EBITDA in 2017 was $50,000 and $35,000 in 2016. The growth
rate would be 42.9% calculated as: ($50,000-$35,000)/$35,000.
General Rule: EBITDA growth rate should be (hopefully) larger than the
revenue growth rate. This indicates the company is better managing or
optimizing their expenses.
52. Net income
growth
Net income growth: The annual (or monthly/quarterly) growth of
net income.
Calculation
(New value – Old value)/Old value
Example
Net income in 2017 was $25,000 and $20,000 in 2016. The growth
would be 25.0% calculated as: ($25,000-$20,000)/$20,000
Caution: Remember, net income includes non-cash items, one-time
events (like write-offs), etc. As a result, the net income growth rate is
not the best performance indicator.
54. Quick ratio
Quick ratio: Measures how well a company can cover its short-
term obligations (current liabilities).
Calculation
(Current assets – Inventory)/Current liabilities
Example
A company has current assets (including inventory) of $100,000,
inventory of $25,000 and current liabilities of $60,000. The quick
ratio would be 1.25x calculated as: ($100,000 - $25,000)/$60,000
General rule: The quick ratio should be above 1.0x. This means the
company can theoretically meet all of its short-term obligations. We
exclude inventory from the calculation since it is not easy to liquidate.
55. Leverage (debt-
to-EBITDA)
Leverage (debt-to-EBITDA): Measures how much debt a company
has compared to EBITDA.
Calculation
(Long-term debt + short-term debt)/EBITDA
Example
Company has $100,000 in long-term debt, $25,000 in short-term
debt, and EBITDA of $40,000. Leverage would be 3.1x calculated as:
($100,000 + $25,000)/$40,000
General rule: Leverage should be below 3.5x (depending on industry).
Anything above that is an excessive amount of debt, and the ability for
the company to service that debt would come into question.
56. Fixed charge
coverage ratio
Fixed charge coverage ratio (FCC): Measures how well the company can
service its fixed payment obligations with its earnings.
Calculation
EBITDA/Total fixed charges*
*Fixed charges include: Interest (income stmt), taxes (income stmt), debt
principal payments (cash flow stmt), capital expenditures (cash flow stmt),
and lease payments (income stmt).
Example
Company has $100,000 in EBITDA and $125,000 in fixed charges. The FCC
would be 0.8 calculated as: $100,000/$125,000.
General rule: FCC should be above 1.0x. If it is below that, the company must
raise $$$ (debt or equity) to cover these fixed charges.
58. Gross profit and
EBITDA margin
Gross profit and EBITDA margin: Gross profit margin mainly
measures a company’s production efficiency. The EBITDA margin
measures a company’s profitability.
Calculation
Gross profit (or EBITDA)/Revenue
Example
Company has $100,000 in revenue and $25,000 in COGS. The gross
profit margin would be 75% calculated as:
($100,000 - $25,000) / $100,000
General rule: Either ratio should be compared to competitors in your
field. Obviously, the higher the better.
59. Accounts payable
/ receivable days
AR/AP days: Measures the length of time it takes to receive your
receivables or pay your payables.
Calculation
(Accounts receivable/Revenue) x 365 days
(Accounts payable/COGS) x 365 days
Example
Company has $100,000 in accounts receivable and $750,000 in
revenue. The AR days would be 46 calculated as:
($100,000/$750,000) x 365.
General rule: You want AR days to be as low as possible (get cash
sooner) and AP days as long as possible (cash out later).
60. Free cash flow
Free cash flow (FCF): The cash a company generates after
spending the $$ required to maintain its assets.
Calculation
Net cash provided by (used in) operating activities – Capital expenditures
Example
Company generated $100,000 in operating cash flow and had $25,000
in capital expenditures. The FCF would be $75,000 calculated as:
$100,000 - $25,000.
General rule: FCF is difficult to compare across companies since its not
“normalized” as a ratio. However, it is an essential tool when looking at an
individual company and is essential when valuing a company.
61. ROA and ROE
Return on assets (ROA) : Measures how profitable a company is
compared to its assets.
Return on equity (ROE) : Measures how profitable a company is
compared to its equity.
Calculation
Net income/Total assets (ROA)
Net income/Average shareholders’ equity (ROE)
Example
Company has $1,000,000 in assets and $125,000 in net income.
The ROA would be 12.5% calculated as: $125,000/$1,000,000.
62. ROA and ROE
General rule: These ratios may seem similar, but they tell you two
distinct things about the company.
The item that separates the two is debt. Remember the accounting
equation? Assets = Liabilities + Equity. Therefore, if a company has
zero liabilities (no leverage), then the ROA and ROE will be the same
(since assets would equal equity at that point).
When a company takes on leverage, it increases assets while
decreasing the relative size of equity. Therefore, debt “supercharges”
ROE (the numerator, net income, stays the same in both equations
while the denominator for ROE becomes smaller).
If the company is highly levered, the ROE might paint a rosier picture
than reality. By using ROA, you can see the full picture.
65. Comparing
Airline Carriers
Spirit Southwest United
Revenue growth 8.4% 4.0% (3.5%)
EBITDA growth 1.6% 4.1% (5.2%)
Gross profit margin 39.4% 37.4% 37.4%
EBITDA margin 23.6% 24.8% 18.7%
Quick ratio 1.6x 0.6x 0.5x
Debt-to-EBITDA 1.8x 0.7x 1.7x
Free cash flow (248)
$ 822
$ 1,612
$
Free cash flow margin (10.7%) 4.0% 4.4%
When revenue grows faster than
EBITDA, that means margins are
decreasing (company is less profitable).
High growth companies will usually
sacrifice margin for growth.
66. Comparing
Airline Carriers
Spirit Southwest United
Revenue growth 8.4% 4.0% (3.5%)
EBITDA growth 1.6% 4.1% (5.2%)
Gross profit margin 39.4% 37.4% 37.4%
EBITDA margin 23.6% 24.8% 18.7%
Quick ratio 1.6x 0.6x 0.5x
Debt-to-EBITDA 1.8x 0.7x 1.7x
Free cash flow (248)
$ 822
$ 1,612
$
Free cash flow margin (10.7%) 4.0% 4.4%
High growth companies will sacrifice positive free
cash flow for the sake of growth. This strategy is
only sustainable if the company can successfully
raise more debt or equity. If it can’t, it’ll eventually
go bankrupt.
67. Comparing
Airline Carriers
Spirit Southwest United
Revenue growth 8.4% 4.0% (3.5%)
EBITDA growth 1.6% 4.1% (5.2%)
Gross profit margin 39.4% 37.4% 37.4%
EBITDA margin 23.6% 24.8% 18.7%
Quick ratio 1.6x 0.6x 0.5x
Debt-to-EBITDA 1.8x 0.7x 1.7x
Free cash flow (248)
$ 822
$ 1,612
$
Free cash flow margin (10.7%) 4.0% 4.4%
So, which is the healthiest company? Probably Southwest.
They have a sustainable growth rate, increasing margins,
low leverage, and positive free cash flow.