Download to read offline
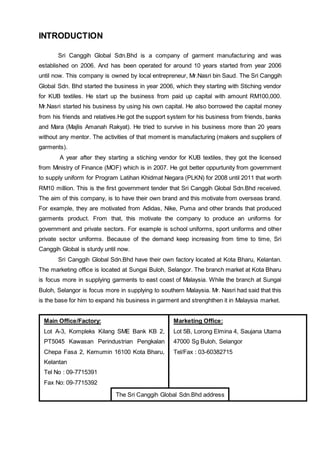

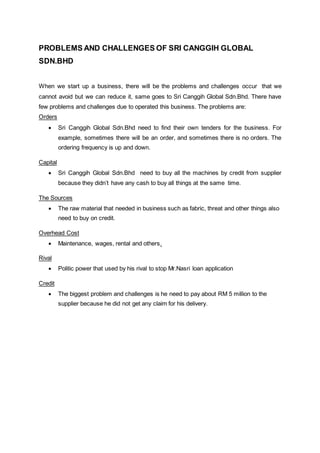
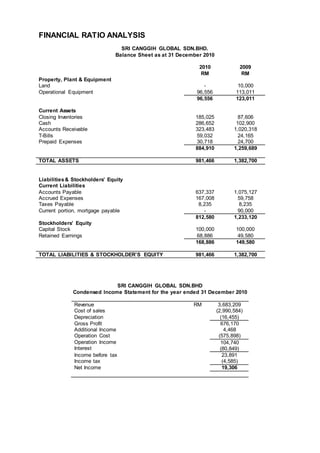
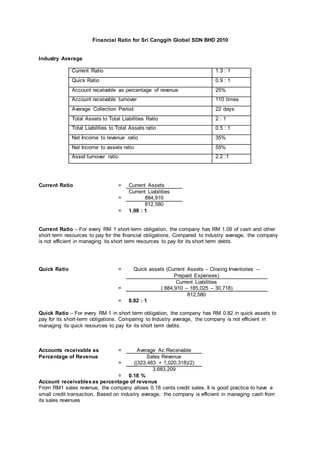

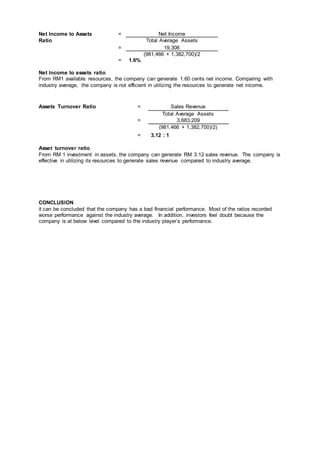
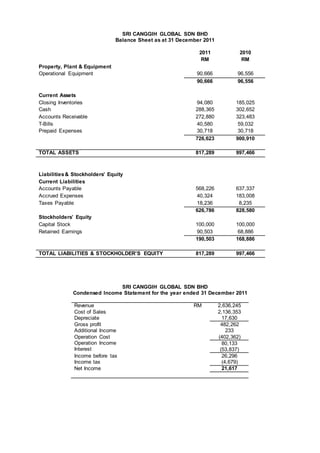

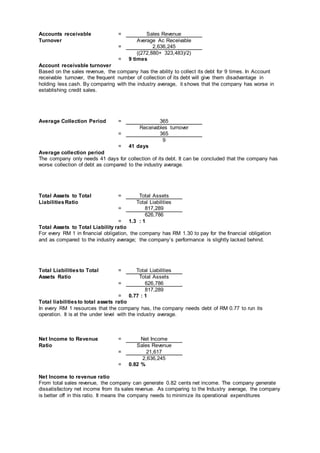
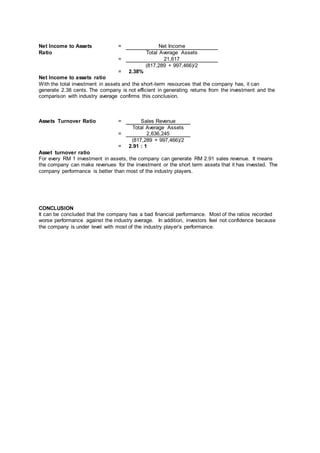
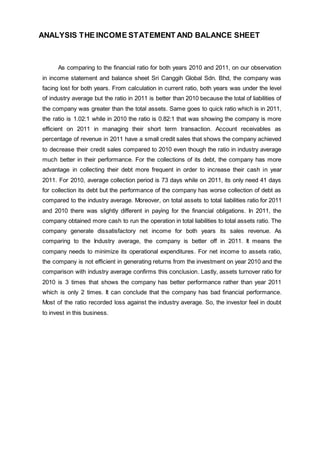

This document provides an introduction and overview of Sri Canggih Global Sdn. Bhd, a Malaysian garment manufacturing company established in 2006. It discusses the company's founding, products, facilities, challenges including obtaining orders and managing costs. Financial information is presented, including balance sheets from 2010-2011 and income statements. Ratio analyses show the company generally performed worse than industry averages in areas like collection periods, profitability and utilizing assets. In conclusion, while the company works to generate sales, its financial performance is below industry standards.


