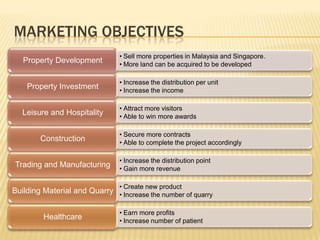
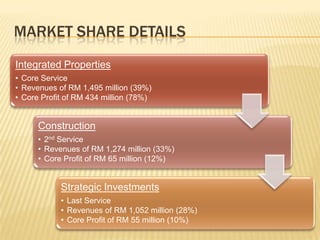
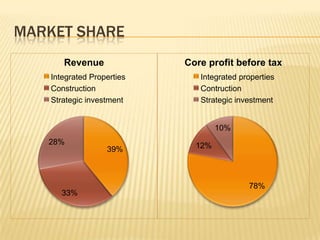
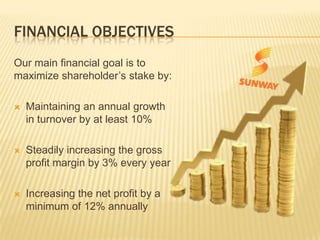
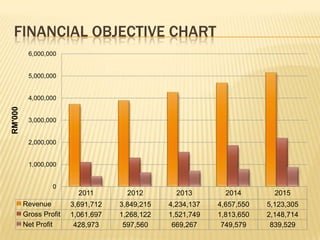
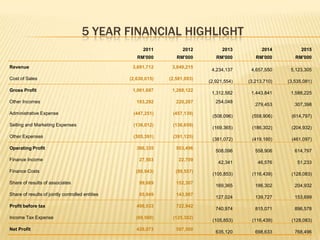
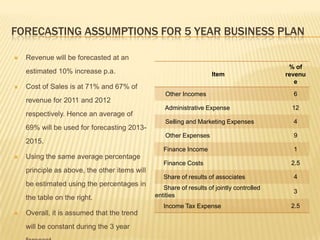
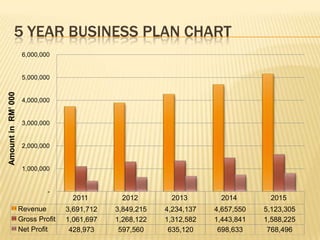
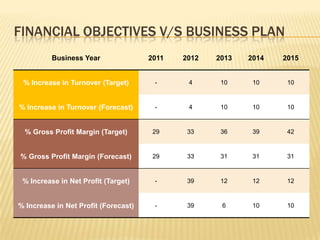
SlideShare a Scribd company logo
Presented by:
Lu Seng Hieng
Ishka Rogbeer
Tan Chew Yee
Teoh Beng Way
Bibiana Ellen Andai
Mohd Aizat Yusof
Ngee Wey Chern
INTRODUCTION
 Founded on the 26th January 1978
 Underwent several name changes and merging of small groups of
companies to form Sunway Berhad down the years
 Engaged in property and construction, but other divisions are
engaged in other businesses
 As at 1st April 2013, its market capitalisation stood at about RM3.8
billion
 Among the top 5 largest property stocks and top 100 largest
stocks in Malaysia
 The Group has 8000 strong workforce located in over 12 countries
CORPORATE MILESTONES
DATE MILESTONE
January 1978 Incorporation of Sunway Holdings
July 1982 Incorporation of Sunway City
February 1984 Listing of Sunway Holding
July 1996 Listing of Sunway City
June 1997 Listing of Sunway Construction
August 2004 Privatisation of Sunway Construction
July 2012 Listing of Sunway REIT
23rd August 2011 Merger of Sunway Holdings and Sunway City
 Malaysia’s 100 Leasing Graduate Employers on 22 November
2012
 By GTI Media
 South East Asia Property Awards 2012 on 21 November 2012
 By Ensign Media
 Malaysia’s Most Valuable Brand on 22 October 2012
 By Association of Accredited Advertising Agents Malaysia
 Malaysia Greentech Awards on 15 October 2012
 By Ministry of Energy, Green Technology and Water Malaysia and
Malaysian Green Technology Corporation
 Quality Assessment System n Construction (QLASSIC) on 2
August 2012
 By Construction Industry Development Board Malaysia
Integrated Properties
Property
Development
Property Investment
Leisure and
Hospitality
Construction
Strategic
Investments
Trading and
Manufacturing
Healthcare
Quarry and Building
Materials
MARKETING OBJECTIVES
• Sell more properties in Malaysia and Singapore.
• More land can be acquired to be developed
Property Development
• Increase the distribution per unit
• Increase the income
Property Investment
• Attract more visitors
• Able to win more awards
Leisure and Hospitality
• Secure more contracts
• Able to complete the project accordingly
Construction
• Increase the distribution point
• Gain more revenue
Trading and Manufacturing
• Create new product
• Increase the number of quarry
Building Material and Quarry
• Earn more profits
• Increase number of patient
Healthcare
MARKET SHARE DETAILS
Integrated Properties
• Core Service
• Revenues of RM 1,495 million (39%)
• Core Profit of RM 434 million (78%)
Construction
• 2nd Service
• Revenues of RM 1,274 million (33%)
• Core Profit of RM 65 million (12%)
Strategic Investments
• Last Service
• Revenues of RM 1,052 million (28%)
• Core Profit of RM 55 million (10%)
MARKET SHARE
39%
33%
28%
Revenue
Integrated Properties
Construction
Strategic investment
78%
12%
10%
Core profit before tax
Integrated properties
Contruction
Strategic investment
FINANCIAL OBJECTIVES
Our main financial goal is to
maximize shareholder’s stake by:
 Maintaining an annual growth
in turnover by at least 10%
 Steadily increasing the gross
profit margin by 3% every year
 Increasing the net profit by a
minimum of 12% annually
FINANCIAL OBJECTIVE CHART
2011 2012 2013 2014 2015
Revenue 3,691,712 3,849,215 4,234,137 4,657,550 5,123,305
Gross Profit 1,061,697 1,268,122 1,521,749 1,813,650 2,148,714
Net Profit 428,973 597,560 669,267 749,579 839,529
0
1,000,000
2,000,000
3,000,000
4,000,000
5,000,000
6,000,000
RM'000
5 YEAR FINANCIAL HIGHLIGHT
2011 2012 2013 2014 2015
RM'000 RM'000 RM'000 RM'000 RM'000
Revenue 3,691,712 3,849,215
4,234,137 4,657,550 5,123,305
Cost of Sales (2,630,015) (2,581,093)
(2,921,554) (3,213,710) (3,535,081)
Gross Profit 1,061,697 1,268,122
1,312,582 1,443,841 1,588,225
Other Incomes 193,292 220,297 254,048
279,453 307,398
Administrative Expense (447,251) (457,139)
(508,096) (558,906) (614,797)
Selling and Marketing Expenses (136,012) (136,659)
(169,365) (186,302) (204,932)
Other Expenses (305,391) (391,125)
(381,072) (419,180) (461,097)
Operating Profit 366,335 503,496
508,096 558,906 614,797
Finance Income 27,503 22,709
42,341 46,576 51,233
Finance Costs (80,943) (99,557)
(105,853) (116,439) (128,083)
Share of results of associates 99,689 152,307
169,365 186,302 204,932
Share of results of jointly controlled entities 85,949 143,987
127,024 139,727 153,699
Profit before tax 498,533 722,942
740,974 815,071 896,578
Income Tax Expense (69,560) (125,382)
(105,853) (116,439) (128,083)
Net Profit 428,973 597,560
635,120 698,633 768,496
FORECASTING ASSUMPTIONS FOR 5 YEAR BUSINESS PLAN
 Revenue will be forecasted at an
estimated 10% increase p.a.
 Cost of Sales is at 71% and 67% of
revenue for 2011 and 2012
respectively. Hence an average of
69% will be used for forecasting 2013-
2015.
 Using the same average percentage
principle as above, the other items will
be estimated using the percentages in
the table on the right.
 Overall, it is assumed that the trend
will be constant during the 3 year
Item
% of
revenu
e
Other Incomes 6
Administrative Expense 12
Selling and Marketing Expenses 4
Other Expenses 9
Finance Income 1
Finance Costs 2.5
Share of results of associates 4
Share of results of jointly controlled
entities
3
Income Tax Expense 2.5
5 YEAR BUSINESS PLAN CHART
2011 2012 2013 2014 2015
Revenue 3,691,712 3,849,215 4,234,137 4,657,550 5,123,305
Gross Profit 1,061,697 1,268,122 1,312,582 1,443,841 1,588,225
Net Profit 428,973 597,560 635,120 698,633 768,496
-
1,000,000
2,000,000
3,000,000
4,000,000
5,000,000
6,000,000
AmountinRM’000
FINANCIAL OBJECTIVES V/S BUSINESS PLAN
Business Year 2011 2012 2013 2014 2015
% Increase in Turnover (Target) - 4 10 10 10
% Increase in Turnover (Forecast) - 4 10 10 10
% Gross Profit Margin (Target) 29 33 36 39 42
% Gross Profit Margin (Forecast) 29 33 31 31 31
% Increase in Net Profit (Target) - 39 12 12 12
% Increase in Net Profit (Forecast) - 39 6 10 10
CONCLUSION
 Sunway Berhad has many different branches and therefore it is difficult to pin point
problems and recommend solutions to improve the overall finance of the company
 Instead of analyzing the overall financial statement of the whole company, it would be
wiser to analyze the annual report of the different branches separately
 It will then be easier to find out specific areas that requires improvement in each branch
 By studying the published annual reports, it can be observed that 2011 was at a low point
for Sunway Berhad. However, as from 2012 the situation of the company started getting
better.
 The main objective of the company should therefore be to continue this trend for the
upcoming years by continuously maximizing the turnover, gross profit margin and net
profit.
 By comparing the financial objectives with the 5 year business plan, it can be observed
that even though it is possible to meet the targeted 10% increase in turnover, Sunway
Berhad should find ways to decrease the overall cost of sales, so as to have an
Financial Management

More Related Content

What's hot

Sitara chemical industry........hj
Sitara chemical industry........hjSitara chemical industry........hj
Sitara chemical industry........hj
Arfan Afzal
 
Accounting Report - Financial Ratio Analysis
Accounting Report - Financial Ratio AnalysisAccounting Report - Financial Ratio Analysis
Accounting Report - Financial Ratio Analysis
Pang Shuen
 
Ratio Analysis in 'ROYAL CERAMIC LANKA PLC'
Ratio Analysis in 'ROYAL CERAMIC LANKA PLC'Ratio Analysis in 'ROYAL CERAMIC LANKA PLC'
Ratio Analysis in 'ROYAL CERAMIC LANKA PLC'
miranga88
 
accounting ratios and interpretation, Pepsi vs coca cola,
accounting ratios and interpretation, Pepsi vs coca cola, accounting ratios and interpretation, Pepsi vs coca cola,
accounting ratios and interpretation, Pepsi vs coca cola,
Priyesh Chheda
 
Accouting report
Accouting reportAccouting report
Accouting report
Tony Lung
 
Nestle financial report analysis 2013 & 2014
Nestle financial report analysis 2013 & 2014Nestle financial report analysis 2013 & 2014
Nestle financial report analysis 2013 & 2014
shahryar akram
 
Unilever- Finance Transformation
Unilever- Finance TransformationUnilever- Finance Transformation
Unilever- Finance Transformation
DILIP KUMAR
 
2017_BSC_Hall_of_Fame_Report_Renault
2017_BSC_Hall_of_Fame_Report_Renault2017_BSC_Hall_of_Fame_Report_Renault
2017_BSC_Hall_of_Fame_Report_Renault
Justin Hocevar
 
Case study presentation on kota fibers limited
Case study presentation on kota fibers limitedCase study presentation on kota fibers limited
Case study presentation on kota fibers limited
Chandresh Suprit
 
Financial ratio analysis of becacon pharma
Financial ratio analysis of becacon pharmaFinancial ratio analysis of becacon pharma
Financial ratio analysis of becacon pharma
Enamul Islam
 
Nestle advancee
Nestle advanceeNestle advancee
Nestle advancee
Arfan Afzal
 
Accounts ratio report
Accounts ratio reportAccounts ratio report
Accounts ratio report
Peishann97
 
Coca-Cola Financial Analysis
Coca-Cola Financial AnalysisCoca-Cola Financial Analysis
Coca-Cola Financial Analysis
Elie Obeid
 
DLADY – Fundamental Analysis FY14
DLADY – Fundamental Analysis FY14DLADY – Fundamental Analysis FY14
DLADY – Fundamental Analysis FY14
lcchong76
 
Apple Financial Analysis 2013-2014
Apple Financial Analysis 2013-2014Apple Financial Analysis 2013-2014
Apple Financial Analysis 2013-2014
Ferhan Resul
 
snx28238-012_BMK
snx28238-012_BMKsnx28238-012_BMK
snx28238-012_BMK
finance32
 
Accounting project - Financial Ratio Analysis
Accounting project - Financial Ratio AnalysisAccounting project - Financial Ratio Analysis
Accounting project - Financial Ratio Analysis
Haziq1511
 
Coke Financial Analysis
Coke Financial Analysis Coke Financial Analysis
Coke Financial Analysis
Dương Võ
 
Coca-cola financial analysis statement
Coca-cola financial analysis statementCoca-cola financial analysis statement
Coca-cola financial analysis statement
Dương Võ
 
Accounting assignment
Accounting assignmentAccounting assignment
Accounting assignment
Gan Jet Foong
 

What's hot (20)

Sitara chemical industry........hj
Sitara chemical industry........hjSitara chemical industry........hj
Sitara chemical industry........hj
 
Accounting Report - Financial Ratio Analysis
Accounting Report - Financial Ratio AnalysisAccounting Report - Financial Ratio Analysis
Accounting Report - Financial Ratio Analysis
 
Ratio Analysis in 'ROYAL CERAMIC LANKA PLC'
Ratio Analysis in 'ROYAL CERAMIC LANKA PLC'Ratio Analysis in 'ROYAL CERAMIC LANKA PLC'
Ratio Analysis in 'ROYAL CERAMIC LANKA PLC'
 
accounting ratios and interpretation, Pepsi vs coca cola,
accounting ratios and interpretation, Pepsi vs coca cola, accounting ratios and interpretation, Pepsi vs coca cola,
accounting ratios and interpretation, Pepsi vs coca cola,
 
Accouting report
Accouting reportAccouting report
Accouting report
 
Nestle financial report analysis 2013 & 2014
Nestle financial report analysis 2013 & 2014Nestle financial report analysis 2013 & 2014
Nestle financial report analysis 2013 & 2014
 
Unilever- Finance Transformation
Unilever- Finance TransformationUnilever- Finance Transformation
Unilever- Finance Transformation
 
2017_BSC_Hall_of_Fame_Report_Renault
2017_BSC_Hall_of_Fame_Report_Renault2017_BSC_Hall_of_Fame_Report_Renault
2017_BSC_Hall_of_Fame_Report_Renault
 
Case study presentation on kota fibers limited
Case study presentation on kota fibers limitedCase study presentation on kota fibers limited
Case study presentation on kota fibers limited
 
Financial ratio analysis of becacon pharma
Financial ratio analysis of becacon pharmaFinancial ratio analysis of becacon pharma
Financial ratio analysis of becacon pharma
 
Nestle advancee
Nestle advanceeNestle advancee
Nestle advancee
 
Accounts ratio report
Accounts ratio reportAccounts ratio report
Accounts ratio report
 
Coca-Cola Financial Analysis
Coca-Cola Financial AnalysisCoca-Cola Financial Analysis
Coca-Cola Financial Analysis
 
DLADY – Fundamental Analysis FY14
DLADY – Fundamental Analysis FY14DLADY – Fundamental Analysis FY14
DLADY – Fundamental Analysis FY14
 
Apple Financial Analysis 2013-2014
Apple Financial Analysis 2013-2014Apple Financial Analysis 2013-2014
Apple Financial Analysis 2013-2014
 
snx28238-012_BMK
snx28238-012_BMKsnx28238-012_BMK
snx28238-012_BMK
 
Accounting project - Financial Ratio Analysis
Accounting project - Financial Ratio AnalysisAccounting project - Financial Ratio Analysis
Accounting project - Financial Ratio Analysis
 
Coke Financial Analysis
Coke Financial Analysis Coke Financial Analysis
Coke Financial Analysis
 
Coca-cola financial analysis statement
Coca-cola financial analysis statementCoca-cola financial analysis statement
Coca-cola financial analysis statement
 
Accounting assignment
Accounting assignmentAccounting assignment
Accounting assignment
 

Similar to Financial Management

20220203financial results-presentation
20220203financial results-presentation20220203financial results-presentation
20220203financial results-presentation
SIOS Corporation
 
20220728financial-results-presentation.pdf
20220728financial-results-presentation.pdf20220728financial-results-presentation.pdf
20220728financial-results-presentation.pdf
SIOS Corporation
 
20220728financial-results-presentation.pdf
20220728financial-results-presentation.pdf20220728financial-results-presentation.pdf
20220728financial-results-presentation.pdf
SIOS Corporation
 
Financial management Group assignment
Financial management Group assignmentFinancial management Group assignment
Financial management Group assignment
Quo Ming
 
Project & Presentation By Lucky Cement Company With 7 Habits of Highly Effect...
Project & Presentation By Lucky Cement Company With 7 Habits of Highly Effect...Project & Presentation By Lucky Cement Company With 7 Habits of Highly Effect...
Project & Presentation By Lucky Cement Company With 7 Habits of Highly Effect...
manobili17
 
Financial Management Group Presentation Slides
Financial Management Group Presentation SlidesFinancial Management Group Presentation Slides
Financial Management Group Presentation Slides
Melvin Lim
 
20140603 lit
20140603 lit20140603 lit
20140603 lit
Shaen PD
 
20210203financial results-presentation
20210203financial results-presentation20210203financial results-presentation
20210203financial results-presentation
SIOS Corporation
 
20210729financial results-presentation
20210729financial results-presentation20210729financial results-presentation
20210729financial results-presentation
SIOS Corporation
 
Mahb
MahbMahb
Mahb
Wa Qeena
 
Q4 year end-2013 ASSA ABLOY invetors presentation 7 february
Q4 year end-2013 ASSA ABLOY invetors presentation 7 februaryQ4 year end-2013 ASSA ABLOY invetors presentation 7 february
Q4 year end-2013 ASSA ABLOY invetors presentation 7 february
ASSA ABLOY
 
AkzoNobel Q4 and full-year 2014 results Investor Update Presentation
AkzoNobel Q4 and full-year 2014 results Investor Update PresentationAkzoNobel Q4 and full-year 2014 results Investor Update Presentation
AkzoNobel Q4 and full-year 2014 results Investor Update Presentation
AkzoNobel
 
4 q12 arezzo_apresentacao_call eng
4 q12 arezzo_apresentacao_call eng4 q12 arezzo_apresentacao_call eng
4 q12 arezzo_apresentacao_call eng
Arezzori
 
AkzoNobel Q1 2013 Investor Presentation
AkzoNobel Q1 2013 Investor PresentationAkzoNobel Q1 2013 Investor Presentation
AkzoNobel Q1 2013 Investor Presentation
AkzoNobel
 
y2uR6ki5QAarkepIuRAGqQ_01854b7d7d56451f8d7f8e8db043fd10_3M-Company-Annual_Rep...
y2uR6ki5QAarkepIuRAGqQ_01854b7d7d56451f8d7f8e8db043fd10_3M-Company-Annual_Rep...y2uR6ki5QAarkepIuRAGqQ_01854b7d7d56451f8d7f8e8db043fd10_3M-Company-Annual_Rep...
y2uR6ki5QAarkepIuRAGqQ_01854b7d7d56451f8d7f8e8db043fd10_3M-Company-Annual_Rep...
GraceKagure1
 
Financial Ratio Analysis
Financial Ratio AnalysisFinancial Ratio Analysis
Financial Ratio Analysis
_NabilaHanim
 
Acc spritzer
Acc spritzerAcc spritzer
Acc spritzer
dhirazain
 
Sitara chemical by Muhammad Waqar
Sitara chemical by Muhammad WaqarSitara chemical by Muhammad Waqar
Sitara chemical by Muhammad Waqar
Muhammad Waqar
 
AkzoNobel Q4 and Full Year 2013 Results Investor Update Presentation
AkzoNobel Q4 and Full Year 2013 Results Investor Update PresentationAkzoNobel Q4 and Full Year 2013 Results Investor Update Presentation
AkzoNobel Q4 and Full Year 2013 Results Investor Update Presentation
AkzoNobel
 
20200205financial results-presentation.pdf
20200205financial results-presentation.pdf20200205financial results-presentation.pdf
20200205financial results-presentation.pdf
SIOS Corporation
 

Similar to Financial Management (20)

20220203financial results-presentation
20220203financial results-presentation20220203financial results-presentation
20220203financial results-presentation
 
20220728financial-results-presentation.pdf
20220728financial-results-presentation.pdf20220728financial-results-presentation.pdf
20220728financial-results-presentation.pdf
 
20220728financial-results-presentation.pdf
20220728financial-results-presentation.pdf20220728financial-results-presentation.pdf
20220728financial-results-presentation.pdf
 
Financial management Group assignment
Financial management Group assignmentFinancial management Group assignment
Financial management Group assignment
 
Project & Presentation By Lucky Cement Company With 7 Habits of Highly Effect...
Project & Presentation By Lucky Cement Company With 7 Habits of Highly Effect...Project & Presentation By Lucky Cement Company With 7 Habits of Highly Effect...
Project & Presentation By Lucky Cement Company With 7 Habits of Highly Effect...
 
Financial Management Group Presentation Slides
Financial Management Group Presentation SlidesFinancial Management Group Presentation Slides
Financial Management Group Presentation Slides
 
20140603 lit
20140603 lit20140603 lit
20140603 lit
 
20210203financial results-presentation
20210203financial results-presentation20210203financial results-presentation
20210203financial results-presentation
 
20210729financial results-presentation
20210729financial results-presentation20210729financial results-presentation
20210729financial results-presentation
 
Mahb
MahbMahb
Mahb
 
Q4 year end-2013 ASSA ABLOY invetors presentation 7 february
Q4 year end-2013 ASSA ABLOY invetors presentation 7 februaryQ4 year end-2013 ASSA ABLOY invetors presentation 7 february
Q4 year end-2013 ASSA ABLOY invetors presentation 7 february
 
AkzoNobel Q4 and full-year 2014 results Investor Update Presentation
AkzoNobel Q4 and full-year 2014 results Investor Update PresentationAkzoNobel Q4 and full-year 2014 results Investor Update Presentation
AkzoNobel Q4 and full-year 2014 results Investor Update Presentation
 
4 q12 arezzo_apresentacao_call eng
4 q12 arezzo_apresentacao_call eng4 q12 arezzo_apresentacao_call eng
4 q12 arezzo_apresentacao_call eng
 
AkzoNobel Q1 2013 Investor Presentation
AkzoNobel Q1 2013 Investor PresentationAkzoNobel Q1 2013 Investor Presentation
AkzoNobel Q1 2013 Investor Presentation
 
y2uR6ki5QAarkepIuRAGqQ_01854b7d7d56451f8d7f8e8db043fd10_3M-Company-Annual_Rep...
y2uR6ki5QAarkepIuRAGqQ_01854b7d7d56451f8d7f8e8db043fd10_3M-Company-Annual_Rep...y2uR6ki5QAarkepIuRAGqQ_01854b7d7d56451f8d7f8e8db043fd10_3M-Company-Annual_Rep...
y2uR6ki5QAarkepIuRAGqQ_01854b7d7d56451f8d7f8e8db043fd10_3M-Company-Annual_Rep...
 
Financial Ratio Analysis
Financial Ratio AnalysisFinancial Ratio Analysis
Financial Ratio Analysis
 
Acc spritzer
Acc spritzerAcc spritzer
Acc spritzer
 
Sitara chemical by Muhammad Waqar
Sitara chemical by Muhammad WaqarSitara chemical by Muhammad Waqar
Sitara chemical by Muhammad Waqar
 
AkzoNobel Q4 and Full Year 2013 Results Investor Update Presentation
AkzoNobel Q4 and Full Year 2013 Results Investor Update PresentationAkzoNobel Q4 and Full Year 2013 Results Investor Update Presentation
AkzoNobel Q4 and Full Year 2013 Results Investor Update Presentation
 
20200205financial results-presentation.pdf
20200205financial results-presentation.pdf20200205financial results-presentation.pdf
20200205financial results-presentation.pdf
 

Recently uploaded

Using Online job postings and survey data to understand labour market trends
Using Online job postings and survey data to understand labour market trendsUsing Online job postings and survey data to understand labour market trends
Using Online job postings and survey data to understand labour market trends
Labour Market Information Council | Conseil de l’information sur le marché du travail
 
Solution Manual For Financial Accounting, 8th Canadian Edition 2024, by Libby...
Solution Manual For Financial Accounting, 8th Canadian Edition 2024, by Libby...Solution Manual For Financial Accounting, 8th Canadian Edition 2024, by Libby...
Solution Manual For Financial Accounting, 8th Canadian Edition 2024, by Libby...
Donc Test
 
How Does CRISIL Evaluate Lenders in India for Credit Ratings
How Does CRISIL Evaluate Lenders in India for Credit RatingsHow Does CRISIL Evaluate Lenders in India for Credit Ratings
How Does CRISIL Evaluate Lenders in India for Credit Ratings
Shaheen Kumar
 
^%$Zone1:+971)581248768’][* Legit & Safe #Abortion #Pills #For #Sale In #Duba...
^%$Zone1:+971)581248768’][* Legit & Safe #Abortion #Pills #For #Sale In #Duba...^%$Zone1:+971)581248768’][* Legit & Safe #Abortion #Pills #For #Sale In #Duba...
^%$Zone1:+971)581248768’][* Legit & Safe #Abortion #Pills #For #Sale In #Duba...
mayaclinic18
 
一比一原版(UCL毕业证)伦敦大学|学院毕业证如何办理
一比一原版(UCL毕业证)伦敦大学|学院毕业证如何办理一比一原版(UCL毕业证)伦敦大学|学院毕业证如何办理
一比一原版(UCL毕业证)伦敦大学|学院毕业证如何办理
otogas
 
Bridging the gap: Online job postings, survey data and the assessment of job ...
Bridging the gap: Online job postings, survey data and the assessment of job ...Bridging the gap: Online job postings, survey data and the assessment of job ...
Bridging the gap: Online job postings, survey data and the assessment of job ...
Labour Market Information Council | Conseil de l’information sur le marché du travail
 
Pensions and housing - Pensions PlayPen - 4 June 2024 v3 (1).pdf
Pensions and housing - Pensions PlayPen - 4 June 2024 v3 (1).pdfPensions and housing - Pensions PlayPen - 4 June 2024 v3 (1).pdf
Pensions and housing - Pensions PlayPen - 4 June 2024 v3 (1).pdf
Henry Tapper
 
1. Elemental Economics - Introduction to mining.pdf
1. Elemental Economics - Introduction to mining.pdf1. Elemental Economics - Introduction to mining.pdf
1. Elemental Economics - Introduction to mining.pdf
Neal Brewster
 
FCCS Basic Accounts Outline and Hierarchy.pptx
FCCS Basic Accounts Outline and Hierarchy.pptxFCCS Basic Accounts Outline and Hierarchy.pptx
FCCS Basic Accounts Outline and Hierarchy.pptx
nalamynandan
 
一比一原版(IC毕业证)帝国理工大学毕业证如何办理
一比一原版(IC毕业证)帝国理工大学毕业证如何办理一比一原版(IC毕业证)帝国理工大学毕业证如何办理
一比一原版(IC毕业证)帝国理工大学毕业证如何办理
conose1
 
快速办理(SMU毕业证书)南卫理公会大学毕业证毕业完成信一模一样
快速办理(SMU毕业证书)南卫理公会大学毕业证毕业完成信一模一样快速办理(SMU毕业证书)南卫理公会大学毕业证毕业完成信一模一样
快速办理(SMU毕业证书)南卫理公会大学毕业证毕业完成信一模一样
5spllj1l
 
一比一原版(UoB毕业证)伯明翰大学毕业证如何办理
一比一原版(UoB毕业证)伯明翰大学毕业证如何办理一比一原版(UoB毕业证)伯明翰大学毕业证如何办理
一比一原版(UoB毕业证)伯明翰大学毕业证如何办理
nexop1
 
Money20/20 and EU Networking Event of 20/24!
Money20/20 and EU Networking Event of 20/24!Money20/20 and EU Networking Event of 20/24!
Money20/20 and EU Networking Event of 20/24!
FinTech Belgium
 
Instant Issue Debit Cards
Instant Issue Debit CardsInstant Issue Debit Cards
Instant Issue Debit Cards
egoetzinger
 
Detailed power point presentation on compound interest and how it is calculated
Detailed power point presentation on compound interest  and how it is calculatedDetailed power point presentation on compound interest  and how it is calculated
Detailed power point presentation on compound interest and how it is calculated
KishanChaudhary23
 
Instant Issue Debit Cards - School Designs
Instant Issue Debit Cards - School DesignsInstant Issue Debit Cards - School Designs
Instant Issue Debit Cards - School Designs
egoetzinger
 
OAT_RI_Ep20 WeighingTheRisks_May24_Trade Wars.pptx
OAT_RI_Ep20 WeighingTheRisks_May24_Trade Wars.pptxOAT_RI_Ep20 WeighingTheRisks_May24_Trade Wars.pptx
OAT_RI_Ep20 WeighingTheRisks_May24_Trade Wars.pptx
hiddenlevers
 
Who Is the Largest Producer of Soybean in India Now.pdf
Who Is the Largest Producer of Soybean in India Now.pdfWho Is the Largest Producer of Soybean in India Now.pdf
Who Is the Largest Producer of Soybean in India Now.pdf
Price Vision
 
What's a worker’s market? Job quality and labour market tightness
What's a worker’s market? Job quality and labour market tightnessWhat's a worker’s market? Job quality and labour market tightness
What's a worker’s market? Job quality and labour market tightness
Labour Market Information Council | Conseil de l’information sur le marché du travail
 
2. Elemental Economics - Mineral demand.pdf
2. Elemental Economics - Mineral demand.pdf2. Elemental Economics - Mineral demand.pdf
2. Elemental Economics - Mineral demand.pdf
Neal Brewster
 

Recently uploaded (20)

Using Online job postings and survey data to understand labour market trends
Using Online job postings and survey data to understand labour market trendsUsing Online job postings and survey data to understand labour market trends
Using Online job postings and survey data to understand labour market trends
 
Solution Manual For Financial Accounting, 8th Canadian Edition 2024, by Libby...
Solution Manual For Financial Accounting, 8th Canadian Edition 2024, by Libby...Solution Manual For Financial Accounting, 8th Canadian Edition 2024, by Libby...
Solution Manual For Financial Accounting, 8th Canadian Edition 2024, by Libby...
 
How Does CRISIL Evaluate Lenders in India for Credit Ratings
How Does CRISIL Evaluate Lenders in India for Credit RatingsHow Does CRISIL Evaluate Lenders in India for Credit Ratings
How Does CRISIL Evaluate Lenders in India for Credit Ratings
 
^%$Zone1:+971)581248768’][* Legit & Safe #Abortion #Pills #For #Sale In #Duba...
^%$Zone1:+971)581248768’][* Legit & Safe #Abortion #Pills #For #Sale In #Duba...^%$Zone1:+971)581248768’][* Legit & Safe #Abortion #Pills #For #Sale In #Duba...
^%$Zone1:+971)581248768’][* Legit & Safe #Abortion #Pills #For #Sale In #Duba...
 
一比一原版(UCL毕业证)伦敦大学|学院毕业证如何办理
一比一原版(UCL毕业证)伦敦大学|学院毕业证如何办理一比一原版(UCL毕业证)伦敦大学|学院毕业证如何办理
一比一原版(UCL毕业证)伦敦大学|学院毕业证如何办理
 
Bridging the gap: Online job postings, survey data and the assessment of job ...
Bridging the gap: Online job postings, survey data and the assessment of job ...Bridging the gap: Online job postings, survey data and the assessment of job ...
Bridging the gap: Online job postings, survey data and the assessment of job ...
 
Pensions and housing - Pensions PlayPen - 4 June 2024 v3 (1).pdf
Pensions and housing - Pensions PlayPen - 4 June 2024 v3 (1).pdfPensions and housing - Pensions PlayPen - 4 June 2024 v3 (1).pdf
Pensions and housing - Pensions PlayPen - 4 June 2024 v3 (1).pdf
 
1. Elemental Economics - Introduction to mining.pdf
1. Elemental Economics - Introduction to mining.pdf1. Elemental Economics - Introduction to mining.pdf
1. Elemental Economics - Introduction to mining.pdf
 
FCCS Basic Accounts Outline and Hierarchy.pptx
FCCS Basic Accounts Outline and Hierarchy.pptxFCCS Basic Accounts Outline and Hierarchy.pptx
FCCS Basic Accounts Outline and Hierarchy.pptx
 
一比一原版(IC毕业证)帝国理工大学毕业证如何办理
一比一原版(IC毕业证)帝国理工大学毕业证如何办理一比一原版(IC毕业证)帝国理工大学毕业证如何办理
一比一原版(IC毕业证)帝国理工大学毕业证如何办理
 
快速办理(SMU毕业证书)南卫理公会大学毕业证毕业完成信一模一样
快速办理(SMU毕业证书)南卫理公会大学毕业证毕业完成信一模一样快速办理(SMU毕业证书)南卫理公会大学毕业证毕业完成信一模一样
快速办理(SMU毕业证书)南卫理公会大学毕业证毕业完成信一模一样
 
一比一原版(UoB毕业证)伯明翰大学毕业证如何办理
一比一原版(UoB毕业证)伯明翰大学毕业证如何办理一比一原版(UoB毕业证)伯明翰大学毕业证如何办理
一比一原版(UoB毕业证)伯明翰大学毕业证如何办理
 
Money20/20 and EU Networking Event of 20/24!
Money20/20 and EU Networking Event of 20/24!Money20/20 and EU Networking Event of 20/24!
Money20/20 and EU Networking Event of 20/24!
 
Instant Issue Debit Cards
Instant Issue Debit CardsInstant Issue Debit Cards
Instant Issue Debit Cards
 
Detailed power point presentation on compound interest and how it is calculated
Detailed power point presentation on compound interest  and how it is calculatedDetailed power point presentation on compound interest  and how it is calculated
Detailed power point presentation on compound interest and how it is calculated
 
Instant Issue Debit Cards - School Designs
Instant Issue Debit Cards - School DesignsInstant Issue Debit Cards - School Designs
Instant Issue Debit Cards - School Designs
 
OAT_RI_Ep20 WeighingTheRisks_May24_Trade Wars.pptx
OAT_RI_Ep20 WeighingTheRisks_May24_Trade Wars.pptxOAT_RI_Ep20 WeighingTheRisks_May24_Trade Wars.pptx
OAT_RI_Ep20 WeighingTheRisks_May24_Trade Wars.pptx
 
Who Is the Largest Producer of Soybean in India Now.pdf
Who Is the Largest Producer of Soybean in India Now.pdfWho Is the Largest Producer of Soybean in India Now.pdf
Who Is the Largest Producer of Soybean in India Now.pdf
 
What's a worker’s market? Job quality and labour market tightness
What's a worker’s market? Job quality and labour market tightnessWhat's a worker’s market? Job quality and labour market tightness
What's a worker’s market? Job quality and labour market tightness
 
2. Elemental Economics - Mineral demand.pdf
2. Elemental Economics - Mineral demand.pdf2. Elemental Economics - Mineral demand.pdf
2. Elemental Economics - Mineral demand.pdf
 

Financial Management

  • 1. Presented by: Lu Seng Hieng Ishka Rogbeer Tan Chew Yee Teoh Beng Way Bibiana Ellen Andai Mohd Aizat Yusof Ngee Wey Chern
  • 2. INTRODUCTION  Founded on the 26th January 1978  Underwent several name changes and merging of small groups of companies to form Sunway Berhad down the years  Engaged in property and construction, but other divisions are engaged in other businesses  As at 1st April 2013, its market capitalisation stood at about RM3.8 billion  Among the top 5 largest property stocks and top 100 largest stocks in Malaysia  The Group has 8000 strong workforce located in over 12 countries
  • 3. CORPORATE MILESTONES DATE MILESTONE January 1978 Incorporation of Sunway Holdings July 1982 Incorporation of Sunway City February 1984 Listing of Sunway Holding July 1996 Listing of Sunway City June 1997 Listing of Sunway Construction August 2004 Privatisation of Sunway Construction July 2012 Listing of Sunway REIT 23rd August 2011 Merger of Sunway Holdings and Sunway City
  • 4.  Malaysia’s 100 Leasing Graduate Employers on 22 November 2012  By GTI Media  South East Asia Property Awards 2012 on 21 November 2012  By Ensign Media  Malaysia’s Most Valuable Brand on 22 October 2012  By Association of Accredited Advertising Agents Malaysia  Malaysia Greentech Awards on 15 October 2012  By Ministry of Energy, Green Technology and Water Malaysia and Malaysian Green Technology Corporation  Quality Assessment System n Construction (QLASSIC) on 2 August 2012  By Construction Industry Development Board Malaysia
  • 5.
  • 6. Integrated Properties Property Development Property Investment Leisure and Hospitality Construction Strategic Investments Trading and Manufacturing Healthcare Quarry and Building Materials
  • 7. MARKETING OBJECTIVES • Sell more properties in Malaysia and Singapore. • More land can be acquired to be developed Property Development • Increase the distribution per unit • Increase the income Property Investment • Attract more visitors • Able to win more awards Leisure and Hospitality • Secure more contracts • Able to complete the project accordingly Construction • Increase the distribution point • Gain more revenue Trading and Manufacturing • Create new product • Increase the number of quarry Building Material and Quarry • Earn more profits • Increase number of patient Healthcare
  • 8. MARKET SHARE DETAILS Integrated Properties • Core Service • Revenues of RM 1,495 million (39%) • Core Profit of RM 434 million (78%) Construction • 2nd Service • Revenues of RM 1,274 million (33%) • Core Profit of RM 65 million (12%) Strategic Investments • Last Service • Revenues of RM 1,052 million (28%) • Core Profit of RM 55 million (10%)
  • 9. MARKET SHARE 39% 33% 28% Revenue Integrated Properties Construction Strategic investment 78% 12% 10% Core profit before tax Integrated properties Contruction Strategic investment
  • 10. FINANCIAL OBJECTIVES Our main financial goal is to maximize shareholder’s stake by:  Maintaining an annual growth in turnover by at least 10%  Steadily increasing the gross profit margin by 3% every year  Increasing the net profit by a minimum of 12% annually
  • 11. FINANCIAL OBJECTIVE CHART 2011 2012 2013 2014 2015 Revenue 3,691,712 3,849,215 4,234,137 4,657,550 5,123,305 Gross Profit 1,061,697 1,268,122 1,521,749 1,813,650 2,148,714 Net Profit 428,973 597,560 669,267 749,579 839,529 0 1,000,000 2,000,000 3,000,000 4,000,000 5,000,000 6,000,000 RM'000
  • 12. 5 YEAR FINANCIAL HIGHLIGHT 2011 2012 2013 2014 2015 RM'000 RM'000 RM'000 RM'000 RM'000 Revenue 3,691,712 3,849,215 4,234,137 4,657,550 5,123,305 Cost of Sales (2,630,015) (2,581,093) (2,921,554) (3,213,710) (3,535,081) Gross Profit 1,061,697 1,268,122 1,312,582 1,443,841 1,588,225 Other Incomes 193,292 220,297 254,048 279,453 307,398 Administrative Expense (447,251) (457,139) (508,096) (558,906) (614,797) Selling and Marketing Expenses (136,012) (136,659) (169,365) (186,302) (204,932) Other Expenses (305,391) (391,125) (381,072) (419,180) (461,097) Operating Profit 366,335 503,496 508,096 558,906 614,797 Finance Income 27,503 22,709 42,341 46,576 51,233 Finance Costs (80,943) (99,557) (105,853) (116,439) (128,083) Share of results of associates 99,689 152,307 169,365 186,302 204,932 Share of results of jointly controlled entities 85,949 143,987 127,024 139,727 153,699 Profit before tax 498,533 722,942 740,974 815,071 896,578 Income Tax Expense (69,560) (125,382) (105,853) (116,439) (128,083) Net Profit 428,973 597,560 635,120 698,633 768,496
  • 13. FORECASTING ASSUMPTIONS FOR 5 YEAR BUSINESS PLAN  Revenue will be forecasted at an estimated 10% increase p.a.  Cost of Sales is at 71% and 67% of revenue for 2011 and 2012 respectively. Hence an average of 69% will be used for forecasting 2013- 2015.  Using the same average percentage principle as above, the other items will be estimated using the percentages in the table on the right.  Overall, it is assumed that the trend will be constant during the 3 year Item % of revenu e Other Incomes 6 Administrative Expense 12 Selling and Marketing Expenses 4 Other Expenses 9 Finance Income 1 Finance Costs 2.5 Share of results of associates 4 Share of results of jointly controlled entities 3 Income Tax Expense 2.5
  • 14. 5 YEAR BUSINESS PLAN CHART 2011 2012 2013 2014 2015 Revenue 3,691,712 3,849,215 4,234,137 4,657,550 5,123,305 Gross Profit 1,061,697 1,268,122 1,312,582 1,443,841 1,588,225 Net Profit 428,973 597,560 635,120 698,633 768,496 - 1,000,000 2,000,000 3,000,000 4,000,000 5,000,000 6,000,000 AmountinRM’000
  • 15. FINANCIAL OBJECTIVES V/S BUSINESS PLAN Business Year 2011 2012 2013 2014 2015 % Increase in Turnover (Target) - 4 10 10 10 % Increase in Turnover (Forecast) - 4 10 10 10 % Gross Profit Margin (Target) 29 33 36 39 42 % Gross Profit Margin (Forecast) 29 33 31 31 31 % Increase in Net Profit (Target) - 39 12 12 12 % Increase in Net Profit (Forecast) - 39 6 10 10
  • 16. CONCLUSION  Sunway Berhad has many different branches and therefore it is difficult to pin point problems and recommend solutions to improve the overall finance of the company  Instead of analyzing the overall financial statement of the whole company, it would be wiser to analyze the annual report of the different branches separately  It will then be easier to find out specific areas that requires improvement in each branch  By studying the published annual reports, it can be observed that 2011 was at a low point for Sunway Berhad. However, as from 2012 the situation of the company started getting better.  The main objective of the company should therefore be to continue this trend for the upcoming years by continuously maximizing the turnover, gross profit margin and net profit.  By comparing the financial objectives with the 5 year business plan, it can be observed that even though it is possible to meet the targeted 10% increase in turnover, Sunway Berhad should find ways to decrease the overall cost of sales, so as to have an