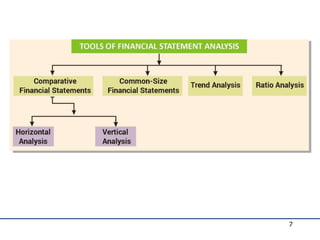
SlideShare a Scribd company logo
1 of 42
Financial Statement
Analysis and Interpretation
1
Key to Quality Lending
Damodar Shrestha
OUTLINE
• Overview of FS analysis and
interpretation
• Types of FS and its usages
• FS as per credit exposure
• FS analysis as per lender needs
2
Financial Statement & Ratio
Analysis
3
Financial Analysis
• Assessment of the firm’s past,
present and future financial
conditions
• Done to find firm’s financial
strengths and weaknesses
• Primary Tools:
– Financial Statements
– Comparison of financial ratios to past,
industry, sector and all firms
4
Financial Statements
•Balance Sheet
•Income Statement
•Cashflow Statement
•Statement of Retained
Earnings
5
6
7
Objectives of Ratio Analysis
• Standardize financial information for
comparisons
• Evaluate current operations
• Compare performance with past
performance
• Compare performance against other
firms or industry standards
• Study the efficiency of operations
• Study the risk of operations
8
Ratio Analysis
9
Ratio Analysis
1. Liquidity – the ability of the firm to pay its way
2. Investment/shareholders – information to enable
decisions to be made on the extent of the risk and the
earning potential of a business investment
3. Gearing – information on the relationship between
the exposure of the business to loans as opposed to
share capital
4. Profitability – how effective the firm is at generating
profits given sales and or its capital assets
5. Financial – the rate at which the company sells its
stock and the efficiency with which it uses its assets
10
Liquidity
11
Acid Test
• Also referred to as the ‘Quick ratio’
• (Current assets – stock) : liabilities
• 1:1 seen as ideal
• The omission of stock gives an indication of the cash the
firm has in relation to its liabilities (what it owes)
• A ratio of 3:1 therefore would suggest the firm has 3
times as much cash as it owes – very healthy!
• A ratio of 0.5:1 would suggest the firm has twice as
many liabilities as it has cash to pay for those liabilities.
This might put the firm under pressure but is not in
itself the end of the world!
12
Current Ratio
• Looks at the ratio between Current Assets and Current
Liabilities
• Current Ratio = Current Assets : Current
Liabilities
• Ideal level? – 1.5 : 1
• A ratio of 5 : 1 would imply the firm has £5 of assets to
cover every £1 in liabilities
• A ratio of 0.75 : 1 would suggest the firm has only 75p
in assets available to cover every £1 it owes
• Too high – Might suggest that too much of its assets are
tied up in unproductive activities – too much stock, for
example?
• Too low - risk of not being able to pay your way
13
Investment/Shareholders
14
Investment/Shareholders
• Earnings per share – profit after tax / number of
shares
• Price earnings ratio – market price / earnings per
share – the higher the better generally for
company. Comparison with other firms helps to
identify value placed on the market of the business.
• EV / EBITDA Ratio - Enterprise Value / EBITDA
ratio - the higher the better generally for company .
It measures the operational performance of the
firm.
• Dividend yield – ordinary share dividend / market
price x 100 – higher the better. Relates the return
on the investment to the share price.
15
Gearing
16
Gearing
• Gearing Ratio = Long term
loans / Capital employed x 100
• The higher the ratio the more the
business is exposed to interest
rate fluctuations and to having to
pay back interest and loans before
being able to re-invest earnings
17
Profitability
18
Profitability
• Profitability measures look at how much
profit the firm generates from sales or
from its capital assets
• Different measures of profit – gross and
net
– Gross profit – effectively total revenue
(turnover) – variable costs (cost of sales)
– Net Profit – effectively total revenue
(turnover) – variable costs and fixed costs
(overheads)
19
Profitability
• Gross Profit Margin = Gross profit /
turnover x 100
• The higher the better
• Enables the firm to assess the impact of
its sales and how much it cost to
generate (produce) those sales
• A gross profit margin of 45% means
that for every £1 of sales, the firm
makes 45p in gross profit
20
Profitability
• Net Profit Margin = Net Profit / Turnover
x 100
• Net profit takes into account the fixed costs
involved in production – the overheads
• Keeping control over fixed costs is important –
could be easy to overlook for example the
amount of waste - paper, stationery, lighting,
heating, water, etc.
– e.g. – leaving a photocopier on overnight uses enough
electricity to make 5,300 A4 copies. (1,934,500 per year)
– 1 ream = 500 copies. 1 ream = £5.00 (on average)
– Total cost therefore = £19,345 per year – or 1 person’s
salary
21
Profitability
• Return on Capital Employed
(ROCE) = Profit / capital
employed x 100
22
Profitability
• The higher the better
• Shows how effective the firm is in
using its capital to generate profit
• A ROCE of 25% means that it uses
every £1 of capital to generate 25p
in profit
• Partly a measure of efficiency in
organisation and use of capital
23
Financial
24
Asset Turnover
• Asset Turnover = Sales turnover / assets
employed
• Using assets to generate profit
• Asset turnover x net profit margin = ROCE
25
Stock Turnover
• Stock turnover = Cost of goods sold / stock
expressed as times per year
• The rate at which a company’s stock is turned over
• A high stock turnover might mean increased efficiency?
– But: dependent on the type of business –
supermarkets might have high stock turnover ratios
whereas a shop selling high value musical
instruments might have low stock turnover ratio
– Low stock turnover could mean poor customer
satisfaction if people are not buying the goods
(Marks and Spencer?)
26
Debtor Days
• Debtor Days = Debtors / sales turnover x
365
• Shorter the better
• Gives a measure of how long it takes the
business to recover debts
• Can be skewed by the degree of credit facility
a firm offers
27
Before looking at the ratios there are a number of cautionary
points concerning their use that need to be identified :
a. The dates and duration of the financial statements being
compared should be the same. If not, the effects of
seasonality may cause erroneous conclusions to be drawn.
b. The accounts to be compared should have been prepared
on the same bases. Different treatment of stocks or
depreciations or asset valuations will distort the results.
c. In order to judge the overall performance of the firm a
group of ratios, as opposed to just one or two should be
used. In order to identify trends at least three years of
ratios are normally required.
28
SOME IMPORTANT NOTES
• Liabilities have Credit balance and Assets have Debit balance
• Current Liabilities are those which have either become due for
payment or shall fall due for payment within 12 months from
the date of Balance Sheet
• Current Assets are those which undergo change in their
shape/form within 12 months. These are also called Working
Capital or Gross Working Capital
• Net Worth & Long Term Liabilities are also called Long Term
Sources of Funds
• Current Liabilities are known as Short Term Sources of
Funds
• Long Term Liabilities & Short Term Liabilities are also called
Outside Liabilities
• Current Assets are Short Term Use of Funds
29
SOME IMPORTANT NOTES
• Assets other than Current Assets are Long Term Use of
Funds
• Installments of Term Loan Payable in 12 months are to be
taken as Current Liability only for Calculation of Current Ratio
& Quick Ratio.
• If there is profit it shall become part of Net Worth under the
head Reserves and if there is loss it will become part of
Intangible Assets
• Investments in Govt. Securities to be treated current only if
these are marketable and due. Investments in other securities
are to be treated Current if they are quoted. Investments in
allied/associate/sister units or firms to be treated as Non-
current.
• Bonus Shares as issued by capitalization of General reserves
and as such do not affect the Net Worth. With Rights Issue,
change takes place in Net Worth and Current Ratio.
30
LIABILITES ASSETS
Capital 180 Net Fixed Assets 400
Reserves 20 Inventories 150
Term Loan 300 Cash 50
Bank C/C 200 Receivables 150
Trade Creditors 50 Goodwill 50
Provisions 50
800 800
EXERCISE 1
a. What is the Net Worth : Capital + Reserve = 200
b. Tangible Net Worth is : Net Worth - Goodwill = 150
c. Outside Liabilities : TL + CC + Creditors + Provisions = 600
d. Net Working Capital : C A - C L = 350 - 250 = 50
e. Current Ratio : C A / C L = 350 / 300 = 1.17 : 1
f. Quick Ratio : Quick Assets / C L = 200/300 = 0.66 : 1
31
EXERCISE 2
LIABILITIES 2005-06 2006-07 ASSETS 2005-
06
2006-
07
Capital 300 350 Net Fixed Assets 730 750
Reserves 140 160 Security
Electricity
30 30
Bank Term Loan 320 280 Investments 110 110
Bank CC (Hyp) 490 580 Raw Materials 150 170
Unsec. Long T L 150 170 S I P 20 30
Creditors (RM) 120 70 Finished Goods 140 170
Bills Payable 40 80 Cash 30 20
Expenses Payable 20 30 Receivables 310 240
Provisions 20 40 Loans/Advances 30 190
Goodwill 50 50
Total 1600 1760 1600 1760
1. Tangible Net Worth for 1st Year : ( 300 + 140) - 50 = 390
2. Current Ratio for 2nd Year : (170 + 30 +170+20+ 240 + 190 ) / (580+70+80+70)
820 /800 = 1.02
3. Debt Equity Ratio for 1st Year : 320+150 / 390 = 1.21
32
Exercise 3.
LIABIITIES ASSETS
Equity Capital 200 Net Fixed Assets 800
Preference Capital 100 Inventory 300
Term Loan 600 Receivables 150
Bank CC (Hyp) 400 Investment In Govt.
Secu.
50
Sundry Creditors 100 Preliminary Expenses 100
Total 1400 1400
1. Debt Equity Ratio will be : 600 / (200+100) = 2 : 1
2. Tangible Net Worth : Only equity Capital i.e. = 200
3. Total Outside Liabilities / Total Tangible Net Worth : (600+400+100) / 200
= 11 : 2
4. Current Ratio will be : (300 + 150 + 50 ) / (400 + 100 ) = 1 : 1
33
LIABILITIES ASSETS
Capital + Reserves 355 Net Fixed Assets 265
P & L Credit Balance 7 Cash 1
Loan From S F C 100 Receivables 125
Bank Overdraft 38 Stocks 128
Creditors 26 Prepaid Expenses 1
Provision of Tax 9 Intangible Assets 30
Proposed Dividend 15
550 550
Q. What is the Current Ratio ? Ans : (1+125 +128+1) / (38+26+9+15)
: 255/88 = 2.89 : 1
Q What is the Quick Ratio ? Ans : (125+1)/ 88 = 1.43 : 11
Q. What is the Debt Equity Ratio ? Ans : LTL / Tangible NW
= 100 / ( 362 – 30)
= 100 / 332 = 0.30 : 1
Exercise 4.
34
LIABILITIES ASSETS
Capital + Reserves 355 Net Fixed Assets 265
P & L Credit Balance 7 Cash 1
Loan From S F C 100 Receivables 125
Bank Overdraft 38 Stocks 128
Creditors 26 Prepaid Expenses 1
Provision of Tax 9 Intangible Assets 30
Proposed Dividend 15
550 550
Q. What is the Debtors Velocity Ratio ? If the sales are Rs. 15 Lac.
Ans : ( Average Debtors / Net Sales) x 12 = (125 / 1500) x 12
= 1 month
Q. What is the Creditors Velocity Ratio if Purchases are Rs.10.5 Lac ?
Ans : (Average Creditors / Purchases ) x 12 = (26 / 1050) x 12 = 0.3 months
Exercise 4. contd…
35
Exercise 5. : Profit to sales is 2% and amount of profit is say
Rs.5 Lac. Then What is the amount of Sales ?
Answer : Net Profit Ratio = (Net Profit / Sales ) x 100
2 = (5 x100) /Sales
Therefore Sales = 500/2 = Rs.250 Lac
Exercise 6. A Company has Net Worth of Rs.5 Lac, Term
Liabilities of Rs.10 Lac. Fixed Assets worth RS.16 Lac and
Current Assets are Rs.25 Lac. There is no intangible Assets
or other Non Current Assets. Calculate its Net Working
Capital.
Answer
Total Assets = 16 + 25 = Rs. 41 Lac
Total Liabilities = NW + LTL + CL = 5 + 10+ CL = 41 Lac
Current Liabilities = 41 – 15 = 26 Lac
Therefore Net Working Capital = C. A – C.L
= 25 – 26 = (- )1 Lac
36
Exercise 7 : Current Ratio of a concern is 1 : 1. What will be the Net
Working Capital ?
Answer : It suggest that the Current Assets is equal to Current Liabilities
hence the NWC would be NIL ( since NWC = C.A - C.L )
Exercise 8 : Suppose Current Ratio is 4 : 1. NWC is Rs.30,000/-. What
is the amount of Current Assets ?
Answer : 4a - 1a = 30,000
Therefore a = 10,000 i.e. Current Liabilities is Rs.10,000
Hence Current Assets would be 4a = 4 x 10,000 = Rs.40,000/-
Exercise 9. The amount of Term Loan installment is Rs.10000/ per
month, monthly average interest on TL is Rs.5000/-. If the amount
of Depreciation is Rs.30,000/- p.a. and PAT is Rs.2,70,000/-. What
would be the DSCR ?
DSCR = (PAT + Depr + Annual Intt.) / Annual Intt + Annual Installment
= (270000 + 30000 + 60000 ) / 60000 + 120000
= 360000 / 180000 = 2
37
Exercise 10 : Total Liabilities of a firm is Rs.100 Lac and Current Ratio
is 1.5 : 1. If Fixed Assets and Other Non Current Assets are to the tune
of Rs. 70 Lac and Debt Equity Ratio being 3 : 1. What would be the Long
Term Liabilities?
Ans : We can easily arrive at the amount of Current Asset being Rs. 30 Lac
i.e. ( Rs. 100 L - Rs. 70 L ). If the Current Ratio is 1.5 : 1, then Current
Liabilities works out to be Rs. 20 Lac. That means the aggregate of Net
Worth and Long Term Liabilities would be Rs. 80 Lacs. If the Debt Equity
Ratio is 3 : 1 then Debt works out to be Rs. 60 Lacs and equity Rs. 20 Lacs.
Therefore the Long Term Liabilities would be Rs.60 Lac.
Exercise 11 : Current Ratio is say 1.2 : 1 . Total of balance sheet being
Rs.22 Lac. The amount of Fixed Assets + Non Current Assets is Rs. 10
Lac. What would be the Current Liabilities?
Ans : When Total Assets is Rs.22 Lac then Current Assets would be 22 – 10
i.e Rs. 12 Lac. Thus we can easily arrive at the Current Liabilities figure
which should be Rs. 10 Lac
38
Exercise 12. From the following financial statement calculate (i) Current Ratio (ii)
Acid test Ratio (iii) Inventory Turnover (iv) Average Debt Collection Period (v)
Average Creditors’ payment period.
C.Assets
Sales 1500 Inventories 125
Cost of sales 1000 Debtors 250
Gross profit 500 Cash 225
C. Liabilities
Trade Creditors
200
(i) Current Ratio : 600/200 = 3 : 1
(ii)Acid Test Ratio : Debtors+Cash /Trade creditors = 475/200 = 2.4 : 1
(iii) Inventory Turnover Ratio : Cost of sales / Inventories = 1000/125 = 8 times
(iv) Average Debt collection period : (Debtors/sales) x 365 = (250/1500)x365 = 61
days
(v)Average Creditors’ payment period : (Trade Creditors/Cost of sales) x 365
(200/100) x 365 = 73 days
39
Summary of Financial Ratios
• Ratios help to:
– Evaluate performance
– Structure analysis
– Show the connection between
activities and performance
• Benchmark with
– Past for the company
– Industry
• Ratios adjust for size differences
40
Limitations of Ratio Analysis
• A firm’s industry category is often
difficult to identify
• Published industry averages are only
guidelines
• Accounting practices differ across
firms
• Sometimes difficult to interpret
deviations in ratios
• Industry ratios may not be desirable
targets
• Seasonality affects ratios
41
Thank You !!!
Damodar Shrestha
shresthadamodar@gmail.com
www.twitter.com/Damodarstha
www.facebook.com/shresthadamdar/
www.linkedin.com/in/damodar-shrestha-334a979b/
42

More Related Content

What's hot

Type of auditing
Type of auditingType of auditing
Type of auditingDharmik
 
Chapter 2 analysis of financial statements
Chapter 2 analysis of financial statementsChapter 2 analysis of financial statements
Chapter 2 analysis of financial statementsSamsonJohn14
 
Strategic Financial Management- Investment Appraisal_RCF,PP,DPP,TVM,ARR
Strategic Financial Management- Investment Appraisal_RCF,PP,DPP,TVM,ARRStrategic Financial Management- Investment Appraisal_RCF,PP,DPP,TVM,ARR
Strategic Financial Management- Investment Appraisal_RCF,PP,DPP,TVM,ARRDayana Mastura FCCA CA
 
FFA- Statement of Schedule of Changes in Working Capital
FFA- Statement of Schedule of Changes in Working CapitalFFA- Statement of Schedule of Changes in Working Capital
FFA- Statement of Schedule of Changes in Working Capitaluma reur
 
Basic Financial Management for Small Businesses
Basic Financial Management for Small BusinessesBasic Financial Management for Small Businesses
Basic Financial Management for Small BusinessesBizcentralUSA
 
Chapter 3 working capital management 3
Chapter 3 working capital management 3Chapter 3 working capital management 3
Chapter 3 working capital management 3SamsonJohn14
 
You're going to need a bigger boat
You're going to need a bigger boatYou're going to need a bigger boat
You're going to need a bigger boatMatthew Bardsley
 
A Practical Approach to Financial Statement Analysis
A Practical Approach to Financial Statement AnalysisA Practical Approach to Financial Statement Analysis
A Practical Approach to Financial Statement AnalysisCredit Management Association
 
financial accounting and auditing
financial accounting and auditingfinancial accounting and auditing
financial accounting and auditingAnant Agarwal
 
Finance Fundamentals
Finance FundamentalsFinance Fundamentals
Finance FundamentalsRWolfCPA
 
Chapter 4.Financial Statement Analysis
Chapter 4.Financial Statement AnalysisChapter 4.Financial Statement Analysis
Chapter 4.Financial Statement AnalysisZahraMirzayeva
 
Introduction To Financial Statements And Audit
Introduction To Financial Statements And AuditIntroduction To Financial Statements And Audit
Introduction To Financial Statements And AuditMobasher Ali
 
Financial analysis ppt
Financial analysis pptFinancial analysis ppt
Financial analysis pptdtouhey
 

What's hot (19)

Type of auditing
Type of auditingType of auditing
Type of auditing
 
Materiality level ICAB
Materiality level ICABMateriality level ICAB
Materiality level ICAB
 
Chapter 2 analysis of financial statements
Chapter 2 analysis of financial statementsChapter 2 analysis of financial statements
Chapter 2 analysis of financial statements
 
Income statement
Income statementIncome statement
Income statement
 
Strategic Financial Management- Investment Appraisal_RCF,PP,DPP,TVM,ARR
Strategic Financial Management- Investment Appraisal_RCF,PP,DPP,TVM,ARRStrategic Financial Management- Investment Appraisal_RCF,PP,DPP,TVM,ARR
Strategic Financial Management- Investment Appraisal_RCF,PP,DPP,TVM,ARR
 
FFA- Statement of Schedule of Changes in Working Capital
FFA- Statement of Schedule of Changes in Working CapitalFFA- Statement of Schedule of Changes in Working Capital
FFA- Statement of Schedule of Changes in Working Capital
 
Chapter 1 - Overview of Financial Statement Analysis
Chapter 1 - Overview of Financial Statement AnalysisChapter 1 - Overview of Financial Statement Analysis
Chapter 1 - Overview of Financial Statement Analysis
 
Basic Financial Management for Small Businesses
Basic Financial Management for Small BusinessesBasic Financial Management for Small Businesses
Basic Financial Management for Small Businesses
 
Chapter 3 working capital management 3
Chapter 3 working capital management 3Chapter 3 working capital management 3
Chapter 3 working capital management 3
 
You're going to need a bigger boat
You're going to need a bigger boatYou're going to need a bigger boat
You're going to need a bigger boat
 
A Practical Approach to Financial Statement Analysis
A Practical Approach to Financial Statement AnalysisA Practical Approach to Financial Statement Analysis
A Practical Approach to Financial Statement Analysis
 
4058075 kamus-akuntansi
4058075 kamus-akuntansi4058075 kamus-akuntansi
4058075 kamus-akuntansi
 
financial accounting and auditing
financial accounting and auditingfinancial accounting and auditing
financial accounting and auditing
 
Finance Fundamentals
Finance FundamentalsFinance Fundamentals
Finance Fundamentals
 
Ratio analysis
Ratio analysisRatio analysis
Ratio analysis
 
Chapter 4.Financial Statement Analysis
Chapter 4.Financial Statement AnalysisChapter 4.Financial Statement Analysis
Chapter 4.Financial Statement Analysis
 
Introduction To Financial Statements And Audit
Introduction To Financial Statements And AuditIntroduction To Financial Statements And Audit
Introduction To Financial Statements And Audit
 
Financial analysis ppt
Financial analysis pptFinancial analysis ppt
Financial analysis ppt
 
Ch 01
Ch 01Ch 01
Ch 01
 

Similar to Financial Statement Analysis

jonad presentation by Jephthah Baidoo
jonad presentation by Jephthah Baidoojonad presentation by Jephthah Baidoo
jonad presentation by Jephthah BaidooJephthah Baidoo
 
Ratios and financial statement analysis
Ratios and financial statement analysis Ratios and financial statement analysis
Ratios and financial statement analysis Muhammed hamed albuissa
 
2. financial statement analysis
2. financial statement analysis2. financial statement analysis
2. financial statement analysisJudy Ricamara
 
IISWBM_ratiosandfinancialstatementanalysis_2023.pptx
IISWBM_ratiosandfinancialstatementanalysis_2023.pptxIISWBM_ratiosandfinancialstatementanalysis_2023.pptx
IISWBM_ratiosandfinancialstatementanalysis_2023.pptxNandanSingh93
 
fi2-finfffrrrrrrrrrrrrrrrrrrrrrrrrrrrrrrrrranal.ppt
fi2-finfffrrrrrrrrrrrrrrrrrrrrrrrrrrrrrrrrranal.pptfi2-finfffrrrrrrrrrrrrrrrrrrrrrrrrrrrrrrrrranal.ppt
fi2-finfffrrrrrrrrrrrrrrrrrrrrrrrrrrrrrrrrranal.pptNeelisettySatyaSai1
 
Ratio Analysis (Siescoms)
Ratio Analysis (Siescoms)Ratio Analysis (Siescoms)
Ratio Analysis (Siescoms)Sanjay Gupta
 
Ratio analysis
Ratio analysisRatio analysis
Ratio analysismhoque71
 
Ratio Analysis F F M
Ratio  Analysis   F F MRatio  Analysis   F F M
Ratio Analysis F F MZoha Qureshi
 
Financial statement analysis
Financial statement analysisFinancial statement analysis
Financial statement analysisAnuj Bhatia
 
3. Financial Statement Analysis Interpretation- AC570 AMcM.pptx
3. Financial Statement Analysis  Interpretation- AC570 AMcM.pptx3. Financial Statement Analysis  Interpretation- AC570 AMcM.pptx
3. Financial Statement Analysis Interpretation- AC570 AMcM.pptxsawantac2
 
Topic 2 2_ (2) finance
Topic 2 2_ (2) financeTopic 2 2_ (2) finance
Topic 2 2_ (2) financeFiqa Alya
 
Strategic Management Ch02
Strategic Management Ch02Strategic Management Ch02
Strategic Management Ch02Chuong Nguyen
 
Financial statements, taxes, and cash flow
Financial statements, taxes, and cash flowFinancial statements, taxes, and cash flow
Financial statements, taxes, and cash flowDr. Abdul Adamu
 
Financial statement analysis.pptx
Financial statement analysis.pptxFinancial statement analysis.pptx
Financial statement analysis.pptxziarehman95
 
RR - Technicals 2.pdf
RR - Technicals 2.pdfRR - Technicals 2.pdf
RR - Technicals 2.pdfmerag76668
 
Solvency And Asset Recommendations 2011
Solvency And Asset Recommendations 2011Solvency And Asset Recommendations 2011
Solvency And Asset Recommendations 2011mrittmayer
 

Similar to Financial Statement Analysis (20)

jonad presentation by Jephthah Baidoo
jonad presentation by Jephthah Baidoojonad presentation by Jephthah Baidoo
jonad presentation by Jephthah Baidoo
 
Ratios and financial statement analysis
Ratios and financial statement analysis Ratios and financial statement analysis
Ratios and financial statement analysis
 
2. financial statement analysis
2. financial statement analysis2. financial statement analysis
2. financial statement analysis
 
Financial Statements
Financial StatementsFinancial Statements
Financial Statements
 
IISWBM_ratiosandfinancialstatementanalysis_2023.pptx
IISWBM_ratiosandfinancialstatementanalysis_2023.pptxIISWBM_ratiosandfinancialstatementanalysis_2023.pptx
IISWBM_ratiosandfinancialstatementanalysis_2023.pptx
 
fi2-finfffrrrrrrrrrrrrrrrrrrrrrrrrrrrrrrrrranal.ppt
fi2-finfffrrrrrrrrrrrrrrrrrrrrrrrrrrrrrrrrranal.pptfi2-finfffrrrrrrrrrrrrrrrrrrrrrrrrrrrrrrrrranal.ppt
fi2-finfffrrrrrrrrrrrrrrrrrrrrrrrrrrrrrrrrranal.ppt
 
C7
C7C7
C7
 
Ratio Analysis (Siescoms)
Ratio Analysis (Siescoms)Ratio Analysis (Siescoms)
Ratio Analysis (Siescoms)
 
Ratio analysis
Ratio analysisRatio analysis
Ratio analysis
 
Management accounting
Management accountingManagement accounting
Management accounting
 
Ratio analysis
Ratio analysisRatio analysis
Ratio analysis
 
Ratio Analysis F F M
Ratio  Analysis   F F MRatio  Analysis   F F M
Ratio Analysis F F M
 
Financial statement analysis
Financial statement analysisFinancial statement analysis
Financial statement analysis
 
3. Financial Statement Analysis Interpretation- AC570 AMcM.pptx
3. Financial Statement Analysis  Interpretation- AC570 AMcM.pptx3. Financial Statement Analysis  Interpretation- AC570 AMcM.pptx
3. Financial Statement Analysis Interpretation- AC570 AMcM.pptx
 
Topic 2 2_ (2) finance
Topic 2 2_ (2) financeTopic 2 2_ (2) finance
Topic 2 2_ (2) finance
 
Strategic Management Ch02
Strategic Management Ch02Strategic Management Ch02
Strategic Management Ch02
 
Financial statements, taxes, and cash flow
Financial statements, taxes, and cash flowFinancial statements, taxes, and cash flow
Financial statements, taxes, and cash flow
 
Financial statement analysis.pptx
Financial statement analysis.pptxFinancial statement analysis.pptx
Financial statement analysis.pptx
 
RR - Technicals 2.pdf
RR - Technicals 2.pdfRR - Technicals 2.pdf
RR - Technicals 2.pdf
 
Solvency And Asset Recommendations 2011
Solvency And Asset Recommendations 2011Solvency And Asset Recommendations 2011
Solvency And Asset Recommendations 2011
 

Recently uploaded

CARE OF CHILD IN INCUBATOR..........pptx
CARE OF CHILD IN INCUBATOR..........pptxCARE OF CHILD IN INCUBATOR..........pptx
CARE OF CHILD IN INCUBATOR..........pptxGaneshChakor2
 
_Math 4-Q4 Week 5.pptx Steps in Collecting Data
_Math 4-Q4 Week 5.pptx Steps in Collecting Data_Math 4-Q4 Week 5.pptx Steps in Collecting Data
_Math 4-Q4 Week 5.pptx Steps in Collecting DataJhengPantaleon
 
SOCIAL AND HISTORICAL CONTEXT - LFTVD.pptx
SOCIAL AND HISTORICAL CONTEXT - LFTVD.pptxSOCIAL AND HISTORICAL CONTEXT - LFTVD.pptx
SOCIAL AND HISTORICAL CONTEXT - LFTVD.pptxiammrhaywood
 
Employee wellbeing at the workplace.pptx
Employee wellbeing at the workplace.pptxEmployee wellbeing at the workplace.pptx
Employee wellbeing at the workplace.pptxNirmalaLoungPoorunde1
 
Enzyme, Pharmaceutical Aids, Miscellaneous Last Part of Chapter no 5th.pdf
Enzyme, Pharmaceutical Aids, Miscellaneous Last Part of Chapter no 5th.pdfEnzyme, Pharmaceutical Aids, Miscellaneous Last Part of Chapter no 5th.pdf
Enzyme, Pharmaceutical Aids, Miscellaneous Last Part of Chapter no 5th.pdfSumit Tiwari
 
Alper Gobel In Media Res Media Component
Alper Gobel In Media Res Media ComponentAlper Gobel In Media Res Media Component
Alper Gobel In Media Res Media ComponentInMediaRes1
 
URLs and Routing in the Odoo 17 Website App
URLs and Routing in the Odoo 17 Website AppURLs and Routing in the Odoo 17 Website App
URLs and Routing in the Odoo 17 Website AppCeline George
 
Paris 2024 Olympic Geographies - an activity
Paris 2024 Olympic Geographies - an activityParis 2024 Olympic Geographies - an activity
Paris 2024 Olympic Geographies - an activityGeoBlogs
 
“Oh GOSH! Reflecting on Hackteria's Collaborative Practices in a Global Do-It...
“Oh GOSH! Reflecting on Hackteria's Collaborative Practices in a Global Do-It...“Oh GOSH! Reflecting on Hackteria's Collaborative Practices in a Global Do-It...
“Oh GOSH! Reflecting on Hackteria's Collaborative Practices in a Global Do-It...Marc Dusseiller Dusjagr
 
Call Girls in Dwarka Mor Delhi Contact Us 9654467111
Call Girls in Dwarka Mor Delhi Contact Us 9654467111Call Girls in Dwarka Mor Delhi Contact Us 9654467111
Call Girls in Dwarka Mor Delhi Contact Us 9654467111Sapana Sha
 
microwave assisted reaction. General introduction
microwave assisted reaction. General introductionmicrowave assisted reaction. General introduction
microwave assisted reaction. General introductionMaksud Ahmed
 
Hybridoma Technology ( Production , Purification , and Application )
Hybridoma Technology  ( Production , Purification , and Application  ) Hybridoma Technology  ( Production , Purification , and Application  )
Hybridoma Technology ( Production , Purification , and Application ) Sakshi Ghasle
 
Class 11 Legal Studies Ch-1 Concept of State .pdf
Class 11 Legal Studies Ch-1 Concept of State .pdfClass 11 Legal Studies Ch-1 Concept of State .pdf
Class 11 Legal Studies Ch-1 Concept of State .pdfakmcokerachita
 
BASLIQ CURRENT LOOKBOOK LOOKBOOK(1) (1).pdf
BASLIQ CURRENT LOOKBOOK  LOOKBOOK(1) (1).pdfBASLIQ CURRENT LOOKBOOK  LOOKBOOK(1) (1).pdf
BASLIQ CURRENT LOOKBOOK LOOKBOOK(1) (1).pdfSoniaTolstoy
 
How to Configure Email Server in Odoo 17
How to Configure Email Server in Odoo 17How to Configure Email Server in Odoo 17
How to Configure Email Server in Odoo 17Celine George
 
Introduction to ArtificiaI Intelligence in Higher Education
Introduction to ArtificiaI Intelligence in Higher EducationIntroduction to ArtificiaI Intelligence in Higher Education
Introduction to ArtificiaI Intelligence in Higher Educationpboyjonauth
 
Science 7 - LAND and SEA BREEZE and its Characteristics
Science 7 - LAND and SEA BREEZE and its CharacteristicsScience 7 - LAND and SEA BREEZE and its Characteristics
Science 7 - LAND and SEA BREEZE and its CharacteristicsKarinaGenton
 
Separation of Lanthanides/ Lanthanides and Actinides
Separation of Lanthanides/ Lanthanides and ActinidesSeparation of Lanthanides/ Lanthanides and Actinides
Separation of Lanthanides/ Lanthanides and ActinidesFatimaKhan178732
 
Interactive Powerpoint_How to Master effective communication
Interactive Powerpoint_How to Master effective communicationInteractive Powerpoint_How to Master effective communication
Interactive Powerpoint_How to Master effective communicationnomboosow
 

Recently uploaded (20)

CARE OF CHILD IN INCUBATOR..........pptx
CARE OF CHILD IN INCUBATOR..........pptxCARE OF CHILD IN INCUBATOR..........pptx
CARE OF CHILD IN INCUBATOR..........pptx
 
_Math 4-Q4 Week 5.pptx Steps in Collecting Data
_Math 4-Q4 Week 5.pptx Steps in Collecting Data_Math 4-Q4 Week 5.pptx Steps in Collecting Data
_Math 4-Q4 Week 5.pptx Steps in Collecting Data
 
SOCIAL AND HISTORICAL CONTEXT - LFTVD.pptx
SOCIAL AND HISTORICAL CONTEXT - LFTVD.pptxSOCIAL AND HISTORICAL CONTEXT - LFTVD.pptx
SOCIAL AND HISTORICAL CONTEXT - LFTVD.pptx
 
Employee wellbeing at the workplace.pptx
Employee wellbeing at the workplace.pptxEmployee wellbeing at the workplace.pptx
Employee wellbeing at the workplace.pptx
 
Enzyme, Pharmaceutical Aids, Miscellaneous Last Part of Chapter no 5th.pdf
Enzyme, Pharmaceutical Aids, Miscellaneous Last Part of Chapter no 5th.pdfEnzyme, Pharmaceutical Aids, Miscellaneous Last Part of Chapter no 5th.pdf
Enzyme, Pharmaceutical Aids, Miscellaneous Last Part of Chapter no 5th.pdf
 
Alper Gobel In Media Res Media Component
Alper Gobel In Media Res Media ComponentAlper Gobel In Media Res Media Component
Alper Gobel In Media Res Media Component
 
URLs and Routing in the Odoo 17 Website App
URLs and Routing in the Odoo 17 Website AppURLs and Routing in the Odoo 17 Website App
URLs and Routing in the Odoo 17 Website App
 
9953330565 Low Rate Call Girls In Rohini Delhi NCR
9953330565 Low Rate Call Girls In Rohini  Delhi NCR9953330565 Low Rate Call Girls In Rohini  Delhi NCR
9953330565 Low Rate Call Girls In Rohini Delhi NCR
 
Paris 2024 Olympic Geographies - an activity
Paris 2024 Olympic Geographies - an activityParis 2024 Olympic Geographies - an activity
Paris 2024 Olympic Geographies - an activity
 
“Oh GOSH! Reflecting on Hackteria's Collaborative Practices in a Global Do-It...
“Oh GOSH! Reflecting on Hackteria's Collaborative Practices in a Global Do-It...“Oh GOSH! Reflecting on Hackteria's Collaborative Practices in a Global Do-It...
“Oh GOSH! Reflecting on Hackteria's Collaborative Practices in a Global Do-It...
 
Call Girls in Dwarka Mor Delhi Contact Us 9654467111
Call Girls in Dwarka Mor Delhi Contact Us 9654467111Call Girls in Dwarka Mor Delhi Contact Us 9654467111
Call Girls in Dwarka Mor Delhi Contact Us 9654467111
 
microwave assisted reaction. General introduction
microwave assisted reaction. General introductionmicrowave assisted reaction. General introduction
microwave assisted reaction. General introduction
 
Hybridoma Technology ( Production , Purification , and Application )
Hybridoma Technology  ( Production , Purification , and Application  ) Hybridoma Technology  ( Production , Purification , and Application  )
Hybridoma Technology ( Production , Purification , and Application )
 
Class 11 Legal Studies Ch-1 Concept of State .pdf
Class 11 Legal Studies Ch-1 Concept of State .pdfClass 11 Legal Studies Ch-1 Concept of State .pdf
Class 11 Legal Studies Ch-1 Concept of State .pdf
 
BASLIQ CURRENT LOOKBOOK LOOKBOOK(1) (1).pdf
BASLIQ CURRENT LOOKBOOK  LOOKBOOK(1) (1).pdfBASLIQ CURRENT LOOKBOOK  LOOKBOOK(1) (1).pdf
BASLIQ CURRENT LOOKBOOK LOOKBOOK(1) (1).pdf
 
How to Configure Email Server in Odoo 17
How to Configure Email Server in Odoo 17How to Configure Email Server in Odoo 17
How to Configure Email Server in Odoo 17
 
Introduction to ArtificiaI Intelligence in Higher Education
Introduction to ArtificiaI Intelligence in Higher EducationIntroduction to ArtificiaI Intelligence in Higher Education
Introduction to ArtificiaI Intelligence in Higher Education
 
Science 7 - LAND and SEA BREEZE and its Characteristics
Science 7 - LAND and SEA BREEZE and its CharacteristicsScience 7 - LAND and SEA BREEZE and its Characteristics
Science 7 - LAND and SEA BREEZE and its Characteristics
 
Separation of Lanthanides/ Lanthanides and Actinides
Separation of Lanthanides/ Lanthanides and ActinidesSeparation of Lanthanides/ Lanthanides and Actinides
Separation of Lanthanides/ Lanthanides and Actinides
 
Interactive Powerpoint_How to Master effective communication
Interactive Powerpoint_How to Master effective communicationInteractive Powerpoint_How to Master effective communication
Interactive Powerpoint_How to Master effective communication
 

Financial Statement Analysis

  • 1. Financial Statement Analysis and Interpretation 1 Key to Quality Lending Damodar Shrestha
  • 2. OUTLINE • Overview of FS analysis and interpretation • Types of FS and its usages • FS as per credit exposure • FS analysis as per lender needs 2
  • 3. Financial Statement & Ratio Analysis 3
  • 4. Financial Analysis • Assessment of the firm’s past, present and future financial conditions • Done to find firm’s financial strengths and weaknesses • Primary Tools: – Financial Statements – Comparison of financial ratios to past, industry, sector and all firms 4
  • 5. Financial Statements •Balance Sheet •Income Statement •Cashflow Statement •Statement of Retained Earnings 5
  • 6. 6
  • 7. 7
  • 8. Objectives of Ratio Analysis • Standardize financial information for comparisons • Evaluate current operations • Compare performance with past performance • Compare performance against other firms or industry standards • Study the efficiency of operations • Study the risk of operations 8
  • 10. Ratio Analysis 1. Liquidity – the ability of the firm to pay its way 2. Investment/shareholders – information to enable decisions to be made on the extent of the risk and the earning potential of a business investment 3. Gearing – information on the relationship between the exposure of the business to loans as opposed to share capital 4. Profitability – how effective the firm is at generating profits given sales and or its capital assets 5. Financial – the rate at which the company sells its stock and the efficiency with which it uses its assets 10
  • 12. Acid Test • Also referred to as the ‘Quick ratio’ • (Current assets – stock) : liabilities • 1:1 seen as ideal • The omission of stock gives an indication of the cash the firm has in relation to its liabilities (what it owes) • A ratio of 3:1 therefore would suggest the firm has 3 times as much cash as it owes – very healthy! • A ratio of 0.5:1 would suggest the firm has twice as many liabilities as it has cash to pay for those liabilities. This might put the firm under pressure but is not in itself the end of the world! 12
  • 13. Current Ratio • Looks at the ratio between Current Assets and Current Liabilities • Current Ratio = Current Assets : Current Liabilities • Ideal level? – 1.5 : 1 • A ratio of 5 : 1 would imply the firm has £5 of assets to cover every £1 in liabilities • A ratio of 0.75 : 1 would suggest the firm has only 75p in assets available to cover every £1 it owes • Too high – Might suggest that too much of its assets are tied up in unproductive activities – too much stock, for example? • Too low - risk of not being able to pay your way 13
  • 15. Investment/Shareholders • Earnings per share – profit after tax / number of shares • Price earnings ratio – market price / earnings per share – the higher the better generally for company. Comparison with other firms helps to identify value placed on the market of the business. • EV / EBITDA Ratio - Enterprise Value / EBITDA ratio - the higher the better generally for company . It measures the operational performance of the firm. • Dividend yield – ordinary share dividend / market price x 100 – higher the better. Relates the return on the investment to the share price. 15
  • 17. Gearing • Gearing Ratio = Long term loans / Capital employed x 100 • The higher the ratio the more the business is exposed to interest rate fluctuations and to having to pay back interest and loans before being able to re-invest earnings 17
  • 19. Profitability • Profitability measures look at how much profit the firm generates from sales or from its capital assets • Different measures of profit – gross and net – Gross profit – effectively total revenue (turnover) – variable costs (cost of sales) – Net Profit – effectively total revenue (turnover) – variable costs and fixed costs (overheads) 19
  • 20. Profitability • Gross Profit Margin = Gross profit / turnover x 100 • The higher the better • Enables the firm to assess the impact of its sales and how much it cost to generate (produce) those sales • A gross profit margin of 45% means that for every £1 of sales, the firm makes 45p in gross profit 20
  • 21. Profitability • Net Profit Margin = Net Profit / Turnover x 100 • Net profit takes into account the fixed costs involved in production – the overheads • Keeping control over fixed costs is important – could be easy to overlook for example the amount of waste - paper, stationery, lighting, heating, water, etc. – e.g. – leaving a photocopier on overnight uses enough electricity to make 5,300 A4 copies. (1,934,500 per year) – 1 ream = 500 copies. 1 ream = £5.00 (on average) – Total cost therefore = £19,345 per year – or 1 person’s salary 21
  • 22. Profitability • Return on Capital Employed (ROCE) = Profit / capital employed x 100 22
  • 23. Profitability • The higher the better • Shows how effective the firm is in using its capital to generate profit • A ROCE of 25% means that it uses every £1 of capital to generate 25p in profit • Partly a measure of efficiency in organisation and use of capital 23
  • 25. Asset Turnover • Asset Turnover = Sales turnover / assets employed • Using assets to generate profit • Asset turnover x net profit margin = ROCE 25
  • 26. Stock Turnover • Stock turnover = Cost of goods sold / stock expressed as times per year • The rate at which a company’s stock is turned over • A high stock turnover might mean increased efficiency? – But: dependent on the type of business – supermarkets might have high stock turnover ratios whereas a shop selling high value musical instruments might have low stock turnover ratio – Low stock turnover could mean poor customer satisfaction if people are not buying the goods (Marks and Spencer?) 26
  • 27. Debtor Days • Debtor Days = Debtors / sales turnover x 365 • Shorter the better • Gives a measure of how long it takes the business to recover debts • Can be skewed by the degree of credit facility a firm offers 27
  • 28. Before looking at the ratios there are a number of cautionary points concerning their use that need to be identified : a. The dates and duration of the financial statements being compared should be the same. If not, the effects of seasonality may cause erroneous conclusions to be drawn. b. The accounts to be compared should have been prepared on the same bases. Different treatment of stocks or depreciations or asset valuations will distort the results. c. In order to judge the overall performance of the firm a group of ratios, as opposed to just one or two should be used. In order to identify trends at least three years of ratios are normally required. 28
  • 29. SOME IMPORTANT NOTES • Liabilities have Credit balance and Assets have Debit balance • Current Liabilities are those which have either become due for payment or shall fall due for payment within 12 months from the date of Balance Sheet • Current Assets are those which undergo change in their shape/form within 12 months. These are also called Working Capital or Gross Working Capital • Net Worth & Long Term Liabilities are also called Long Term Sources of Funds • Current Liabilities are known as Short Term Sources of Funds • Long Term Liabilities & Short Term Liabilities are also called Outside Liabilities • Current Assets are Short Term Use of Funds 29
  • 30. SOME IMPORTANT NOTES • Assets other than Current Assets are Long Term Use of Funds • Installments of Term Loan Payable in 12 months are to be taken as Current Liability only for Calculation of Current Ratio & Quick Ratio. • If there is profit it shall become part of Net Worth under the head Reserves and if there is loss it will become part of Intangible Assets • Investments in Govt. Securities to be treated current only if these are marketable and due. Investments in other securities are to be treated Current if they are quoted. Investments in allied/associate/sister units or firms to be treated as Non- current. • Bonus Shares as issued by capitalization of General reserves and as such do not affect the Net Worth. With Rights Issue, change takes place in Net Worth and Current Ratio. 30
  • 31. LIABILITES ASSETS Capital 180 Net Fixed Assets 400 Reserves 20 Inventories 150 Term Loan 300 Cash 50 Bank C/C 200 Receivables 150 Trade Creditors 50 Goodwill 50 Provisions 50 800 800 EXERCISE 1 a. What is the Net Worth : Capital + Reserve = 200 b. Tangible Net Worth is : Net Worth - Goodwill = 150 c. Outside Liabilities : TL + CC + Creditors + Provisions = 600 d. Net Working Capital : C A - C L = 350 - 250 = 50 e. Current Ratio : C A / C L = 350 / 300 = 1.17 : 1 f. Quick Ratio : Quick Assets / C L = 200/300 = 0.66 : 1 31
  • 32. EXERCISE 2 LIABILITIES 2005-06 2006-07 ASSETS 2005- 06 2006- 07 Capital 300 350 Net Fixed Assets 730 750 Reserves 140 160 Security Electricity 30 30 Bank Term Loan 320 280 Investments 110 110 Bank CC (Hyp) 490 580 Raw Materials 150 170 Unsec. Long T L 150 170 S I P 20 30 Creditors (RM) 120 70 Finished Goods 140 170 Bills Payable 40 80 Cash 30 20 Expenses Payable 20 30 Receivables 310 240 Provisions 20 40 Loans/Advances 30 190 Goodwill 50 50 Total 1600 1760 1600 1760 1. Tangible Net Worth for 1st Year : ( 300 + 140) - 50 = 390 2. Current Ratio for 2nd Year : (170 + 30 +170+20+ 240 + 190 ) / (580+70+80+70) 820 /800 = 1.02 3. Debt Equity Ratio for 1st Year : 320+150 / 390 = 1.21 32
  • 33. Exercise 3. LIABIITIES ASSETS Equity Capital 200 Net Fixed Assets 800 Preference Capital 100 Inventory 300 Term Loan 600 Receivables 150 Bank CC (Hyp) 400 Investment In Govt. Secu. 50 Sundry Creditors 100 Preliminary Expenses 100 Total 1400 1400 1. Debt Equity Ratio will be : 600 / (200+100) = 2 : 1 2. Tangible Net Worth : Only equity Capital i.e. = 200 3. Total Outside Liabilities / Total Tangible Net Worth : (600+400+100) / 200 = 11 : 2 4. Current Ratio will be : (300 + 150 + 50 ) / (400 + 100 ) = 1 : 1 33
  • 34. LIABILITIES ASSETS Capital + Reserves 355 Net Fixed Assets 265 P & L Credit Balance 7 Cash 1 Loan From S F C 100 Receivables 125 Bank Overdraft 38 Stocks 128 Creditors 26 Prepaid Expenses 1 Provision of Tax 9 Intangible Assets 30 Proposed Dividend 15 550 550 Q. What is the Current Ratio ? Ans : (1+125 +128+1) / (38+26+9+15) : 255/88 = 2.89 : 1 Q What is the Quick Ratio ? Ans : (125+1)/ 88 = 1.43 : 11 Q. What is the Debt Equity Ratio ? Ans : LTL / Tangible NW = 100 / ( 362 – 30) = 100 / 332 = 0.30 : 1 Exercise 4. 34
  • 35. LIABILITIES ASSETS Capital + Reserves 355 Net Fixed Assets 265 P & L Credit Balance 7 Cash 1 Loan From S F C 100 Receivables 125 Bank Overdraft 38 Stocks 128 Creditors 26 Prepaid Expenses 1 Provision of Tax 9 Intangible Assets 30 Proposed Dividend 15 550 550 Q. What is the Debtors Velocity Ratio ? If the sales are Rs. 15 Lac. Ans : ( Average Debtors / Net Sales) x 12 = (125 / 1500) x 12 = 1 month Q. What is the Creditors Velocity Ratio if Purchases are Rs.10.5 Lac ? Ans : (Average Creditors / Purchases ) x 12 = (26 / 1050) x 12 = 0.3 months Exercise 4. contd… 35
  • 36. Exercise 5. : Profit to sales is 2% and amount of profit is say Rs.5 Lac. Then What is the amount of Sales ? Answer : Net Profit Ratio = (Net Profit / Sales ) x 100 2 = (5 x100) /Sales Therefore Sales = 500/2 = Rs.250 Lac Exercise 6. A Company has Net Worth of Rs.5 Lac, Term Liabilities of Rs.10 Lac. Fixed Assets worth RS.16 Lac and Current Assets are Rs.25 Lac. There is no intangible Assets or other Non Current Assets. Calculate its Net Working Capital. Answer Total Assets = 16 + 25 = Rs. 41 Lac Total Liabilities = NW + LTL + CL = 5 + 10+ CL = 41 Lac Current Liabilities = 41 – 15 = 26 Lac Therefore Net Working Capital = C. A – C.L = 25 – 26 = (- )1 Lac 36
  • 37. Exercise 7 : Current Ratio of a concern is 1 : 1. What will be the Net Working Capital ? Answer : It suggest that the Current Assets is equal to Current Liabilities hence the NWC would be NIL ( since NWC = C.A - C.L ) Exercise 8 : Suppose Current Ratio is 4 : 1. NWC is Rs.30,000/-. What is the amount of Current Assets ? Answer : 4a - 1a = 30,000 Therefore a = 10,000 i.e. Current Liabilities is Rs.10,000 Hence Current Assets would be 4a = 4 x 10,000 = Rs.40,000/- Exercise 9. The amount of Term Loan installment is Rs.10000/ per month, monthly average interest on TL is Rs.5000/-. If the amount of Depreciation is Rs.30,000/- p.a. and PAT is Rs.2,70,000/-. What would be the DSCR ? DSCR = (PAT + Depr + Annual Intt.) / Annual Intt + Annual Installment = (270000 + 30000 + 60000 ) / 60000 + 120000 = 360000 / 180000 = 2 37
  • 38. Exercise 10 : Total Liabilities of a firm is Rs.100 Lac and Current Ratio is 1.5 : 1. If Fixed Assets and Other Non Current Assets are to the tune of Rs. 70 Lac and Debt Equity Ratio being 3 : 1. What would be the Long Term Liabilities? Ans : We can easily arrive at the amount of Current Asset being Rs. 30 Lac i.e. ( Rs. 100 L - Rs. 70 L ). If the Current Ratio is 1.5 : 1, then Current Liabilities works out to be Rs. 20 Lac. That means the aggregate of Net Worth and Long Term Liabilities would be Rs. 80 Lacs. If the Debt Equity Ratio is 3 : 1 then Debt works out to be Rs. 60 Lacs and equity Rs. 20 Lacs. Therefore the Long Term Liabilities would be Rs.60 Lac. Exercise 11 : Current Ratio is say 1.2 : 1 . Total of balance sheet being Rs.22 Lac. The amount of Fixed Assets + Non Current Assets is Rs. 10 Lac. What would be the Current Liabilities? Ans : When Total Assets is Rs.22 Lac then Current Assets would be 22 – 10 i.e Rs. 12 Lac. Thus we can easily arrive at the Current Liabilities figure which should be Rs. 10 Lac 38
  • 39. Exercise 12. From the following financial statement calculate (i) Current Ratio (ii) Acid test Ratio (iii) Inventory Turnover (iv) Average Debt Collection Period (v) Average Creditors’ payment period. C.Assets Sales 1500 Inventories 125 Cost of sales 1000 Debtors 250 Gross profit 500 Cash 225 C. Liabilities Trade Creditors 200 (i) Current Ratio : 600/200 = 3 : 1 (ii)Acid Test Ratio : Debtors+Cash /Trade creditors = 475/200 = 2.4 : 1 (iii) Inventory Turnover Ratio : Cost of sales / Inventories = 1000/125 = 8 times (iv) Average Debt collection period : (Debtors/sales) x 365 = (250/1500)x365 = 61 days (v)Average Creditors’ payment period : (Trade Creditors/Cost of sales) x 365 (200/100) x 365 = 73 days 39
  • 40. Summary of Financial Ratios • Ratios help to: – Evaluate performance – Structure analysis – Show the connection between activities and performance • Benchmark with – Past for the company – Industry • Ratios adjust for size differences 40
  • 41. Limitations of Ratio Analysis • A firm’s industry category is often difficult to identify • Published industry averages are only guidelines • Accounting practices differ across firms • Sometimes difficult to interpret deviations in ratios • Industry ratios may not be desirable targets • Seasonality affects ratios 41
  • 42. Thank You !!! Damodar Shrestha shresthadamodar@gmail.com www.twitter.com/Damodarstha www.facebook.com/shresthadamdar/ www.linkedin.com/in/damodar-shrestha-334a979b/ 42