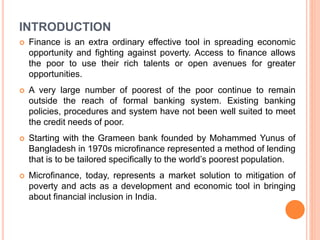
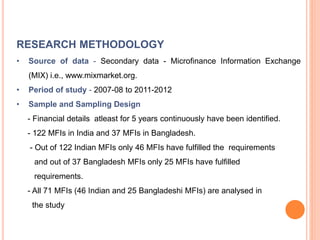
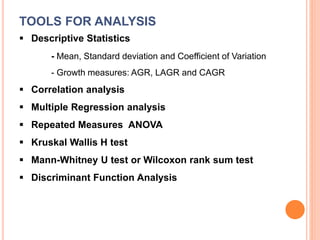
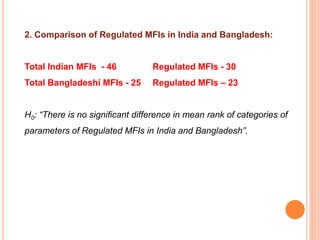
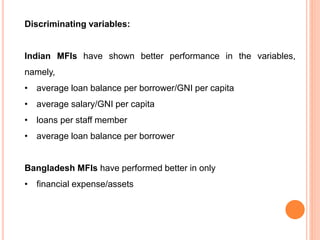
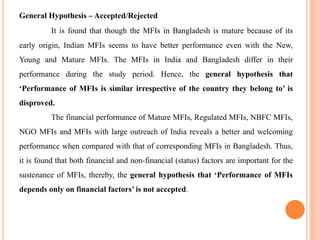
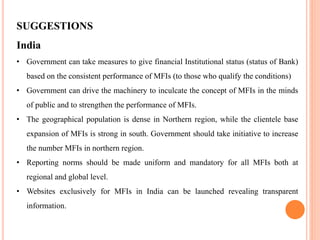
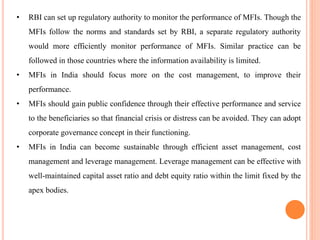
FINANCIAL PERFORMANCE OF
MICROFINANCE INSTITUTIONS –
A COMPARATIVE STUDY OF INDIAAND
BANGLADESH
By
R.RUPA
Supervisor
Dr.PADMAJA MANOHARAN, M.Com., M.Phil., MBA.,
ACS., Ph.D.,
Associate Professor and Head of the Department of Commerce
(Retd)
PSGR Krishnammal College for Women (Autonomous)
Coimbatore
INTRODUCTION
 Finance is an extra ordinary effective tool in spreading economic
opportunity and fighting against poverty. Access to finance allows
the poor to use their rich talents or open avenues for greater
opportunities.
 A very large number of poorest of the poor continue to remain
outside the reach of formal banking system. Existing banking
policies, procedures and system have not been well suited to meet
the credit needs of poor.
 Starting with the Grameen bank founded by Mohammed Yunus of
Bangladesh in 1970s microfinance represented a method of lending
that is to be tailored specifically to the world’s poorest population.
 Microfinance, today, represents a market solution to mitigation of
poverty and acts as a development and economic tool in bringing
about financial inclusion in India.
MICROFINANCE INSTITUTIONS
 Consultative Group to Assist the Poor (CGAP)
defines Microfinance as “a credit methodology that
employs effective collateral substitutes to deliver
and recover short-term working capital loans to
micro entrepreneurs.” The institutions that are
providing these services to poor are called
Microfinance Institutions (MFIs).
 MFIs are commonly known as “Bank for the
poor”.
Working model of MFI
STATEMENT OF THE PROBLEM
India and Bangladesh are two developing economies in the
world and poverty is a common problem in these two countries. It
becomes imperative to formulate specific situational poverty alleviation
policies and programmes for generation of minimum level of income
for rural poor. Microfinance is an option to resolve this problem of poor
people.
Bangladesh has been the birth place of microfinance and also
the pioneer in the world for applying microfinance. The microfinance
industry in India started with informal Self Help Group (SHG) to access
the much – needed savings and credit services in the early 1980’s and
today it has evolved into a vibrant industry exhibiting variety of
business model.
To provide microfinance and other support services MFIs should be
able to sustain for a long period. In order to sustain operations, MFIs must
generate enough revenues from financial services to cover their financial and
operating cost and in many cases, build institutional capital through profit.
There are barely few studies, which have made a comparison on the financial
performance of MFIs between different countries. The financial performance
of MFIs may be compared either with previous years’ performance or with
that of other countries which are pioneer in Microfinance. Bangladesh, being
the pioneer in the microfinance and having demographics similar to India is
the obvious choice for comparison.
The present study is an attempt to fill this research gap by assessing
the current financial performance of MFIs in India (our country) and
Bangladesh (originator) and to make a comparison thereof.
HYPOTHESES
The hypotheses of the study are:
 Performance of MFIs is similar irrespective of the
countries they belong to.
 Age is not an important criterion for sustenance of
MFIs.
 Performance of MFIs depends only on financial
factors.
SCOPE OF THE STUDY
The study is pertaining to MFIs in India and Bangladesh. The
comprehensive financial performance indicators model used by
Microfinance Information Exchange (MIX) has been chosen for the
study. The study covers mainly seven categories of parameters as
prescribed by MIX:
 Institutional characteristics
 Financing structure
 Outreach indicators
 Overall financial performance
 Revenue and expenses
 Efficiency
 Risk and liquidity
Macro economic indicators are not considered for the study.
RESEARCH METHODOLOGY
• Source of data - Secondary data - Microfinance Information Exchange
(MIX) i.e., www.mixmarket.org.
• Period of study - 2007-08 to 2011-2012
• Sample and Sampling Design
- Financial details atleast for 5 years continuously have been identified.
- 122 MFIs in India and 37 MFIs in Bangladesh.
- Out of 122 Indian MFIs only 46 MFIs have fulfilled the requirements
and out of 37 Bangladesh MFIs only 25 MFIs have fulfilled
requirements.
- All 71 MFIs (46 Indian and 25 Bangladeshi MFIs) are analysed in
the study
TOOLS FOR ANALYSIS
 Descriptive Statistics
- Mean, Standard deviation and Coefficient of Variation
- Growth measures: AGR, LAGR and CAGR
 Correlation analysis
 Multiple Regression analysis
 Repeated Measures ANOVA
 Kruskal Wallis H test
 Mann-Whitney U test or Wilcoxon rank sum test
 Discriminant Function Analysis
LIMITATIONS OF THE STUDY
 The limitations inherent in statistical tools apply to this
study also.
 Non availability of continuous data from MIX for more
than five years has restricted the period and number of
MFIs in this study.
CHAPTER SCHEME
The thesis has been presented as given below:
Chapters:
1. Introduction and research design
2. Review of literature
3. Scenario of MFIs in India and Bangladesh
4. Financial performance of MFIs in India
5. Financial performance of MFIs in Bangladesh
6. Comparison of the performance of MFIs of India and
Bangladesh
7. Findings, Suggestions and Conclusion
REVIEW OF LITERATURE – A STUDY OF YESTER YEARS
 Total review – 60
 Indian – 16
 Worldwide including India and Bangladesh - 44
SCENARIO OF MFIS
Microfinance Institutions in South Asian Countries
 South Asia consist of eight countries, namely, Afghanistan,
Bangladesh, Bhutan, India, Maldives, Nepal, Pakistan and Sri
Lanka, which has a large combined population (1.5 bn), second
to East Asia (2 bn).
 The World Bank has called South Asia “Cradle of Microfinance”.
 Almost half of all the people in world who use Microfinance
services are living in South Asia
 Lending in South Asia has been dominated by India.
SCENARIO OF MFIS IN INDIA
Evolution of MFIs:
 The cooperative movement (1900-1960)
 Subsidized social banking (1960s - 1990)
 SHG-Bank linkage program and growth of NGO-MFIs (1990 -
2000)
 Commercialization of Microfinance: The first decade of the new
millennium
Types of MFIs in India:
1. Non-for-profit MFIs
2. Mutual Benefit Companies
3. For-Profit MFIs
SCENARIO OF MFIS IN BANGLADESH
 Bangladesh is one of the world’s ten most populated countries and
more than half of the population lives in agrarian rural villages.
 The microfinance sector in Bangladesh is one of the world’s largest.
Bangladeshi MFIs are best known for their pioneering, large-scale
provision of microfinance services, principally, tiny collateral-free loans
to poor women.
Origin :
1. Action research phase in the 1970s
2. Microcredit development phase in the 1980s
3. Consolidation phase in the 1990s
4. Expansion phase from 2000 onwards
Types of MFIs in Bangladesh:
1. NGO MFIs registered as NGOs 4. Cooperative societies
2. Societies 5. Trusts
3. Not-for-profit Companies
FINANCIAL PERFORMANCE OF MFIs IN
INDIA – An Analysis
 Understanding the financial performance helps to
to improve profitability and sustainability of MFIs.
CATEGORIES OF PARAMETERS AND INDICATORS
1. Institutional characteristics
 Assets
2. Financing structure
 CAR
 DER
 GLP to TA
3. Outreach indicators
 NAB
 ALBPB
 ALBPB/GNI per capita
 AOB
4. Overall financial performance
 ROA
 ROE
 OSS
5. Revenue and expenses
 FR/A
 PM
 YGP(N)
 TE/A
 FE/A
 PLI/A
 OE/A
6. Efficiency
 OE/LP
 AS/GNI per capita
 CPB
 LPSM
 PeAR
7. Risk and liquidity
 PAR> 90 Days
 RC
 NELA as % of TA
• Variable wise analysis - Selected MFIs are individually
analysed variable wise.
• Ranking of MFIs applying numerical scoring (Z scores).
• Multiple regression analysis
Dependent variable - Overall performance score
Independent variable –
Financing structure
Outreach indicators
Overall financial performance indicators
Revenue and expenses
Efficiency
Risk and liquidity
MULTIPLE REGRESSION ANALYSIS - RESULTS
Financing
Structure
Outreach
Indicators
Overall Financial
Performance
R square 0.153 0.378 0.700
F value 13.567 34.208 176.153
Model Significant at 1% Significant at 1% Significant at 1%
Positive influence GLP to TA NAB,
ALBPB
ROE
OSS
Negative influence - ALBPB/GNI per
capita
ROA
Maximum
influence
- ALBPB OSS
Hypothesis Rejected Rejected Rejected
MULTIPLE REGRESSION ANALYSIS – RESULTS
Revenue &
Expenses
Efficiency Risk & Liquidity
R square 0.762 0.533 0.143
F value 101.765 51.162 12.272
Model Significant at 1% Significant at 1% Significant at 1%
Positive influence FR/A, PM, TE/A,
PLI/A, OE/A
AS/GNI per capita,
CPB, LPSM, PeAR
PAR>90 Days,
RC
Negative
influence
YGP(N)
-
-
Maximum
influence
FR/A
CPB
PAR>90 Days
Hypothesis Rejected
Rejected
Rejected
FINANCIAL PERFORMANCE OF MFIs IN
BANGLADESH – An Analysis
The trend and growth of MFIs in Bangladesh in
respect of variables has been analysed.
Correlation analysis
Variable wise analysis
Ranking of MFIs applying numerical scoring (Z
scores).
Multiple regression analysis
MULTIPLE REGRESSION ANALYSIS - RESULTS
Financing
Structure
Outreach
Indicators
Overall Financial
Performance
R square 0.193 0.393 0.766
F value 9.642 19.444 132.143
Model Significant at 1% Significant at 1% Significant at 1%
Positive influence DER,
GLP to TA
NAB ROA,
OSS
Negative influence - - ROE
Maximum
influence
DER - OSS
Hypothesis Rejected Rejected Rejected
MULTIPLE REGRESSION ANALYSIS - RESULTS
Revenue &
Expenses
Efficiency Risk & Liquidity
R square 0.784 0.565 0.208
F value 60.592 30.968 10.568
Model Significant at 1% Significant at 1% Significant at 1%
Positive influence FR/A, PM OE/LP, AS/GNI per
capita, LPSM,
PeAR
PAR>90 Days, RC
Negative
influence
-
-
-
Maximum
influence
PM
OE/LP
RC
Hypothesis Rejected
Rejected
Rejected
COMPARISON OF THE PERFORMANCE OF MFIs IN
INDIA AND BANGLADESH – An Analysis
 To compare the performance of MFIs in India and that of
of Bangladesh
 To identify the key drivers of their performance.
 Comparison of performance of MFIs in India and
Bangladesh - Based on the mean values of major categories
categories of parameters and also by applying repeated
repeated measures ANOVA, Kruskal wallis H test and Mann
Mann whitney U test.
REPEATED MEASURES ANOVA - RESULTS
INDICATORS BETWEEN
COUNTRIES
BETWEEN
YEARS
YEARS *
COUNTRIES
CAR Ns * (5%) *
DER Ns ** (1%) Ns
GLP to TA Ns * Ns
ALBPB * ** **
ALBPB/GNI per Capita ** ** **
NAB * ** **
ROA Ns Ns **
ROE Ns Ns **
OSS Ns Ns **
FR/A Ns * Ns
PM Ns Ns Ns
YGPN Ns ** Ns
REPEATED MEASURES ANOVA - RESULTS
INDICATORS BETWEEN
COUNTRIES
BETWEEN
YEARS
YEARS *
COUNTRIES
TE/A Ns Ns Ns
FE/A ** * *
PLI/A ** ** *
OE/A * * **
OE/LP ** ** **
AS/GNI per capita ** Ns Ns
CPB Ns ** Ns
LPSM ** ** Ns
PeAR Ns ** Ns
PAR>90 DAYS ** ** **
RC Ns Ns Ns
NELA as % TA Ns * Ns
AGEWISE COMPARISON – KRUSKAL WALLIS H
TEST
The MFIs classified on the basis of their age are:
(i) Age less than 10 years – New MFI
(ii) Age between 10 to 15 years – Young MFI
(iii) Age more than 15 years – Mature MFIs.
• India - MFIs are classified age wise as ‘New’, ‘Young’
and ‘Mature’
• Bangladesh - all the MFIs selected are observed to be
‘Mature’.
KRUSKAL WALLIS H TEST – RESULTS OF AGE WISE ANALYSIS
Indicators New Young Mature Chi square Significant
Assets 64.36 145.89 194.4 42.92 **
CAR 161.76 188.81 177.4 1.224 Ns
DER 201.34 167.43 177.92 1.855 Ns
GLP to TA 231.76 200.41 168.86 11.584 **
NAB 78.8 150.94 192.13 32.295 **
ALBPB 115.64 172.27 184.72 10.586 **
ALBPB/GNI per
Capita
103.76 99.5 199.72 56.503 **
AOB 124.82 186.73 181.13 7.355 *
ROA 193.7 178.21 176.54 0.641 Ns
ROE 204.1 181.3 175.01 1.907 Ns
OSS 189.38 178.76 176.83 0.347 Ns
FR/A 256.38 218.28 163.22 28.496 **
PM 188.3 176.65 177.33 0.273 Ns
KRUSKAL WALLIS H TEST – RESULTS OF AGE WISE ANALYSIS
Indicators New Young Mature Chi square Significant
YGPN 243.72 199.3 167.99 15.17 **
TE/A 243.44 217.68 164.5 22.881 **
FE/A 230.02 22.53 164.02 23.416 **
PLI/A 162.9 157.55 183.28 3.379 Ns
OE/A 227.86 192.28 170.77 8.304 *
OE/LP 210.96 176.92 175.23 2.786 Ns
AS/GNI per capita 139.88 119.68 192.6 26.173 **
CPB 160.24 180.49 179.13 0.815 Ns
LPSM 200.84 183.38 174.91 1.635 Ns
PeAR 217.74 170.4 175.87 4.16 Ns
PAR>90 DAYS 81.1 133.23 195.31 40.498 **
RC 170.86 208.91 172.73 5.68 Ns
NELA as % TA 117.82 175.22 183.96 9.572 **
A COMPARISON BASED ON GROUPINGS: -
• MATURE MFIs
• REGULATED MFIs
• NBFC Vs. NGO MFIs
• NGO Vs. NGO MFIs
• LARGE OUTREACH MFIs
• OVERALL PERFORMANCE OF MFIs
1. Comparison of Mature MFIs in India and Bangladesh:
From the results of age wise analysis it can be concluded that the mature MFIs
mature MFIs have shown better performance in general. Hence, an attempt has been
been made to compare only the Mature MFIs of India with those of Bangladesh by
by applying Mann-Whitney U test.
Total Indian MFIs - 46 Mature MFIs - 26
Total Bangladeshi MFIs - 25 Mature MFIs – 25
H0: “There is no significant difference in mean rank of categories of parameters of
of Mature MFIs in India and Bangladesh”.
MANN WHITNEY U TEST – RESULTS OF MATURE MFIS
Indicators Mann Whitney U Wilcoxon W Z Sig.
Assets 8831 16706 -1.008 Ns
CAR 9169.5 17045.5 -0.498 Ns
DER 9486 17361 -0.021 Ns
GLP to TA 77850 15725 -2.487 *
NAB 9135 20763 -0.55 Ns
ALBPB 5166 13041 -6.533 **
ALBPB/GNI per
Capita
3108 14736.5 -9.634 **
AOB 5540 13415 -5.969 **
ROA 9395.5 20987.5 -0.212 Ns
ROE 8551 16426 -1.43 Ns
OSS 9100.5 16975.5 -0.602 Ns
FR/A 7980 15855 -2.291 *
PM 8861 16736 -1.185 Ns
MANN WHITNEY U TEST – RESULTS OF MATURE MFIS
Indicators Mann Whitney U Wilcoxon W Z Sig.
YGPN 8713.5 16588.5 -1.642 Ns
TE/A 8410.5 16285.5 -1.642 Ns
FE/A 1384.5 9259.5 -12.232 **
PLI/A 5614 17242 -5.857 **
OE/A 4952.5 16580.5 -6.854 **
OE/LP 4852.5 16480.5 -7.005 **
AS/GNI per capita 4204 15832 -7.983 **
CPB 8944 20572.5 -0.838 Ns
LPSM 3430 11305 -9.149 **
PeAR 7335.5 15210.5 -3.263 **
PAR>90 DAYS 5836.5 17464.5 -5.536 **
RC 8519.5 20147.5 -1.481 Ns
NELA as % TA 9052.5 16927.5 -0.675 Ns
2. Comparison of Regulated MFIs in India and Bangladesh:
Total Indian MFIs - 46 Regulated MFIs - 30
Total Bangladeshi MFIs - 25 Regulated MFIs – 23
H0: “There is no significant difference in mean rank of categories of
parameters of Regulated MFIs in India and Bangladesh”.
REGULATED MFIS - RESULTS OF MANN WHITNEY U TEST
Indicators Mann Whitney U Wilcoxon W Z Sig.
Assets 7468 14138 -1.871 Ns
CAR 6697.5 13367.5 -3.117 **
DER 7070.5 18395.5 -2.514 *
GLP to TA 7363.5 14033.5 -2.04 *
NAB 8512 15182 -0.183 Ns
ALBPB 5307.5 11977.5 -5.365 **
ALBPB/GNI per
Capita
2681.5 14006.5 -9.612 **
AOB 5638.5 12308.5 -4.83 **
ROA 7922 19247 -1.137 Ns
ROE 8331.5 19656.5 -0.475 Ns
OSS 8562.5 15232.5 -0.101 Ns
FR/A 6062 12732 -4.145 **
PM 8350.5 15.20.5 -0.444 Ns
REGULATED MFIS - RESULTS OF MANN WHITNEY U TEST
Indicators Mann Whitney U Wilcoxon W Z Sig.
YGPN 6825 13495 -2.911 **
TE/A 6166.5 12386.5 -3.976 **
FE/A 1218 7888 -11.978 **
PLI/A 4950 16275.5 -5.942 **
OE/A 6251 17576 -3.839 **
OE/LP 6126.5 17451.5 -4.041 **
AS/GNI per capita 4206 15531 -7.146 **
CPB 7982.5 14652.5 -1.04 Ns
LPSM 3581.5 10251.5 -8.156 **
PeAR 6861.5 13531.5 -2.852 **
PAR>90 DAYS 4452 15777 -6.763 **
RC 7120 18445 -2.438 *
NELA as % TA 7171.5 13841.5 -2.351 *
3. Comparison of Indian NBFC MFIs and Bangladeshi NGO MFIs:
Total Indian MFIs - 46 NBFC MFIs – 27
Total Bangladeshi MFIs - 25 NGO MFIs – 23
H0: “There is no significant difference in mean rank of categories of
parameters of Indian NBFC MFIs and Bangladesh NGO”.
INDIAN NBFC AND BANGLADESH NGO MFIS - RESULTS OF MANN
WHITNEY U TEST
Indicators Mann Whitney U Wilcoxon W Z Sig.
Assets 6666 13336 -1.924 *
CAR 5835 12505 -3.382 **
DER 6257 15437 -2.642 **
GLP to TA 5691 12361 -3.635 **
NAB 6988 13658 -1.359 Ns
ALBPB 4917.5 11587.5 -4.993 **
ALBPB/GNI per
Capita
1422.5 10602.5 -11.126 **
AOB 5339 12009 -4.253 **
ROA 7336.5 16516.5 -0.748 Ns
ROE 7662.5 16842.5 -0.175 Ns
OSS 7473.5 14143.5 -0.507 Ns
FR/A 4646.5 11316.5 -5.468 **
PM 7248 13918 -0.903 Ns
INDIAN NBFC AND BANGLADESHI NGO MFIS - RESULTS OF MANN
WHITNEY U TEST
Indicators Mann Whitney U Wilcoxon W Z Sig.
YGPN 5856.5 12526.5 -3.345 **
TE/A 5161.5 11831.5 -4.564 **
FE/A 794.5 7464.5 -12.228 **
PLI/A 4507.5 133687.5 -5.712 **
OE/A 5479 14659 -4.007 **
OE/LP 4679 13859 -5.411 **
AS/GNI per capita 2987 12167 -8.38 **
CPB 7199.5 16379.5 -0.99 Ns
LPSM 2588.5 9258.5 -9.08 **
PeAR 5302 11972 -4.3118 **
PAR>90 DAYS 3964.5 13144.5 -6.675 **
RC 6640.5 15820.5 -1.972 *
NELA as % TA 7037.5 13707.5 -1.272 Ns
Total Indian MFIs - 46 NGO MFIs – 16
Total Bangladeshi MFIs - 25 NGO MFIs – 23
H0: “There is no significant difference in mean rank of
categories of parameters of NGO MFIs in India and
Bangladesh”.
4. COMPARISON OF NGO MFIS IN INDIA AND BANGLADESH
NGO MFIS IN INDIA AND BANGLADESH - RESULTS OF MANN
WHITNEY U TEST
Indicators Mann Whitney U Wilcoxon W Z Sig.
Assets 2410 5650 -5.65 **
CAR 3211.5 6451.5 -3.582 **
DER 3147.5 9817.5 -3.747 **
GLP to TA 3277 9947 -3.413 **
NAB 2483 5723 -5.461 **
ALBPB 4161 10831 -1.133 Ns
ALBPB/GNI per
Capita
466 3706 -10.665 **
AOB 3733.5 10403.5 -2.236 *
ROA 4401.5 11071.55 -0.512 Ns
ROE 3201 9871 -3.609 **
OSS 4600 11270 0 Ns
FR/A 3655.5 10325.5 -2.437 *
PM 4592.5 11262.5 -0.015 Ns
NGO MFIS IN INDIA AND BANGLADESH - RESULTS OF MANN
WHITNEY U TEST
Indicators Mann Whitney U Wilcoxon W Z Sig.
YGPN 44536 11206 -0.165 Ns
TE/A 4043 10713 -1.437 Ns
FE/A 639.5 7309.5 -10.217 **
PLI/A 2814 6054 -4.608 **
OE/A 3000 6240 -4.128 **
OE/LP 2721.5 5961.5 -4.846 **
AS/GNI per capita 860.5 4100.5 -9.647 **
CPB 3292.5 6532.5 -3.379 **
LPSM 2256 8926 -6.047 **
PeAR 3779 10449 -2.118 *
PAR>90 DAYS 2026.5 5266.5 -6.666 **
RC 3677.5 1047.5 -2.389 *
NELA as % TA 3451.5 6691.5 -2.936 **
5. LARGE OUTREACH MFIs IN INDIA AND
BANGLADESH
Total Indian MFIs - 46 Large outreach MFIs – 36
Total Bangladeshi MFIs - 25 Large outreach MFIs – 23
H0: “There is no significant difference in mean rank of
categories of parameters of Large outreach MFIs in
India and Bangladesh”.
MANN WHITNEY U TEST – RESULTS OF LARGE OUTREACH MFIS
Indicators Mann Whitney U Wilcoxon W Z Sig.
Assets 101551 16821 -0.278 Ns
CAR 9321.5 15991.5 -1.439 Ns
DER 9782.5 26072.5 -0.794 Ns
GLP to TA 7726 14396 -2.672 **
NAB 10004 26294 -0.484 Ns
ALBPB 6985.5 13655.5 -4.709 **
ALBPB/GNI per
Capita
2073 18363 -11.583 **
AOB 7287 13957 -4.287 **
ROA 10274 16944 -0.106 Ns
ROE 9215.5 15885.5 -1.588 Ns
OSS 9627 16297 -1.012 Ns
FR/A 7277.5 13947.5 -4.3 **
PM 9388.5 16058.5 -1.346 Ns
MANN WHITNEY U TEST – RESULTS OF LARGE OUTREACH MFIS
Indicators Mann Whitney U Wilcoxon W Z Sig.
YGPN 8923.5 15593.5 -1.996 *
TE/A 7886 14556 -3.448 **
FE/A 1273.5 79443.5 -12.702 **
PLI/A 5824 221114 -6.334 **
OE/A 6831.5 23121.5 -4.924 **
OE/LP 5875 22165 -6.263 **
AS/GNI per capita 3582.5 19872.5 -9.471 **
CPB 9128.5 25418.5 -7.12 Ns
LPSM 412 10793 -8.715 **
PeAR 7103 13773 -4.544 **
PAR>90 DAYS 5472 21762 -6.839 **
RC 10120.5 26410.5 -0.322 Ns
NELA as % TA 10300 16970 -0.07 Ns
OVERALL FINANCIAL PERFORMANCE – A
COMPARISON
Indian MFIs - 46
Bangladeshi MFIs - 25
H0: “There is no significant difference in mean rank of
categories of parameters of MFIs in India and
Bangladesh”.
MANN WHITNEY U TEST – OVERALL PERFORMANCE RESULTS
Indicators Mann Whitney U Wilcoxon W Z Sig.
Assets 13131 39696 -1.347 Ns
CAR 13869 21744 -0.548 Ns
DER 14360 22235 -0.016 Ns
GLP to TA 11007 18882 -3.647 **
NAB 12130 38695 -2.431 *
ALBPB 9548.5 17423.5 -5.226 **
ALBPB/GNI per
Capita
3665 300230 -11.597 **
AOB 9591.5 17466.5 -5.18 **
ROA 14360.5 40925.5 -0.016 Ns
ROE 12803 20678 -1.702 Ns
OSS 13727.5 21602.5 -0.701 Ns
FR/A 10348.5 18223.5 -4.36 **
PM 13479 21354 -0.97 Ns
MANN WHITNEY U TEST – RESULTS OF OVERALL PERFORMANCE
Indicators Mann Whitney U Wilcoxon W Z Sig.
YGPN 12059 19934 -2.508 *
TE/A 11202.5 19077.5 -3.435 **
FE/A 2183.5 10058.5 -13.201 **
PLI/A 8606 35171 -6.247 **
OE/A 9765 36330 -4.992 **
OE/LP 8962 35527 -5.861 **
AS/GNI per capita 5741.5 32306.5 -9.349 **
CPB 13485 40050 -0.965 Ns
LPSM 5947.5 13822.5 -9.125 **
PeAR 11342 19217 -3.284 **
PAR>90 DAYS 7370.5 33935.5 -7.607 **
RC 13894.5 40459.5 -0.521 Ns
NELA as % TA 14234 40799 -0.153 Ns
DISCRIMINANT FUNCTION ANALYSIS
Ratios Function ( R ) R2 %
Financial expense/ assets (%) 0.386 14.90
Average loan balance per borrower / GNI per capita (%) -0.260 6.76
Average salary/ GNI per capita -0.236 5.57
Loans per staff member 0.176 3.10
Average loan balance per borrower 0.113 1.28
Provision for loan impairment/ assets (%) -0.096 0.92
Assets -0.050 0.25
Cost per borrower 0.040 0.16
Portfolio at risk > 90 days (%) 0.019 0.04
Capital/asset ratio (%) 0.019 0.04
FINDINGS
1. Institutional Characteristics
If size of MFIs is determined on the value of total assets they
hold, then Bangladeshi MFIs are reasonably larger in size.
2. Financing Structure
• Both Indian and Bangladesh MFIs have sufficient capital to cushion
against losses and they can cover their debt obligations
• India - Arohan, Asirvad, Asomi, Biswa, HiH, Mimo finance, MMFL,
NBJK, Sarvodaya, SKS, Swadhaar, Trident microfinance, Ujjivan and
VFS - insufficient leverage
• Bangladesh - ASA, BRAC, CSS, CTS, IDF and RDRS - insufficient
leverage
3. Outreach Indicators
• The women participation to credit access is high both in India and
Bangladesh MFIs.
• The average loan balance per borrower of MFIs has shown an increase in
both India and Bangladesh. But Indian MFIs have a greater average loan
balance per borrower than that of Bangladesh MFIs.
• Large MFIs have extremely low average loan balance as a per cent of GNI
per capita, yet remain profitable
• Outreach is the core performance indicator. The outreach can be measured
by their depth and breadth.
• Indian MFIs have reached the depth of outreach and Bangladeshi MFIs
have performed better in breadth of outreach.
4. Overall Financial Performance
• As per ACCION audit the optimum range of profitability, as represented by
ROA should be greater than 3 per cent. Both Indian MFIs and Bangladeshi
MFIs lag behind on profitability front.
• The optimum range of profitability in terms of ROE prescribed by
ACCION audit is greater than 15 per cent. The Indian MFIs’ ability to
reward shareholders’ investment and to build equity base through
retained earnings is better than Bangladeshi MFIs.
• The revenue earned to cover the MFIs’ total cost, in terms of operational
self-sufficiency is above the standard as specified by Sa-Dhan i.e., 100
per cent for both Indian and Bangladeshi MFIs
5. Revenue and Expenses
• Indian MFIs generate revenue from both the Gross loan portfolio and
Investment at a higher rate than that of Bangladesh MFIs.
• Profit margin of Bangladeshi MFIs is found to be better than Indian MFIs.
The total expense and financial expense have been higher for Indian MFIs
when compared to those of Bangladeshi MFIs which reveal that
Bangladeshi MFIs concentrate on cost management practices.
• The provision for loan impairment/assets and operating expense/assets
have been greater for Bangladeshi MFIs and lower for Indian MFIs. The
increase in operating expense may be due to expense incurred to educate
the borrowers.
6. Efficiency
• The operating efficiency is satisfactory in both Indian and Bangladeshi MFIs as
they have maintained the operating expenses ratio at appropriate level of less
than 20 per cent as prescribed by Sa-Dhan.
• The increase in loans per staff member and personnel allocation ratio of Indian
MFIs indicates the efficiency of MFI staff, as they handle comparatively more
borrowers.
7. Risk and Liquidity
• Indian MFIs portfolio at risk is highly covered by the MFIs’ Impairment loss
allowance when compared to that of Bangladeshi MFIs.
• Bangladeshi MFIs have better liquidity, whereas, Indian MFIs have high risk
coverage .
TOP AND BOTTOM PERFORMERS -
INDICATORWISE
INDICATORS INDIA BANGLADESH
High Assets SKS GRAMEEN BANK
Less Assets BJS CTS
Highly Leveraged NCS SKS
Low Leveraged SKS CTS
Highest Gross Loan Portfolio to Total Assets SPANDANA CSS
Lowest Gross Loan Portfolio to Total Assets SEWA GRAMEEN BANK
More Number of Active Borrowers SKS GRAMEEN BANK
Less Number of Active Borrowers NCS BASTOB
Highest Average Loan Balance Per
Borrower
SEWA CDIP
Lowest Average Loan Balance Per Borrower SARALA RDRS
(CONTD …)
INDICATORS INDIA BANGLADESH
Highest Average Loan Balance Per Borrower /
GNI Per Capita
SARALA RDRS
Lowest Average Loan Balance Per Borrower /
GNI Per Capita
SEWA CDIP
Highest Average Outstanding Balance SARALA CTS
Lowest Average Outstanding Balance SAROVADAYA CDIP
100% Operational Self Sufficiency BISWA IDF
Highest Financial Revenue/Assets MAHASEMAM BRAC
Lowest Financial Revenue/Assets HiH COAST TRUST
Highest Profit Margin SWAWS ASA
Lowest Profit Margin SMSS PMUK
(CONTD . . .)
INDICATORS INDIA BANGLADESH
Highest Yield on Gross portfolio
(Nominal)
MAHASEMAM BURO BANGLADESH
Highest Financial Expenses/Assets SEWA BANK CSS
Lowest Financial Expenses/Assets NCS GRAMEEN BANK
Highest Total Expense/Assets SEWA BANK ASA
Lowest Total Expense/Assets SWADHAR PMUK
Highest Provision for Loan Impairment BWDA CDIP
Lowest Provision for Loan Impairment TRIDENT PMUK
Highest Operating Expense/Assets SARVODAYA GRAMEEN BANK
Lowest Operating Expense/Assets SWADHAR CTS
Highest Operating Expense/ Loan
Portfolio
SARVODAYA GRAMEEN BANK
Lowest Operating Expense/ Loan
Portfolio
SWADHAR CSS
(CONTD . . .)
INDICATORS INDIA BANGLADESH
Highest Average salary/GNI per
Capita
CCFID CTS
Lowest Average salary/GNI per Capita SEWA BANK BRAC
Highest Cost Per Borrower SARVODAYA RDRS
Lowest Cost Per Borrower SWADHAR DSK
Highest Loans per Staff Member SANGAMITRA GRAMEEN BANk
Lowest Loans per Staff Member HiH CTS
Highest Personnel Allocation Ratio SARVODAYA IDF
Lowest Personnel Allocation Ratio SEWA BANK RIC
Highest Portfolio at Risk ASIRVAD CDIP
Lowest Portfolio at Risk SEWA BANK RRF
Highest Risk Coverage GRAMA VIDIYAL CDIP
Lowest Risk Coverage SMSS BEES
Highest Non Earning liquid assets SARALA CTS
Lowest Non Earning liquid assets HiH GRAMEEN BANK
PERFORMERS BASED ON OVERALL SCORE
PERFORMER INDIA BANGLADESH
TOP
BANDHAN ASA
SARALA CDIP
SMILE RDRS
MODERATE
CASHPOR MC HEED
NBJK WAVE
SHARE SAJIDA
BOTTOM
NCS COAST TRUST
HiH PMUK
SWADHAR BEES
Cross Country Variation
• Both Indian and Bangladeshi MFIs have shown similar performance -
profit margin, total expense by assets and risk coverage, over the study
period.
• The ALBPB/GNI per capita, AOB, FE/A, PLI/A, OE/A, OE/LP and PAR
> 90 days have revealed a significant variation in performance among
Indian and Bangladeshi MFIs’ along with interaction of the years and
countries.
• The MFIs of two countries have experienced a pertinent difference in the
AS/GNI per capita, whereas, the study period has witnessed a vital
difference in DER, GLP to TA, ALBPB, FR/A, YGPN, CPB, PeAR,
NELA as a % of TA.
• ROA, ROE and OSS has shown a significant variation and interaction
effect between years and countries.
NEW YOUNG MATURE
• Capital to asset ratio
• Debt to equity ratio
• Gross loan portfolio to
total assets
• Average outstanding
balance
• Financial revenue to
assets
• Yield on gross portfolio
(nominal)
• Personnel allocation ratio
• Portfolio at risk greater
than 90 days
• Non-earning liquid assets
as a per cent of total
assets.
• Average loan balance to
GNI per capita
• Return on equity
• Provision for loan
impairment to assets
• Average salary to GNI
per capita.
• Assets
• Number of active
borrowers
• Average loan balance
per borrower
• Return on assets
• Operational self-
sufficiency
• Profit margin
• Financial expense to
assets
• Operating
expense/assets
• Operating expense to
loan portfolio, cost per
borrower
• Loan per staff member
• Risk coverage
AGEWISE PERFORMANCE
INDICATORS
MATURE REGULATED NBFC & NGO NGO & NGO LARGE OUTREACH OVERALL
India
Bangladesh
India
Bangladesh
India
Bangladesh
India
Bangladesh
India
Bangladesh
India
Bangladesh
Assets √ √ √ √ √ √
CAR √ √ √ √ √ √
DER √ √ √ √ √ √
GLP/TA √ √ √ √ √ √
NAB √ √ √ √ √ √
ALBPB √ √ √ √ √ √
ALBPB/GNI √ √ √ √ √ √
AOB √ √ √ √ √ √
ROA √ √ √ √ √ √
ROE √ √ √ √ √ √
OSS √ √ √ √ √ √
FR/A √ √ √ √ √ √
PM √ √ √ √ √ √
YGP(N) √ √ √ √ √ √
TE/A √ √ √ √ √ √
FE/A √ √ √ √ √ √
PLI/A √ √ √ √ √ √
OE/A √ √ √ √ √ √
OE/LP √ √ √ √ √ √
AS/GNI √ √ √ √ √ √
CPB √ √ √ √ √ √
LPSM √ √ √ √ √ √
PeAR √ √ √ √ √ √
PAR √ √ √ √ √ √
RC √ √ √ √ √ √
NELA as % of TA √ √ √ √ √ √
Discriminating variables:
Indian MFIs have shown better performance in the variables,
namely,
• average loan balance per borrower/GNI per capita
• average salary/GNI per capita
• loans per staff member
• average loan balance per borrower
Bangladesh MFIs have performed better in only
• financial expense/assets
General Hypothesis – Accepted/Rejected
It is found that though the MFIs in Bangladesh is mature because of its
early origin, Indian MFIs seems to have better performance even with the New,
Young and Mature MFIs. The MFIs in India and Bangladesh differ in their
performance during the study period. Hence, the general hypothesis that
‘Performance of MFIs is similar irrespective of the country they belong to’ is
disproved.
The financial performance of Mature MFIs, Regulated MFIs, NBFC MFIs,
NGO MFIs and MFIs with large outreach of India reveals a better and welcoming
performance when compared with that of corresponding MFIs in Bangladesh. Thus,
it is found that both financial and non-financial (status) factors are important for the
sustenance of MFIs, thereby, the general hypothesis that ‘Performance of MFIs
depends only on financial factors’ is not accepted.
From the study it is vivid that age is an important factor in the
performance of MFIs. Among the age groups, Mature MFIs have shown better
performance in terms of breadth of outreach; profitability in terms of return on
assets and operational self-sufficiency; revenue in terms of profit margin;
expenses in terms of total expense to assets and financial expense to assets;
efficiency in terms of operating expense to loan portfolio and cost per borrower
and loan per staff member; and risk in terms of risk coverage. Thus, the general
hypothesis that ‘Age is not an important criterion for sustenance’ is not
approved.
SUGGESTIONS
India
• Government can take measures to give financial Institutional status (status of Bank)
based on the consistent performance of MFIs (to those who qualify the conditions)
• Government can drive the machinery to inculcate the concept of MFIs in the minds
of public and to strengthen the performance of MFIs.
• The geographical population is dense in Northern region, while the clientele base
expansion of MFIs is strong in south. Government should take initiative to increase
the number MFIs in northern region.
• Reporting norms should be made uniform and mandatory for all MFIs both at
regional and global level.
• Websites exclusively for MFIs in India can be launched revealing transparent
information.
• RBI can set up regulatory authority to monitor the performance of MFIs. Though the
MFIs follow the norms and standards set by RBI, a separate regulatory authority
would more efficiently monitor performance of MFIs. Similar practice can be
followed in those countries where the information availability is limited.
• MFIs in India should focus more on the cost management, to improve their
performance.
• MFIs should gain public confidence through their effective performance and service
to the beneficiaries so that financial crisis or distress can be avoided. They can adopt
corporate governance concept in their functioning.
• MFIs in India can become sustainable through efficient asset management, cost
management and leverage management. Leverage management can be effective with
well-maintained capital asset ratio and debt equity ratio within the limit fixed by the
apex bodies.
Bangladesh
1. The predominant focus of Bangladeshi MFIs should be on the earnings
management of MFIs to improve the performance.
2. Bangladesh can take effective measures to increase the number of
active borrowers by providing fruitful services.
3. MFIs in Bangladesh can concentrate on asset management, cost
management and leverage management to attain sustainability.
4. MFIs in Bangladesh should report the financial details on line with
transparency.
5. Mutual exchange of information and technology to be adopted for
economic development can be encouraged.
6. The concept of corporate governance can be adopted by MFIs.
Conclusion
Overall, MFIs in India and Bangladesh are dynamic and growing and, therefore, the
journey of MFIs has been encouraging in both the countries. Although the microfinance sector
has reported an impressive growth, sufficient regulatory and governance would help achieve
the goal of poverty alleviation, empowerment and financial inclusion and this could be
achieved with combined cooperation of banks, donors’ government, NGO and other players in
the country. Technological innovations, product requirements, and ongoing efforts to
strengthen the capacity of MFIs are needed to reduce costs, increase outreach and boost overall
profitability.
Several Indian NGO MFIs are converting themselves into NBFC MFIs; thereby they
are able to raise their capital base. In case of Bangladesh, NBFC MFIs are not operational and
therefore, they have limited scope to increase their capital base. On comparison of the financial
performance of MFIs during the study period it is evident that the Indian MFIs stand better than
the MFIs of Bangladesh in many aspects, though Bangladesh is the place of origin for the
concept of microfinance and Microfinance Institutions.
SIGNIFICANCE OF THE STUDY
The study will be useful to:
• The MFIs, for knowing their performance and taking
appropriate decisions; to motivate MFIs towards performance
improvement, and compare with their peers,
• The donor, to decide the extent of support to be given to its
partner and to know the level of sustainability of its partners,
• Investors, to identify potential investment,
• The researchers and academicians and
• The policy makers for their national development decisions.
THANK YOU

FINANCIAL PERFORMANCE OF MICROFINANCE INSTITUTIONS

  • 1.
    FINANCIAL PERFORMANCE OF MICROFINANCEINSTITUTIONS – A COMPARATIVE STUDY OF INDIAAND BANGLADESH By R.RUPA Supervisor Dr.PADMAJA MANOHARAN, M.Com., M.Phil., MBA., ACS., Ph.D., Associate Professor and Head of the Department of Commerce (Retd) PSGR Krishnammal College for Women (Autonomous) Coimbatore
  • 2.
    INTRODUCTION  Finance isan extra ordinary effective tool in spreading economic opportunity and fighting against poverty. Access to finance allows the poor to use their rich talents or open avenues for greater opportunities.  A very large number of poorest of the poor continue to remain outside the reach of formal banking system. Existing banking policies, procedures and system have not been well suited to meet the credit needs of poor.  Starting with the Grameen bank founded by Mohammed Yunus of Bangladesh in 1970s microfinance represented a method of lending that is to be tailored specifically to the world’s poorest population.  Microfinance, today, represents a market solution to mitigation of poverty and acts as a development and economic tool in bringing about financial inclusion in India.
  • 3.
    MICROFINANCE INSTITUTIONS  ConsultativeGroup to Assist the Poor (CGAP) defines Microfinance as “a credit methodology that employs effective collateral substitutes to deliver and recover short-term working capital loans to micro entrepreneurs.” The institutions that are providing these services to poor are called Microfinance Institutions (MFIs).  MFIs are commonly known as “Bank for the poor”.
  • 4.
  • 5.
    STATEMENT OF THEPROBLEM India and Bangladesh are two developing economies in the world and poverty is a common problem in these two countries. It becomes imperative to formulate specific situational poverty alleviation policies and programmes for generation of minimum level of income for rural poor. Microfinance is an option to resolve this problem of poor people. Bangladesh has been the birth place of microfinance and also the pioneer in the world for applying microfinance. The microfinance industry in India started with informal Self Help Group (SHG) to access the much – needed savings and credit services in the early 1980’s and today it has evolved into a vibrant industry exhibiting variety of business model.
  • 6.
    To provide microfinanceand other support services MFIs should be able to sustain for a long period. In order to sustain operations, MFIs must generate enough revenues from financial services to cover their financial and operating cost and in many cases, build institutional capital through profit. There are barely few studies, which have made a comparison on the financial performance of MFIs between different countries. The financial performance of MFIs may be compared either with previous years’ performance or with that of other countries which are pioneer in Microfinance. Bangladesh, being the pioneer in the microfinance and having demographics similar to India is the obvious choice for comparison. The present study is an attempt to fill this research gap by assessing the current financial performance of MFIs in India (our country) and Bangladesh (originator) and to make a comparison thereof.
  • 7.
    HYPOTHESES The hypotheses ofthe study are:  Performance of MFIs is similar irrespective of the countries they belong to.  Age is not an important criterion for sustenance of MFIs.  Performance of MFIs depends only on financial factors.
  • 8.
    SCOPE OF THESTUDY The study is pertaining to MFIs in India and Bangladesh. The comprehensive financial performance indicators model used by Microfinance Information Exchange (MIX) has been chosen for the study. The study covers mainly seven categories of parameters as prescribed by MIX:  Institutional characteristics  Financing structure  Outreach indicators  Overall financial performance  Revenue and expenses  Efficiency  Risk and liquidity Macro economic indicators are not considered for the study.
  • 9.
    RESEARCH METHODOLOGY • Sourceof data - Secondary data - Microfinance Information Exchange (MIX) i.e., www.mixmarket.org. • Period of study - 2007-08 to 2011-2012 • Sample and Sampling Design - Financial details atleast for 5 years continuously have been identified. - 122 MFIs in India and 37 MFIs in Bangladesh. - Out of 122 Indian MFIs only 46 MFIs have fulfilled the requirements and out of 37 Bangladesh MFIs only 25 MFIs have fulfilled requirements. - All 71 MFIs (46 Indian and 25 Bangladeshi MFIs) are analysed in the study
  • 10.
    TOOLS FOR ANALYSIS Descriptive Statistics - Mean, Standard deviation and Coefficient of Variation - Growth measures: AGR, LAGR and CAGR  Correlation analysis  Multiple Regression analysis  Repeated Measures ANOVA  Kruskal Wallis H test  Mann-Whitney U test or Wilcoxon rank sum test  Discriminant Function Analysis
  • 11.
    LIMITATIONS OF THESTUDY  The limitations inherent in statistical tools apply to this study also.  Non availability of continuous data from MIX for more than five years has restricted the period and number of MFIs in this study.
  • 12.
    CHAPTER SCHEME The thesishas been presented as given below: Chapters: 1. Introduction and research design 2. Review of literature 3. Scenario of MFIs in India and Bangladesh 4. Financial performance of MFIs in India 5. Financial performance of MFIs in Bangladesh 6. Comparison of the performance of MFIs of India and Bangladesh 7. Findings, Suggestions and Conclusion
  • 13.
    REVIEW OF LITERATURE– A STUDY OF YESTER YEARS  Total review – 60  Indian – 16  Worldwide including India and Bangladesh - 44
  • 14.
    SCENARIO OF MFIS MicrofinanceInstitutions in South Asian Countries  South Asia consist of eight countries, namely, Afghanistan, Bangladesh, Bhutan, India, Maldives, Nepal, Pakistan and Sri Lanka, which has a large combined population (1.5 bn), second to East Asia (2 bn).  The World Bank has called South Asia “Cradle of Microfinance”.  Almost half of all the people in world who use Microfinance services are living in South Asia  Lending in South Asia has been dominated by India.
  • 15.
    SCENARIO OF MFISIN INDIA Evolution of MFIs:  The cooperative movement (1900-1960)  Subsidized social banking (1960s - 1990)  SHG-Bank linkage program and growth of NGO-MFIs (1990 - 2000)  Commercialization of Microfinance: The first decade of the new millennium Types of MFIs in India: 1. Non-for-profit MFIs 2. Mutual Benefit Companies 3. For-Profit MFIs
  • 16.
    SCENARIO OF MFISIN BANGLADESH  Bangladesh is one of the world’s ten most populated countries and more than half of the population lives in agrarian rural villages.  The microfinance sector in Bangladesh is one of the world’s largest. Bangladeshi MFIs are best known for their pioneering, large-scale provision of microfinance services, principally, tiny collateral-free loans to poor women. Origin : 1. Action research phase in the 1970s 2. Microcredit development phase in the 1980s 3. Consolidation phase in the 1990s 4. Expansion phase from 2000 onwards Types of MFIs in Bangladesh: 1. NGO MFIs registered as NGOs 4. Cooperative societies 2. Societies 5. Trusts 3. Not-for-profit Companies
  • 17.
    FINANCIAL PERFORMANCE OFMFIs IN INDIA – An Analysis  Understanding the financial performance helps to to improve profitability and sustainability of MFIs.
  • 18.
    CATEGORIES OF PARAMETERSAND INDICATORS 1. Institutional characteristics  Assets 2. Financing structure  CAR  DER  GLP to TA 3. Outreach indicators  NAB  ALBPB  ALBPB/GNI per capita  AOB 4. Overall financial performance  ROA  ROE  OSS 5. Revenue and expenses  FR/A  PM  YGP(N)  TE/A  FE/A  PLI/A  OE/A 6. Efficiency  OE/LP  AS/GNI per capita  CPB  LPSM  PeAR 7. Risk and liquidity  PAR> 90 Days  RC  NELA as % of TA
  • 19.
    • Variable wiseanalysis - Selected MFIs are individually analysed variable wise. • Ranking of MFIs applying numerical scoring (Z scores). • Multiple regression analysis Dependent variable - Overall performance score Independent variable – Financing structure Outreach indicators Overall financial performance indicators Revenue and expenses Efficiency Risk and liquidity
  • 20.
    MULTIPLE REGRESSION ANALYSIS- RESULTS Financing Structure Outreach Indicators Overall Financial Performance R square 0.153 0.378 0.700 F value 13.567 34.208 176.153 Model Significant at 1% Significant at 1% Significant at 1% Positive influence GLP to TA NAB, ALBPB ROE OSS Negative influence - ALBPB/GNI per capita ROA Maximum influence - ALBPB OSS Hypothesis Rejected Rejected Rejected
  • 21.
    MULTIPLE REGRESSION ANALYSIS– RESULTS Revenue & Expenses Efficiency Risk & Liquidity R square 0.762 0.533 0.143 F value 101.765 51.162 12.272 Model Significant at 1% Significant at 1% Significant at 1% Positive influence FR/A, PM, TE/A, PLI/A, OE/A AS/GNI per capita, CPB, LPSM, PeAR PAR>90 Days, RC Negative influence YGP(N) - - Maximum influence FR/A CPB PAR>90 Days Hypothesis Rejected Rejected Rejected
  • 22.
    FINANCIAL PERFORMANCE OFMFIs IN BANGLADESH – An Analysis The trend and growth of MFIs in Bangladesh in respect of variables has been analysed. Correlation analysis Variable wise analysis Ranking of MFIs applying numerical scoring (Z scores). Multiple regression analysis
  • 23.
    MULTIPLE REGRESSION ANALYSIS- RESULTS Financing Structure Outreach Indicators Overall Financial Performance R square 0.193 0.393 0.766 F value 9.642 19.444 132.143 Model Significant at 1% Significant at 1% Significant at 1% Positive influence DER, GLP to TA NAB ROA, OSS Negative influence - - ROE Maximum influence DER - OSS Hypothesis Rejected Rejected Rejected
  • 24.
    MULTIPLE REGRESSION ANALYSIS- RESULTS Revenue & Expenses Efficiency Risk & Liquidity R square 0.784 0.565 0.208 F value 60.592 30.968 10.568 Model Significant at 1% Significant at 1% Significant at 1% Positive influence FR/A, PM OE/LP, AS/GNI per capita, LPSM, PeAR PAR>90 Days, RC Negative influence - - - Maximum influence PM OE/LP RC Hypothesis Rejected Rejected Rejected
  • 25.
    COMPARISON OF THEPERFORMANCE OF MFIs IN INDIA AND BANGLADESH – An Analysis  To compare the performance of MFIs in India and that of of Bangladesh  To identify the key drivers of their performance.  Comparison of performance of MFIs in India and Bangladesh - Based on the mean values of major categories categories of parameters and also by applying repeated repeated measures ANOVA, Kruskal wallis H test and Mann Mann whitney U test.
  • 26.
    REPEATED MEASURES ANOVA- RESULTS INDICATORS BETWEEN COUNTRIES BETWEEN YEARS YEARS * COUNTRIES CAR Ns * (5%) * DER Ns ** (1%) Ns GLP to TA Ns * Ns ALBPB * ** ** ALBPB/GNI per Capita ** ** ** NAB * ** ** ROA Ns Ns ** ROE Ns Ns ** OSS Ns Ns ** FR/A Ns * Ns PM Ns Ns Ns YGPN Ns ** Ns
  • 27.
    REPEATED MEASURES ANOVA- RESULTS INDICATORS BETWEEN COUNTRIES BETWEEN YEARS YEARS * COUNTRIES TE/A Ns Ns Ns FE/A ** * * PLI/A ** ** * OE/A * * ** OE/LP ** ** ** AS/GNI per capita ** Ns Ns CPB Ns ** Ns LPSM ** ** Ns PeAR Ns ** Ns PAR>90 DAYS ** ** ** RC Ns Ns Ns NELA as % TA Ns * Ns
  • 28.
    AGEWISE COMPARISON –KRUSKAL WALLIS H TEST The MFIs classified on the basis of their age are: (i) Age less than 10 years – New MFI (ii) Age between 10 to 15 years – Young MFI (iii) Age more than 15 years – Mature MFIs. • India - MFIs are classified age wise as ‘New’, ‘Young’ and ‘Mature’ • Bangladesh - all the MFIs selected are observed to be ‘Mature’.
  • 29.
    KRUSKAL WALLIS HTEST – RESULTS OF AGE WISE ANALYSIS Indicators New Young Mature Chi square Significant Assets 64.36 145.89 194.4 42.92 ** CAR 161.76 188.81 177.4 1.224 Ns DER 201.34 167.43 177.92 1.855 Ns GLP to TA 231.76 200.41 168.86 11.584 ** NAB 78.8 150.94 192.13 32.295 ** ALBPB 115.64 172.27 184.72 10.586 ** ALBPB/GNI per Capita 103.76 99.5 199.72 56.503 ** AOB 124.82 186.73 181.13 7.355 * ROA 193.7 178.21 176.54 0.641 Ns ROE 204.1 181.3 175.01 1.907 Ns OSS 189.38 178.76 176.83 0.347 Ns FR/A 256.38 218.28 163.22 28.496 ** PM 188.3 176.65 177.33 0.273 Ns
  • 30.
    KRUSKAL WALLIS HTEST – RESULTS OF AGE WISE ANALYSIS Indicators New Young Mature Chi square Significant YGPN 243.72 199.3 167.99 15.17 ** TE/A 243.44 217.68 164.5 22.881 ** FE/A 230.02 22.53 164.02 23.416 ** PLI/A 162.9 157.55 183.28 3.379 Ns OE/A 227.86 192.28 170.77 8.304 * OE/LP 210.96 176.92 175.23 2.786 Ns AS/GNI per capita 139.88 119.68 192.6 26.173 ** CPB 160.24 180.49 179.13 0.815 Ns LPSM 200.84 183.38 174.91 1.635 Ns PeAR 217.74 170.4 175.87 4.16 Ns PAR>90 DAYS 81.1 133.23 195.31 40.498 ** RC 170.86 208.91 172.73 5.68 Ns NELA as % TA 117.82 175.22 183.96 9.572 **
  • 31.
    A COMPARISON BASEDON GROUPINGS: - • MATURE MFIs • REGULATED MFIs • NBFC Vs. NGO MFIs • NGO Vs. NGO MFIs • LARGE OUTREACH MFIs • OVERALL PERFORMANCE OF MFIs 1. Comparison of Mature MFIs in India and Bangladesh: From the results of age wise analysis it can be concluded that the mature MFIs mature MFIs have shown better performance in general. Hence, an attempt has been been made to compare only the Mature MFIs of India with those of Bangladesh by by applying Mann-Whitney U test. Total Indian MFIs - 46 Mature MFIs - 26 Total Bangladeshi MFIs - 25 Mature MFIs – 25 H0: “There is no significant difference in mean rank of categories of parameters of of Mature MFIs in India and Bangladesh”.
  • 32.
    MANN WHITNEY UTEST – RESULTS OF MATURE MFIS Indicators Mann Whitney U Wilcoxon W Z Sig. Assets 8831 16706 -1.008 Ns CAR 9169.5 17045.5 -0.498 Ns DER 9486 17361 -0.021 Ns GLP to TA 77850 15725 -2.487 * NAB 9135 20763 -0.55 Ns ALBPB 5166 13041 -6.533 ** ALBPB/GNI per Capita 3108 14736.5 -9.634 ** AOB 5540 13415 -5.969 ** ROA 9395.5 20987.5 -0.212 Ns ROE 8551 16426 -1.43 Ns OSS 9100.5 16975.5 -0.602 Ns FR/A 7980 15855 -2.291 * PM 8861 16736 -1.185 Ns
  • 33.
    MANN WHITNEY UTEST – RESULTS OF MATURE MFIS Indicators Mann Whitney U Wilcoxon W Z Sig. YGPN 8713.5 16588.5 -1.642 Ns TE/A 8410.5 16285.5 -1.642 Ns FE/A 1384.5 9259.5 -12.232 ** PLI/A 5614 17242 -5.857 ** OE/A 4952.5 16580.5 -6.854 ** OE/LP 4852.5 16480.5 -7.005 ** AS/GNI per capita 4204 15832 -7.983 ** CPB 8944 20572.5 -0.838 Ns LPSM 3430 11305 -9.149 ** PeAR 7335.5 15210.5 -3.263 ** PAR>90 DAYS 5836.5 17464.5 -5.536 ** RC 8519.5 20147.5 -1.481 Ns NELA as % TA 9052.5 16927.5 -0.675 Ns
  • 34.
    2. Comparison ofRegulated MFIs in India and Bangladesh: Total Indian MFIs - 46 Regulated MFIs - 30 Total Bangladeshi MFIs - 25 Regulated MFIs – 23 H0: “There is no significant difference in mean rank of categories of parameters of Regulated MFIs in India and Bangladesh”.
  • 35.
    REGULATED MFIS -RESULTS OF MANN WHITNEY U TEST Indicators Mann Whitney U Wilcoxon W Z Sig. Assets 7468 14138 -1.871 Ns CAR 6697.5 13367.5 -3.117 ** DER 7070.5 18395.5 -2.514 * GLP to TA 7363.5 14033.5 -2.04 * NAB 8512 15182 -0.183 Ns ALBPB 5307.5 11977.5 -5.365 ** ALBPB/GNI per Capita 2681.5 14006.5 -9.612 ** AOB 5638.5 12308.5 -4.83 ** ROA 7922 19247 -1.137 Ns ROE 8331.5 19656.5 -0.475 Ns OSS 8562.5 15232.5 -0.101 Ns FR/A 6062 12732 -4.145 ** PM 8350.5 15.20.5 -0.444 Ns
  • 36.
    REGULATED MFIS -RESULTS OF MANN WHITNEY U TEST Indicators Mann Whitney U Wilcoxon W Z Sig. YGPN 6825 13495 -2.911 ** TE/A 6166.5 12386.5 -3.976 ** FE/A 1218 7888 -11.978 ** PLI/A 4950 16275.5 -5.942 ** OE/A 6251 17576 -3.839 ** OE/LP 6126.5 17451.5 -4.041 ** AS/GNI per capita 4206 15531 -7.146 ** CPB 7982.5 14652.5 -1.04 Ns LPSM 3581.5 10251.5 -8.156 ** PeAR 6861.5 13531.5 -2.852 ** PAR>90 DAYS 4452 15777 -6.763 ** RC 7120 18445 -2.438 * NELA as % TA 7171.5 13841.5 -2.351 *
  • 37.
    3. Comparison ofIndian NBFC MFIs and Bangladeshi NGO MFIs: Total Indian MFIs - 46 NBFC MFIs – 27 Total Bangladeshi MFIs - 25 NGO MFIs – 23 H0: “There is no significant difference in mean rank of categories of parameters of Indian NBFC MFIs and Bangladesh NGO”.
  • 38.
    INDIAN NBFC ANDBANGLADESH NGO MFIS - RESULTS OF MANN WHITNEY U TEST Indicators Mann Whitney U Wilcoxon W Z Sig. Assets 6666 13336 -1.924 * CAR 5835 12505 -3.382 ** DER 6257 15437 -2.642 ** GLP to TA 5691 12361 -3.635 ** NAB 6988 13658 -1.359 Ns ALBPB 4917.5 11587.5 -4.993 ** ALBPB/GNI per Capita 1422.5 10602.5 -11.126 ** AOB 5339 12009 -4.253 ** ROA 7336.5 16516.5 -0.748 Ns ROE 7662.5 16842.5 -0.175 Ns OSS 7473.5 14143.5 -0.507 Ns FR/A 4646.5 11316.5 -5.468 ** PM 7248 13918 -0.903 Ns
  • 39.
    INDIAN NBFC ANDBANGLADESHI NGO MFIS - RESULTS OF MANN WHITNEY U TEST Indicators Mann Whitney U Wilcoxon W Z Sig. YGPN 5856.5 12526.5 -3.345 ** TE/A 5161.5 11831.5 -4.564 ** FE/A 794.5 7464.5 -12.228 ** PLI/A 4507.5 133687.5 -5.712 ** OE/A 5479 14659 -4.007 ** OE/LP 4679 13859 -5.411 ** AS/GNI per capita 2987 12167 -8.38 ** CPB 7199.5 16379.5 -0.99 Ns LPSM 2588.5 9258.5 -9.08 ** PeAR 5302 11972 -4.3118 ** PAR>90 DAYS 3964.5 13144.5 -6.675 ** RC 6640.5 15820.5 -1.972 * NELA as % TA 7037.5 13707.5 -1.272 Ns
  • 40.
    Total Indian MFIs- 46 NGO MFIs – 16 Total Bangladeshi MFIs - 25 NGO MFIs – 23 H0: “There is no significant difference in mean rank of categories of parameters of NGO MFIs in India and Bangladesh”. 4. COMPARISON OF NGO MFIS IN INDIA AND BANGLADESH
  • 41.
    NGO MFIS ININDIA AND BANGLADESH - RESULTS OF MANN WHITNEY U TEST Indicators Mann Whitney U Wilcoxon W Z Sig. Assets 2410 5650 -5.65 ** CAR 3211.5 6451.5 -3.582 ** DER 3147.5 9817.5 -3.747 ** GLP to TA 3277 9947 -3.413 ** NAB 2483 5723 -5.461 ** ALBPB 4161 10831 -1.133 Ns ALBPB/GNI per Capita 466 3706 -10.665 ** AOB 3733.5 10403.5 -2.236 * ROA 4401.5 11071.55 -0.512 Ns ROE 3201 9871 -3.609 ** OSS 4600 11270 0 Ns FR/A 3655.5 10325.5 -2.437 * PM 4592.5 11262.5 -0.015 Ns
  • 42.
    NGO MFIS ININDIA AND BANGLADESH - RESULTS OF MANN WHITNEY U TEST Indicators Mann Whitney U Wilcoxon W Z Sig. YGPN 44536 11206 -0.165 Ns TE/A 4043 10713 -1.437 Ns FE/A 639.5 7309.5 -10.217 ** PLI/A 2814 6054 -4.608 ** OE/A 3000 6240 -4.128 ** OE/LP 2721.5 5961.5 -4.846 ** AS/GNI per capita 860.5 4100.5 -9.647 ** CPB 3292.5 6532.5 -3.379 ** LPSM 2256 8926 -6.047 ** PeAR 3779 10449 -2.118 * PAR>90 DAYS 2026.5 5266.5 -6.666 ** RC 3677.5 1047.5 -2.389 * NELA as % TA 3451.5 6691.5 -2.936 **
  • 43.
    5. LARGE OUTREACHMFIs IN INDIA AND BANGLADESH Total Indian MFIs - 46 Large outreach MFIs – 36 Total Bangladeshi MFIs - 25 Large outreach MFIs – 23 H0: “There is no significant difference in mean rank of categories of parameters of Large outreach MFIs in India and Bangladesh”.
  • 44.
    MANN WHITNEY UTEST – RESULTS OF LARGE OUTREACH MFIS Indicators Mann Whitney U Wilcoxon W Z Sig. Assets 101551 16821 -0.278 Ns CAR 9321.5 15991.5 -1.439 Ns DER 9782.5 26072.5 -0.794 Ns GLP to TA 7726 14396 -2.672 ** NAB 10004 26294 -0.484 Ns ALBPB 6985.5 13655.5 -4.709 ** ALBPB/GNI per Capita 2073 18363 -11.583 ** AOB 7287 13957 -4.287 ** ROA 10274 16944 -0.106 Ns ROE 9215.5 15885.5 -1.588 Ns OSS 9627 16297 -1.012 Ns FR/A 7277.5 13947.5 -4.3 ** PM 9388.5 16058.5 -1.346 Ns
  • 45.
    MANN WHITNEY UTEST – RESULTS OF LARGE OUTREACH MFIS Indicators Mann Whitney U Wilcoxon W Z Sig. YGPN 8923.5 15593.5 -1.996 * TE/A 7886 14556 -3.448 ** FE/A 1273.5 79443.5 -12.702 ** PLI/A 5824 221114 -6.334 ** OE/A 6831.5 23121.5 -4.924 ** OE/LP 5875 22165 -6.263 ** AS/GNI per capita 3582.5 19872.5 -9.471 ** CPB 9128.5 25418.5 -7.12 Ns LPSM 412 10793 -8.715 ** PeAR 7103 13773 -4.544 ** PAR>90 DAYS 5472 21762 -6.839 ** RC 10120.5 26410.5 -0.322 Ns NELA as % TA 10300 16970 -0.07 Ns
  • 46.
    OVERALL FINANCIAL PERFORMANCE– A COMPARISON Indian MFIs - 46 Bangladeshi MFIs - 25 H0: “There is no significant difference in mean rank of categories of parameters of MFIs in India and Bangladesh”.
  • 47.
    MANN WHITNEY UTEST – OVERALL PERFORMANCE RESULTS Indicators Mann Whitney U Wilcoxon W Z Sig. Assets 13131 39696 -1.347 Ns CAR 13869 21744 -0.548 Ns DER 14360 22235 -0.016 Ns GLP to TA 11007 18882 -3.647 ** NAB 12130 38695 -2.431 * ALBPB 9548.5 17423.5 -5.226 ** ALBPB/GNI per Capita 3665 300230 -11.597 ** AOB 9591.5 17466.5 -5.18 ** ROA 14360.5 40925.5 -0.016 Ns ROE 12803 20678 -1.702 Ns OSS 13727.5 21602.5 -0.701 Ns FR/A 10348.5 18223.5 -4.36 ** PM 13479 21354 -0.97 Ns
  • 48.
    MANN WHITNEY UTEST – RESULTS OF OVERALL PERFORMANCE Indicators Mann Whitney U Wilcoxon W Z Sig. YGPN 12059 19934 -2.508 * TE/A 11202.5 19077.5 -3.435 ** FE/A 2183.5 10058.5 -13.201 ** PLI/A 8606 35171 -6.247 ** OE/A 9765 36330 -4.992 ** OE/LP 8962 35527 -5.861 ** AS/GNI per capita 5741.5 32306.5 -9.349 ** CPB 13485 40050 -0.965 Ns LPSM 5947.5 13822.5 -9.125 ** PeAR 11342 19217 -3.284 ** PAR>90 DAYS 7370.5 33935.5 -7.607 ** RC 13894.5 40459.5 -0.521 Ns NELA as % TA 14234 40799 -0.153 Ns
  • 49.
    DISCRIMINANT FUNCTION ANALYSIS RatiosFunction ( R ) R2 % Financial expense/ assets (%) 0.386 14.90 Average loan balance per borrower / GNI per capita (%) -0.260 6.76 Average salary/ GNI per capita -0.236 5.57 Loans per staff member 0.176 3.10 Average loan balance per borrower 0.113 1.28 Provision for loan impairment/ assets (%) -0.096 0.92 Assets -0.050 0.25 Cost per borrower 0.040 0.16 Portfolio at risk > 90 days (%) 0.019 0.04 Capital/asset ratio (%) 0.019 0.04
  • 50.
    FINDINGS 1. Institutional Characteristics Ifsize of MFIs is determined on the value of total assets they hold, then Bangladeshi MFIs are reasonably larger in size. 2. Financing Structure • Both Indian and Bangladesh MFIs have sufficient capital to cushion against losses and they can cover their debt obligations • India - Arohan, Asirvad, Asomi, Biswa, HiH, Mimo finance, MMFL, NBJK, Sarvodaya, SKS, Swadhaar, Trident microfinance, Ujjivan and VFS - insufficient leverage • Bangladesh - ASA, BRAC, CSS, CTS, IDF and RDRS - insufficient leverage
  • 51.
    3. Outreach Indicators •The women participation to credit access is high both in India and Bangladesh MFIs. • The average loan balance per borrower of MFIs has shown an increase in both India and Bangladesh. But Indian MFIs have a greater average loan balance per borrower than that of Bangladesh MFIs. • Large MFIs have extremely low average loan balance as a per cent of GNI per capita, yet remain profitable • Outreach is the core performance indicator. The outreach can be measured by their depth and breadth. • Indian MFIs have reached the depth of outreach and Bangladeshi MFIs have performed better in breadth of outreach.
  • 52.
    4. Overall FinancialPerformance • As per ACCION audit the optimum range of profitability, as represented by ROA should be greater than 3 per cent. Both Indian MFIs and Bangladeshi MFIs lag behind on profitability front. • The optimum range of profitability in terms of ROE prescribed by ACCION audit is greater than 15 per cent. The Indian MFIs’ ability to reward shareholders’ investment and to build equity base through retained earnings is better than Bangladeshi MFIs. • The revenue earned to cover the MFIs’ total cost, in terms of operational self-sufficiency is above the standard as specified by Sa-Dhan i.e., 100 per cent for both Indian and Bangladeshi MFIs
  • 53.
    5. Revenue andExpenses • Indian MFIs generate revenue from both the Gross loan portfolio and Investment at a higher rate than that of Bangladesh MFIs. • Profit margin of Bangladeshi MFIs is found to be better than Indian MFIs. The total expense and financial expense have been higher for Indian MFIs when compared to those of Bangladeshi MFIs which reveal that Bangladeshi MFIs concentrate on cost management practices. • The provision for loan impairment/assets and operating expense/assets have been greater for Bangladeshi MFIs and lower for Indian MFIs. The increase in operating expense may be due to expense incurred to educate the borrowers.
  • 54.
    6. Efficiency • Theoperating efficiency is satisfactory in both Indian and Bangladeshi MFIs as they have maintained the operating expenses ratio at appropriate level of less than 20 per cent as prescribed by Sa-Dhan. • The increase in loans per staff member and personnel allocation ratio of Indian MFIs indicates the efficiency of MFI staff, as they handle comparatively more borrowers. 7. Risk and Liquidity • Indian MFIs portfolio at risk is highly covered by the MFIs’ Impairment loss allowance when compared to that of Bangladeshi MFIs. • Bangladeshi MFIs have better liquidity, whereas, Indian MFIs have high risk coverage .
  • 55.
    TOP AND BOTTOMPERFORMERS - INDICATORWISE INDICATORS INDIA BANGLADESH High Assets SKS GRAMEEN BANK Less Assets BJS CTS Highly Leveraged NCS SKS Low Leveraged SKS CTS Highest Gross Loan Portfolio to Total Assets SPANDANA CSS Lowest Gross Loan Portfolio to Total Assets SEWA GRAMEEN BANK More Number of Active Borrowers SKS GRAMEEN BANK Less Number of Active Borrowers NCS BASTOB Highest Average Loan Balance Per Borrower SEWA CDIP Lowest Average Loan Balance Per Borrower SARALA RDRS
  • 56.
    (CONTD …) INDICATORS INDIABANGLADESH Highest Average Loan Balance Per Borrower / GNI Per Capita SARALA RDRS Lowest Average Loan Balance Per Borrower / GNI Per Capita SEWA CDIP Highest Average Outstanding Balance SARALA CTS Lowest Average Outstanding Balance SAROVADAYA CDIP 100% Operational Self Sufficiency BISWA IDF Highest Financial Revenue/Assets MAHASEMAM BRAC Lowest Financial Revenue/Assets HiH COAST TRUST Highest Profit Margin SWAWS ASA Lowest Profit Margin SMSS PMUK
  • 57.
    (CONTD . ..) INDICATORS INDIA BANGLADESH Highest Yield on Gross portfolio (Nominal) MAHASEMAM BURO BANGLADESH Highest Financial Expenses/Assets SEWA BANK CSS Lowest Financial Expenses/Assets NCS GRAMEEN BANK Highest Total Expense/Assets SEWA BANK ASA Lowest Total Expense/Assets SWADHAR PMUK Highest Provision for Loan Impairment BWDA CDIP Lowest Provision for Loan Impairment TRIDENT PMUK Highest Operating Expense/Assets SARVODAYA GRAMEEN BANK Lowest Operating Expense/Assets SWADHAR CTS Highest Operating Expense/ Loan Portfolio SARVODAYA GRAMEEN BANK Lowest Operating Expense/ Loan Portfolio SWADHAR CSS
  • 58.
    (CONTD . ..) INDICATORS INDIA BANGLADESH Highest Average salary/GNI per Capita CCFID CTS Lowest Average salary/GNI per Capita SEWA BANK BRAC Highest Cost Per Borrower SARVODAYA RDRS Lowest Cost Per Borrower SWADHAR DSK Highest Loans per Staff Member SANGAMITRA GRAMEEN BANk Lowest Loans per Staff Member HiH CTS Highest Personnel Allocation Ratio SARVODAYA IDF Lowest Personnel Allocation Ratio SEWA BANK RIC Highest Portfolio at Risk ASIRVAD CDIP Lowest Portfolio at Risk SEWA BANK RRF Highest Risk Coverage GRAMA VIDIYAL CDIP Lowest Risk Coverage SMSS BEES Highest Non Earning liquid assets SARALA CTS Lowest Non Earning liquid assets HiH GRAMEEN BANK
  • 59.
    PERFORMERS BASED ONOVERALL SCORE PERFORMER INDIA BANGLADESH TOP BANDHAN ASA SARALA CDIP SMILE RDRS MODERATE CASHPOR MC HEED NBJK WAVE SHARE SAJIDA BOTTOM NCS COAST TRUST HiH PMUK SWADHAR BEES
  • 60.
    Cross Country Variation •Both Indian and Bangladeshi MFIs have shown similar performance - profit margin, total expense by assets and risk coverage, over the study period. • The ALBPB/GNI per capita, AOB, FE/A, PLI/A, OE/A, OE/LP and PAR > 90 days have revealed a significant variation in performance among Indian and Bangladeshi MFIs’ along with interaction of the years and countries. • The MFIs of two countries have experienced a pertinent difference in the AS/GNI per capita, whereas, the study period has witnessed a vital difference in DER, GLP to TA, ALBPB, FR/A, YGPN, CPB, PeAR, NELA as a % of TA. • ROA, ROE and OSS has shown a significant variation and interaction effect between years and countries.
  • 61.
    NEW YOUNG MATURE •Capital to asset ratio • Debt to equity ratio • Gross loan portfolio to total assets • Average outstanding balance • Financial revenue to assets • Yield on gross portfolio (nominal) • Personnel allocation ratio • Portfolio at risk greater than 90 days • Non-earning liquid assets as a per cent of total assets. • Average loan balance to GNI per capita • Return on equity • Provision for loan impairment to assets • Average salary to GNI per capita. • Assets • Number of active borrowers • Average loan balance per borrower • Return on assets • Operational self- sufficiency • Profit margin • Financial expense to assets • Operating expense/assets • Operating expense to loan portfolio, cost per borrower • Loan per staff member • Risk coverage AGEWISE PERFORMANCE
  • 62.
    INDICATORS MATURE REGULATED NBFC& NGO NGO & NGO LARGE OUTREACH OVERALL India Bangladesh India Bangladesh India Bangladesh India Bangladesh India Bangladesh India Bangladesh Assets √ √ √ √ √ √ CAR √ √ √ √ √ √ DER √ √ √ √ √ √ GLP/TA √ √ √ √ √ √ NAB √ √ √ √ √ √ ALBPB √ √ √ √ √ √ ALBPB/GNI √ √ √ √ √ √ AOB √ √ √ √ √ √ ROA √ √ √ √ √ √ ROE √ √ √ √ √ √ OSS √ √ √ √ √ √ FR/A √ √ √ √ √ √ PM √ √ √ √ √ √ YGP(N) √ √ √ √ √ √ TE/A √ √ √ √ √ √ FE/A √ √ √ √ √ √ PLI/A √ √ √ √ √ √ OE/A √ √ √ √ √ √ OE/LP √ √ √ √ √ √ AS/GNI √ √ √ √ √ √ CPB √ √ √ √ √ √ LPSM √ √ √ √ √ √ PeAR √ √ √ √ √ √ PAR √ √ √ √ √ √ RC √ √ √ √ √ √ NELA as % of TA √ √ √ √ √ √
  • 63.
    Discriminating variables: Indian MFIshave shown better performance in the variables, namely, • average loan balance per borrower/GNI per capita • average salary/GNI per capita • loans per staff member • average loan balance per borrower Bangladesh MFIs have performed better in only • financial expense/assets
  • 64.
    General Hypothesis –Accepted/Rejected It is found that though the MFIs in Bangladesh is mature because of its early origin, Indian MFIs seems to have better performance even with the New, Young and Mature MFIs. The MFIs in India and Bangladesh differ in their performance during the study period. Hence, the general hypothesis that ‘Performance of MFIs is similar irrespective of the country they belong to’ is disproved. The financial performance of Mature MFIs, Regulated MFIs, NBFC MFIs, NGO MFIs and MFIs with large outreach of India reveals a better and welcoming performance when compared with that of corresponding MFIs in Bangladesh. Thus, it is found that both financial and non-financial (status) factors are important for the sustenance of MFIs, thereby, the general hypothesis that ‘Performance of MFIs depends only on financial factors’ is not accepted.
  • 65.
    From the studyit is vivid that age is an important factor in the performance of MFIs. Among the age groups, Mature MFIs have shown better performance in terms of breadth of outreach; profitability in terms of return on assets and operational self-sufficiency; revenue in terms of profit margin; expenses in terms of total expense to assets and financial expense to assets; efficiency in terms of operating expense to loan portfolio and cost per borrower and loan per staff member; and risk in terms of risk coverage. Thus, the general hypothesis that ‘Age is not an important criterion for sustenance’ is not approved.
  • 66.
    SUGGESTIONS India • Government cantake measures to give financial Institutional status (status of Bank) based on the consistent performance of MFIs (to those who qualify the conditions) • Government can drive the machinery to inculcate the concept of MFIs in the minds of public and to strengthen the performance of MFIs. • The geographical population is dense in Northern region, while the clientele base expansion of MFIs is strong in south. Government should take initiative to increase the number MFIs in northern region. • Reporting norms should be made uniform and mandatory for all MFIs both at regional and global level. • Websites exclusively for MFIs in India can be launched revealing transparent information.
  • 67.
    • RBI canset up regulatory authority to monitor the performance of MFIs. Though the MFIs follow the norms and standards set by RBI, a separate regulatory authority would more efficiently monitor performance of MFIs. Similar practice can be followed in those countries where the information availability is limited. • MFIs in India should focus more on the cost management, to improve their performance. • MFIs should gain public confidence through their effective performance and service to the beneficiaries so that financial crisis or distress can be avoided. They can adopt corporate governance concept in their functioning. • MFIs in India can become sustainable through efficient asset management, cost management and leverage management. Leverage management can be effective with well-maintained capital asset ratio and debt equity ratio within the limit fixed by the apex bodies.
  • 68.
    Bangladesh 1. The predominantfocus of Bangladeshi MFIs should be on the earnings management of MFIs to improve the performance. 2. Bangladesh can take effective measures to increase the number of active borrowers by providing fruitful services. 3. MFIs in Bangladesh can concentrate on asset management, cost management and leverage management to attain sustainability. 4. MFIs in Bangladesh should report the financial details on line with transparency. 5. Mutual exchange of information and technology to be adopted for economic development can be encouraged. 6. The concept of corporate governance can be adopted by MFIs.
  • 69.
    Conclusion Overall, MFIs inIndia and Bangladesh are dynamic and growing and, therefore, the journey of MFIs has been encouraging in both the countries. Although the microfinance sector has reported an impressive growth, sufficient regulatory and governance would help achieve the goal of poverty alleviation, empowerment and financial inclusion and this could be achieved with combined cooperation of banks, donors’ government, NGO and other players in the country. Technological innovations, product requirements, and ongoing efforts to strengthen the capacity of MFIs are needed to reduce costs, increase outreach and boost overall profitability. Several Indian NGO MFIs are converting themselves into NBFC MFIs; thereby they are able to raise their capital base. In case of Bangladesh, NBFC MFIs are not operational and therefore, they have limited scope to increase their capital base. On comparison of the financial performance of MFIs during the study period it is evident that the Indian MFIs stand better than the MFIs of Bangladesh in many aspects, though Bangladesh is the place of origin for the concept of microfinance and Microfinance Institutions.
  • 70.
    SIGNIFICANCE OF THESTUDY The study will be useful to: • The MFIs, for knowing their performance and taking appropriate decisions; to motivate MFIs towards performance improvement, and compare with their peers, • The donor, to decide the extent of support to be given to its partner and to know the level of sustainability of its partners, • Investors, to identify potential investment, • The researchers and academicians and • The policy makers for their national development decisions.
  • 71.