Download as PDF, PPTX


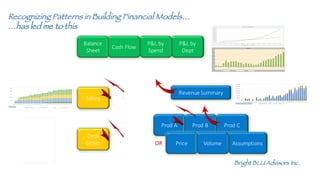
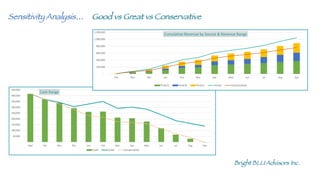


The document discusses the evolution of financial models for CEOs navigating high growth, emphasizing the importance of telling a compelling business story supported by numbers. It highlights various components such as cash flow, revenue projections, and cost management while using visual data to illustrate revenue vs expenses and cash forecasts. Overall, it promotes the idea of using sensitivity analysis to assess different financial scenarios and improve decision-making.