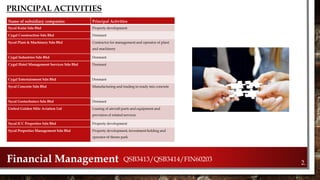
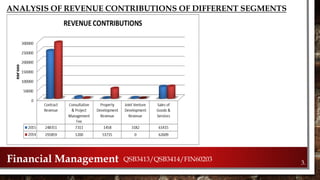
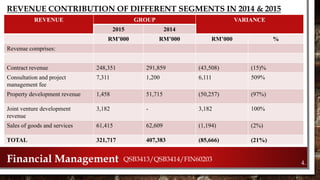
SlideShare a Scribd company logo
1 of 25
1.Financial Management QSB3413/QSB3414/FIN60203
ABOUT THE COMPANY
Sycal Venture Berhad (Group)
 Established since 1980
 Public Limited Liability Company
 Listed on the main board of Bursa Malaysia on the 29th March 1995
 Core Businesses
 Construction and Infrastructure
 Property Development
 Hotels and Resorts
2.Financial Management QSB3413/QSB3414/FIN60203
PRINCIPAL ACTIVITIES
Name of subsidiary companies Principal Activities
Sycal Kulai Sdn Bhd Property development
Cygal Construction Sdn Bhd Dormant
Sycal Plant & Machinery Sdn Bhd Contractor for management and operator of plant
and machinery
Cygal Industries Sdn Bhd Dormant
Cygal Hotel Management Services Sdn Bhd Dormant
Cygal Entertainment Sdn Bhd Dormant
Sycal Concrete Sdn Bhd Manufacturing and trading in ready mix concrete
Sycal Geotechniecs Sdn Bhd Dormant
United Golden Mile Aviation Ltd Leasing of aircraft parts and equipment and
provision of related services
Sycal ICC Properties Sdn Bhd Property development
Sycal Properties Management Sdn Bhd Property development, investment holding and
operator of theme park
ANALYSIS OF REVENUE CONTRIBUTIONS OF DIFFERENT SEGMENTS
3.Financial Management QSB3413/QSB3414/FIN60203
REVENUE CONTRIBUTION OF DIFFERENT SEGMENTS IN 2014 & 2015
REVENUE GROUP VARIANCE
2015 2014
RM’000 RM’000 RM’000 %
Revenue comprises:
Contract revenue 248,351 291,859 (43,508) (15)%
Consultation and project
management fee
7,311 1,200 6,111 509%
Property development revenue 1,458 51,715 (50,257) (97%)
Joint venture development
revenue
3,182 - 3,182 100%
Sales of goods and services 61,415 62,609 (1,194) (2%)
TOTAL 321,717 407,383 (85,666) (21%)
4.Financial Management QSB3413/QSB3414/FIN60203
CURRENT STATE OF MAJOR INDUSTRY OF SYCAL BERHAD
 CURRENTLY FACING THE CHALLENGES OF ECONOMIC SLOWDOWN.
 ECONOMIC GROWTH IS EXPECTED TO SLUGGISH FROM 4.7% TO 4.5% IN ONE YEAR PERIOD.
 THE HOUSING MARKET ECONOMIST PREDICTED THE NUMBER OF SALES FOR HOUSING MARKET WILL
ATTAIN BETWEEN 190,000 AND 210,000.
 HOUSE PRICE INDEX- RISE IN BETWEEN 3.5% & 5.5%.
 GDV- GROW BY 2% IN 2016.
 OVERALL, SYCAL BERHAD IS COMPETENT TO KEEP PROFITABLE.
5.Financial Management QSB3413/QSB3414/FIN60203
6.Financial Management QSB3413/QSB3414/FIN60203
STRENGTHS
 Awarded the Bureau Veritas Certification, ISO 9001:2008
 Requirements of the management system standards
 Handful of Completed Projects
 Segmentations of Services
 Services by different subsidiaries
WEAKNESSES
 Diversification
 Into Hotels & Resorts
 Affects by Economic Downturn
7.Financial Management QSB3413/QSB3414/FIN60203
STRATEGIC PLANS TO SEIZE OPPORTUNITIES
 Planned Developments in developing areas
 Potential GDV of RM 1.2 billion
 Expand one of their core business
 Hotels & Resorts segment
CHALLENGES
 Global financial crisis
 Goods and Service Tax issue
 Comply with stringent regulations
 Threats of increased interest rates
 Stringent lending policies by bank
 Ability to fund its projects
8.Financial Management QSB3413/QSB3414/FIN60203
MAJOR CAPITALS
Last three years
Year 2013
• Purchased RM 7,245,000 of property, plant and equipment
• As well as RM 63,000 in other investments
Year 2014
• Purchased RM 15,371,000 of property, plant and equipment
• As well as RM 63,000 in other investments
Year 2015
• Purchased RM 16,882,000 of property, plant and equipment
• As well as RM 63,000 in other investments
SOURCE OF FUNDINGS
 Bank borrowings of RM 62,578,000 and RM 60,345,000 in the year 2014
and 2015 respectively
EVALUATING THE COMPANY’S CASH FLOW
9.Financial Management QSB3413/QSB3414/FIN60203
Company’s Cash Flow
Statement Year
2011 2012 2013 2014 2015
Total of Cash and Cash
Equivalents (RM)
611,000 485,000 2,270,000 8,340,000 (4,260,000)
Differences (RM) - (126,000) 1,785,000 6,070,000 (12,600,000)
THE COMPANY’S MAJOR CASH FLOW
10.Financial Management QSB3413/QSB3414/FIN60203
THE COMPANY’S MAJOR CASH FLOW (CONT’D)
11.Financial Management QSB3413/QSB3414/FIN60203
Net cash decrease by RM 4,260,000 in 2015 while in 2014 the net cash increase is RM 8,340,000
which is higher than net cash in 2015
THE COMPANY’S CASH AND CASH EQUIVALENT
12.Financial Management QSB3413/QSB3414/FIN60203
THE COMPANY’S FREE CASH FLOW
 WHAT IS FCF (FREE CASH FLOW)?
 A MEASUREMENT OF FINANCE PERFORMANCE
 HOW TO CALCULATES FCF?
 USING THE COMPANY’S OCF – CAPEX = FCF
Financial Management QSB3413/QSB3414/FIN60203
13.
Year 2011 RM
Net Operating
Activities
1,436,000
Total Investment (908,000)
Total FCF 528,000
Year 2012 RM
Net Operating
Activities
21,420,000
Total Investment (40,000)
Total FCF 21,380,000
Year 2013 RM
Net Operating
Activities
(14,148,000)
Total Investment (407,000)
Total FCF (14,555,000)
Year 2014 RM
Net Operating Activities (41,770,000)
Total Investment (1,401,000)
Total FCF (43,171,000)
Year 2015 RM
Net Operating Activities (426,000)
Total Investment (1,473,000)
Total FCF (1,473,000)
THE COMPANY’S FREE CASH FLOW
Financial Management QSB3413/QSB3414/FIN60203
14.
Year of Company’s Free Cash Flow (FCF) Total in RM
31st of March 2011 528,000
31st of March 2012 21,380,000
31st of March 2013 (14,555,000)
31st of March 2014 (43,171,000)
31st of March 2015 (1,473,000)
Total Free Cash Flow in 5 Years (34,291)
Financial Management QSB3413/QSB3414/FIN60203
THE COMPANY’S FREE CASH FLOW
15.
COMPANY’S FINANCIAL PERFORMANCE
Financial Management QSB3413/QSB3414/FIN60203
2015 2014 2013 2012 2011
a. Current Ratio
current assets
current liabilities
434,729,000
225,848,000
= 1.92
443,676,000
224,002,000
= 1.98
328,261,000
211,296,000
= 1.55
192,754,000
132,343,000
= 1.46
190,409,000
113,703,000
= 1.67
b. Quick Ratio
cash+accounts receivable
current liabilities
5,205,000+
173,076,000
225,848,000
= 0.79
9,720,000+
172,333,000
224,002,000
= 0.81
3,529,000+
160,551,000
211,296,000
= 0.78
2,425,000+
36,812,000
132,343,000
= 0.30
1,199,000+
51,329,000
113,703,000
= 0.46
i. Liquidity
16.
Financial Management QSB3413/QSB3414/FIN60203
17.
COMPANY’S FINANCIAL PERFORMANCE
ii. Activity
2015 2014 2013 2012 2011
a. Inventory turnover
Cost of goods sold
Inventory
280,540,000
19,932,000
=14.07x
363,933,000
19,811,000
=18.37x
260,573,000
6,589,000
=39.55x
148,907,000
8,161,000
=18.25x
83,241,000
7,789,000
=10.69x
b. Average collection
period
Accounts receivables
Daily credit sales
189,939,000
297,652,000 x 365
=233.6 days
176,130,000
384,514,000 x 365
=167.4 days
112,942,000
272,125,000 x 365
=151.5 days
51,522,000
157,327,000 x 365
=119.5 days
48,676,000
89,006,000 x 365
=199.6 days
c. Total asset turnover
Sales
Total assets
321,717,000
434,729,000
=0.74x
407,383,000
443,676,000
=0.92x
292,327,000
328,261,000
=0.89x
169,406,000
192,754,000
=0.88x
100,131,000
190,409,000
=0.53x
COMPANY’S FINANCIAL PERFORMANCE
iii. Debt
Financial Management QSB3413/QSB3414/FIN60203
18.
2015 2014 2013 2012 2011
a. Debt Ratio
Total liabilities
Total assets
286,193,000
528,225,000
=0.54
286,580,000
511,862,000
=0.56
215,311,000
405,161,000
=0.53
142,879,000
315,140,000
=0.45
128,539,000
291,673,000
=0.44
b. Debt to Equity
Total liabilities
Common stock equity
286,193,000
242,032,000
=1.18
286,580,000
225,282,000
=1.27
215,311,000
189,850,000
=1.13
142,879,000
172,261,000
=0.83
128,539,000
163,134,000
=0.79
c. Interest cover ratio
Operating profits
Interest expense
24,603,000
1,593,000
=15.44
29,195,000
1,480,000
=19.73
20,427,000
228,000
=89.59
12,748,000
917,000
=13.90
6,927,000
1,876,000
=3.69
COMPANY’S FINANCIAL PERFORMANCE
iv. Profitability
Financial Management QSB3413/QSB3414/FIN60203
19.
2015 2014 2013 2012 2011
a. Gross Profit Margin
Gross profit
Revenue
41,177,000
321,717,000
=0.13
43,450,000
407,383,000
=0.11
31,754,000
292,327,000
=0.11
20,499,000
169,406,000
=0.12
16,890,000
87,322,000
=0.19
b. Return on Assets
Net income
Total assets x 100%
18,452,000
528,225,000 x 100%
=3.49%
35,804,000
511,862,000 x 100%
=6.99%
17,977,000
405,161,000 x 100%
4.44%
8,936,000
315,140,000 x 100%
=2.84%
5,200,000
291,673,000 x 100%
=1.78%
c. Return on Equity
Net income
Shareholders’ equity x 100%
18,452,000
238,203,000 x 100%
=7.75%
35,804,000
222,312,000 x 100%
=16.11%
17,977,000
187,685,000 x 100%
9.58%
8,936,000
170,641,000 x 100%
=5.24%
5,200,000
161,543,000 x 100%
=3.22%
COMPANY’S FINANCIAL PERFORMANCE
v. Market Performance
Financial Management QSB3413/QSB3414/FIN60203
20.
2015 2014 2013 2012 2011
a. Earnings per Share
Net income
Total outstanding
common shares
17,293,000
320,250,000
=0.05
34,999,000
320,250,000
=0.11
17,432,000
320,250,000
=0.06
8,907,000
288,256,000
=0.03
5,056,000
251,959,000
=0.02
b. Price / Earnings
Market value per share
Earnings per share
0.41
0.05
=8.20
0.33
0.11
=3.00
0.28
0.06
=4.67
0.18
0.03
=6.00
0.20
0.02
=10.00
c. Price / Book Ratio
Market value per share
Equity book value /
share
0.41
0.74
=0.55
0.33
0.69
=0.48
0.28
0.59
=0.47
0.18
0.59
=0.31
0.20
0.64
=0.31
Financial Management QSB3413/QSB3414/FIN60203
FORECAST REVENUE GROWTH
2015 2016
RM'000
% of
Revenue RM'000
Revenue 321,717 100.0% 341,020
Cost of Sales (280,540) -87.2% (297,372)
Gross Profit 41,177 12.8% 43,648
Other Operation Income 6,426 2.0% 6,812
47,603 14.8% 50,459
Administration Expenses (10,854) -3.4% (11,505)
Other Operating Expenses (13,211) -4.1% (14,004)
Profit/(Loss) From Operations 23,538 7.3% 24,950
Finance Costs (1,727) -0.5% (1,831)
Profit/(Loss) Before Taxation 21,811 6.8% 23,120
Taxation (3,359) -1.0% (3,561)
Profit/(Loss) For the Year 18,452 5.7% 19,559
Other Comprehensive Income (1,402) -0.4% (1,486)
Total Comprehensive Income/(Loss) for
the Year
17,050 5.3% 18,073
21.
Financial Management QSB3413/QSB3414/FIN60203
REQUIRED NEW FUNDS
)1()()( 2
11
DPSS
S
L
S
S
A
RNF 
- This shows that the company does not require any new funds to achieve this sales growth
A/S = Percentage relationship of variable assets to sales
S = Change in sales
L/S = Percentage relationship of variables liabilities to sales
P = Profit margin
S2 = New sales level
D = Dividend payout ratio
22.
CONCLUSIONS & RECOMMENDATIONS
23.Financial Management QSB3413/QSB3414/FIN60203
 Worsening performance in the year ended 2015
 Attributed to the downturn in economy
 Diversify its revenue streams or investments
 Utilisation of assets
Financial Management QSB3413/QSB3414/FIN60203
“Enjoy little things in life, because one day you will look back, and realize they were the big things.” – Barrack Obama

More Related Content

What's hot

Golar LNG Partners Q3 2012 results presentation
Golar LNG Partners Q3 2012 results presentationGolar LNG Partners Q3 2012 results presentation
Golar LNG Partners Q3 2012 results presentationTradeWindsnews
 
Stanbic IBTC annual report 2017
Stanbic IBTC annual report 2017Stanbic IBTC annual report 2017
Stanbic IBTC annual report 2017Michael Olafusi
 
Cai audited fsfye 09-30-11
Cai audited fsfye 09-30-11Cai audited fsfye 09-30-11
Cai audited fsfye 09-30-11Byliner1
 

What's hot (6)

Accting Final Project
Accting Final ProjectAccting Final Project
Accting Final Project
 
Golar LNG Partners Q3 2012 results presentation
Golar LNG Partners Q3 2012 results presentationGolar LNG Partners Q3 2012 results presentation
Golar LNG Partners Q3 2012 results presentation
 
shivakumarshilpi[13_0]-1
shivakumarshilpi[13_0]-1shivakumarshilpi[13_0]-1
shivakumarshilpi[13_0]-1
 
Stanbic IBTC annual report 2017
Stanbic IBTC annual report 2017Stanbic IBTC annual report 2017
Stanbic IBTC annual report 2017
 
Cai audited fsfye 09-30-11
Cai audited fsfye 09-30-11Cai audited fsfye 09-30-11
Cai audited fsfye 09-30-11
 
Project Finance management assignment
Project Finance management assignmentProject Finance management assignment
Project Finance management assignment
 

Viewers also liked (20)

Psychology report
Psychology reportPsychology report
Psychology report
 
ENBE Infographic poster
ENBE Infographic posterENBE Infographic poster
ENBE Infographic poster
 
Idea Journal 01
Idea Journal 01Idea Journal 01
Idea Journal 01
 
TJ 04
TJ 04TJ 04
TJ 04
 
Game Tournament
Game TournamentGame Tournament
Game Tournament
 
TJ 03
TJ 03TJ 03
TJ 03
 
Journal1
Journal1Journal1
Journal1
 
Measurement 3 assignment
Measurement 3 assignmentMeasurement 3 assignment
Measurement 3 assignment
 
ENBE- Future City
ENBE- Future CityENBE- Future City
ENBE- Future City
 
Site Visit
Site VisitSite Visit
Site Visit
 
Presentation enbe final projects 1
Presentation enbe final projects 1Presentation enbe final projects 1
Presentation enbe final projects 1
 
Psychology presentation
Psychology presentationPsychology presentation
Psychology presentation
 
IDJ 4
IDJ 4IDJ 4
IDJ 4
 
Symbiotic relationship in nature
Symbiotic relationship in natureSymbiotic relationship in nature
Symbiotic relationship in nature
 
Journal2
Journal2Journal2
Journal2
 
IDJ Super Hero
IDJ Super HeroIDJ Super Hero
IDJ Super Hero
 
Creative Thinking Skills Project 1
Creative Thinking Skills Project 1Creative Thinking Skills Project 1
Creative Thinking Skills Project 1
 
Tj
TjTj
Tj
 
IDJ 5
IDJ 5IDJ 5
IDJ 5
 
Management science
Management scienceManagement science
Management science
 

Similar to Financial Management Group Presentation Slides

Financial Management
Financial ManagementFinancial Management
Financial ManagementIshka Rogbeer
 
FinancialAnalysisReport
FinancialAnalysisReportFinancialAnalysisReport
FinancialAnalysisReportSagar Dhabalia
 
InKnowVision June 2012 HNW Technical Webinar 2 - Valuation Planning
InKnowVision June 2012 HNW Technical Webinar 2 - Valuation PlanningInKnowVision June 2012 HNW Technical Webinar 2 - Valuation Planning
InKnowVision June 2012 HNW Technical Webinar 2 - Valuation PlanningInKnowVision
 
Bharti airtel-annual-report-2012
Bharti airtel-annual-report-2012Bharti airtel-annual-report-2012
Bharti airtel-annual-report-2012prasoonster
 
Acc spritzer
Acc spritzerAcc spritzer
Acc spritzerdhirazain
 
Financial Ratio Analysis
Financial Ratio AnalysisFinancial Ratio Analysis
Financial Ratio Analysis_NabilaHanim
 
Project Final Presentation By Nigah-e-Nazar
Project Final Presentation By Nigah-e-NazarProject Final Presentation By Nigah-e-Nazar
Project Final Presentation By Nigah-e-NazarProdential ruls
 
Project final presentation by nigah e-nazar
Project final presentation by nigah e-nazarProject final presentation by nigah e-nazar
Project final presentation by nigah e-nazarProdential ruls
 
Financial Analysis and Financial Statements 2009
Financial Analysis and Financial Statements 2009Financial Analysis and Financial Statements 2009
Financial Analysis and Financial Statements 2009Petrobras
 
DO-PONT & CASH FLOW ANALYSIS OF J P ASSOCIATES
DO-PONT & CASH FLOW ANALYSIS OF J P ASSOCIATESDO-PONT & CASH FLOW ANALYSIS OF J P ASSOCIATES
DO-PONT & CASH FLOW ANALYSIS OF J P ASSOCIATESSandeep Patel
 
Project & Presentation By Lucky Cement Company With 7 Habits of Highly Effect...
Project & Presentation By Lucky Cement Company With 7 Habits of Highly Effect...Project & Presentation By Lucky Cement Company With 7 Habits of Highly Effect...
Project & Presentation By Lucky Cement Company With 7 Habits of Highly Effect...manobili17
 
Telkomsel Financial Performance
Telkomsel Financial PerformanceTelkomsel Financial Performance
Telkomsel Financial Performancezaidmuttaqien
 
My Business Project (INVERSE)
My Business Project (INVERSE)My Business Project (INVERSE)
My Business Project (INVERSE)rifasimponi
 
Presentation Accounting.pptx
Presentation Accounting.pptxPresentation Accounting.pptx
Presentation Accounting.pptxConsentQUEEN
 
2013 Full Year Results Snam
2013 Full Year Results Snam2013 Full Year Results Snam
2013 Full Year Results SnamSnam
 

Similar to Financial Management Group Presentation Slides (20)

Bata 1st-qtr-2019
Bata 1st-qtr-2019Bata 1st-qtr-2019
Bata 1st-qtr-2019
 
Financial Management
Financial ManagementFinancial Management
Financial Management
 
Investment Appraisal
Investment AppraisalInvestment Appraisal
Investment Appraisal
 
Hdbfm assignment group 06(2)
Hdbfm assignment   group 06(2)Hdbfm assignment   group 06(2)
Hdbfm assignment group 06(2)
 
FinancialAnalysisReport
FinancialAnalysisReportFinancialAnalysisReport
FinancialAnalysisReport
 
BHARTI AIRTEL PPT
BHARTI AIRTEL PPTBHARTI AIRTEL PPT
BHARTI AIRTEL PPT
 
InKnowVision June 2012 HNW Technical Webinar 2 - Valuation Planning
InKnowVision June 2012 HNW Technical Webinar 2 - Valuation PlanningInKnowVision June 2012 HNW Technical Webinar 2 - Valuation Planning
InKnowVision June 2012 HNW Technical Webinar 2 - Valuation Planning
 
Bharti airtel-annual-report-2012
Bharti airtel-annual-report-2012Bharti airtel-annual-report-2012
Bharti airtel-annual-report-2012
 
Acc spritzer
Acc spritzerAcc spritzer
Acc spritzer
 
Financial Ratio Analysis
Financial Ratio AnalysisFinancial Ratio Analysis
Financial Ratio Analysis
 
Project Final Presentation By Nigah-e-Nazar
Project Final Presentation By Nigah-e-NazarProject Final Presentation By Nigah-e-Nazar
Project Final Presentation By Nigah-e-Nazar
 
Project final presentation by nigah e-nazar
Project final presentation by nigah e-nazarProject final presentation by nigah e-nazar
Project final presentation by nigah e-nazar
 
Alkesh parihar fm
Alkesh parihar fmAlkesh parihar fm
Alkesh parihar fm
 
Financial Analysis and Financial Statements 2009
Financial Analysis and Financial Statements 2009Financial Analysis and Financial Statements 2009
Financial Analysis and Financial Statements 2009
 
DO-PONT & CASH FLOW ANALYSIS OF J P ASSOCIATES
DO-PONT & CASH FLOW ANALYSIS OF J P ASSOCIATESDO-PONT & CASH FLOW ANALYSIS OF J P ASSOCIATES
DO-PONT & CASH FLOW ANALYSIS OF J P ASSOCIATES
 
Project & Presentation By Lucky Cement Company With 7 Habits of Highly Effect...
Project & Presentation By Lucky Cement Company With 7 Habits of Highly Effect...Project & Presentation By Lucky Cement Company With 7 Habits of Highly Effect...
Project & Presentation By Lucky Cement Company With 7 Habits of Highly Effect...
 
Telkomsel Financial Performance
Telkomsel Financial PerformanceTelkomsel Financial Performance
Telkomsel Financial Performance
 
My Business Project (INVERSE)
My Business Project (INVERSE)My Business Project (INVERSE)
My Business Project (INVERSE)
 
Presentation Accounting.pptx
Presentation Accounting.pptxPresentation Accounting.pptx
Presentation Accounting.pptx
 
2013 Full Year Results Snam
2013 Full Year Results Snam2013 Full Year Results Snam
2013 Full Year Results Snam
 

More from Melvin Lim

PM Final Assignment Report
PM Final Assignment ReportPM Final Assignment Report
PM Final Assignment ReportMelvin Lim
 
Sydney Opera House
Sydney Opera HouseSydney Opera House
Sydney Opera HouseMelvin Lim
 
VM Final Report
VM Final ReportVM Final Report
VM Final ReportMelvin Lim
 
VM Final Presentation Slide
VM Final Presentation SlideVM Final Presentation Slide
VM Final Presentation SlideMelvin Lim
 
CL Final Report
CL Final ReportCL Final Report
CL Final ReportMelvin Lim
 
Seminar Presentation Slides (Chapter 2)
Seminar Presentation Slides (Chapter 2)Seminar Presentation Slides (Chapter 2)
Seminar Presentation Slides (Chapter 2)Melvin Lim
 
DE/BE Workshop Presentation Slides
DE/BE Workshop Presentation SlidesDE/BE Workshop Presentation Slides
DE/BE Workshop Presentation SlidesMelvin Lim
 
Community Service Individual Report
Community Service Individual ReportCommunity Service Individual Report
Community Service Individual ReportMelvin Lim
 
A Case Study based on FIDIC and PAM Form 2006
A Case Study based on FIDIC and PAM Form 2006A Case Study based on FIDIC and PAM Form 2006
A Case Study based on FIDIC and PAM Form 2006Melvin Lim
 
Building Economics Group Presentation Slides
Building Economics Group Presentation SlidesBuilding Economics Group Presentation Slides
Building Economics Group Presentation SlidesMelvin Lim
 
Professional Practice 1 Assignment
Professional Practice 1 AssignmentProfessional Practice 1 Assignment
Professional Practice 1 AssignmentMelvin Lim
 
Lack of understanding and awareness
Lack of understanding and awarenessLack of understanding and awareness
Lack of understanding and awarenessMelvin Lim
 
Building Services 1 Report
Building Services 1 ReportBuilding Services 1 Report
Building Services 1 ReportMelvin Lim
 
Building Services - Efficient Energy Ventilation System
Building Services - Efficient Energy Ventilation SystemBuilding Services - Efficient Energy Ventilation System
Building Services - Efficient Energy Ventilation SystemMelvin Lim
 
Construction Technology Assignment
Construction Technology AssignmentConstruction Technology Assignment
Construction Technology AssignmentMelvin Lim
 
Building Material (Library Site report)
Building Material (Library Site report)Building Material (Library Site report)
Building Material (Library Site report)Melvin Lim
 
Building Material (Concrete)
Building Material (Concrete) Building Material (Concrete)
Building Material (Concrete) Melvin Lim
 

More from Melvin Lim (20)

PM Final Assignment Report
PM Final Assignment ReportPM Final Assignment Report
PM Final Assignment Report
 
Sydney Opera House
Sydney Opera HouseSydney Opera House
Sydney Opera House
 
VM Final Report
VM Final ReportVM Final Report
VM Final Report
 
VM Final Presentation Slide
VM Final Presentation SlideVM Final Presentation Slide
VM Final Presentation Slide
 
CL Final Report
CL Final ReportCL Final Report
CL Final Report
 
Seminar Presentation Slides (Chapter 2)
Seminar Presentation Slides (Chapter 2)Seminar Presentation Slides (Chapter 2)
Seminar Presentation Slides (Chapter 2)
 
DE/BE Workshop Presentation Slides
DE/BE Workshop Presentation SlidesDE/BE Workshop Presentation Slides
DE/BE Workshop Presentation Slides
 
Community Service Individual Report
Community Service Individual ReportCommunity Service Individual Report
Community Service Individual Report
 
A Case Study based on FIDIC and PAM Form 2006
A Case Study based on FIDIC and PAM Form 2006A Case Study based on FIDIC and PAM Form 2006
A Case Study based on FIDIC and PAM Form 2006
 
Building Economics Group Presentation Slides
Building Economics Group Presentation SlidesBuilding Economics Group Presentation Slides
Building Economics Group Presentation Slides
 
Professional Practice 1 Assignment
Professional Practice 1 AssignmentProfessional Practice 1 Assignment
Professional Practice 1 Assignment
 
Lack of understanding and awareness
Lack of understanding and awarenessLack of understanding and awareness
Lack of understanding and awareness
 
Fieldwork 2
Fieldwork 2 Fieldwork 2
Fieldwork 2
 
Fieldwork 1
Fieldwork 1Fieldwork 1
Fieldwork 1
 
Building Services 1 Report
Building Services 1 ReportBuilding Services 1 Report
Building Services 1 Report
 
Building Services - Efficient Energy Ventilation System
Building Services - Efficient Energy Ventilation SystemBuilding Services - Efficient Energy Ventilation System
Building Services - Efficient Energy Ventilation System
 
Site report
Site reportSite report
Site report
 
Construction Technology Assignment
Construction Technology AssignmentConstruction Technology Assignment
Construction Technology Assignment
 
Building Material (Library Site report)
Building Material (Library Site report)Building Material (Library Site report)
Building Material (Library Site report)
 
Building Material (Concrete)
Building Material (Concrete) Building Material (Concrete)
Building Material (Concrete)
 

Recently uploaded

Q4-W6-Restating Informational Text Grade 3
Q4-W6-Restating Informational Text Grade 3Q4-W6-Restating Informational Text Grade 3
Q4-W6-Restating Informational Text Grade 3JemimahLaneBuaron
 
Alper Gobel In Media Res Media Component
Alper Gobel In Media Res Media ComponentAlper Gobel In Media Res Media Component
Alper Gobel In Media Res Media ComponentInMediaRes1
 
“Oh GOSH! Reflecting on Hackteria's Collaborative Practices in a Global Do-It...
“Oh GOSH! Reflecting on Hackteria's Collaborative Practices in a Global Do-It...“Oh GOSH! Reflecting on Hackteria's Collaborative Practices in a Global Do-It...
“Oh GOSH! Reflecting on Hackteria's Collaborative Practices in a Global Do-It...Marc Dusseiller Dusjagr
 
Organic Name Reactions for the students and aspirants of Chemistry12th.pptx
Organic Name Reactions  for the students and aspirants of Chemistry12th.pptxOrganic Name Reactions  for the students and aspirants of Chemistry12th.pptx
Organic Name Reactions for the students and aspirants of Chemistry12th.pptxVS Mahajan Coaching Centre
 
Measures of Central Tendency: Mean, Median and Mode
Measures of Central Tendency: Mean, Median and ModeMeasures of Central Tendency: Mean, Median and Mode
Measures of Central Tendency: Mean, Median and ModeThiyagu K
 
Call Girls in Dwarka Mor Delhi Contact Us 9654467111
Call Girls in Dwarka Mor Delhi Contact Us 9654467111Call Girls in Dwarka Mor Delhi Contact Us 9654467111
Call Girls in Dwarka Mor Delhi Contact Us 9654467111Sapana Sha
 
mini mental status format.docx
mini    mental       status     format.docxmini    mental       status     format.docx
mini mental status format.docxPoojaSen20
 
Paris 2024 Olympic Geographies - an activity
Paris 2024 Olympic Geographies - an activityParis 2024 Olympic Geographies - an activity
Paris 2024 Olympic Geographies - an activityGeoBlogs
 
Grant Readiness 101 TechSoup and Remy Consulting
Grant Readiness 101 TechSoup and Remy ConsultingGrant Readiness 101 TechSoup and Remy Consulting
Grant Readiness 101 TechSoup and Remy ConsultingTechSoup
 
SOCIAL AND HISTORICAL CONTEXT - LFTVD.pptx
SOCIAL AND HISTORICAL CONTEXT - LFTVD.pptxSOCIAL AND HISTORICAL CONTEXT - LFTVD.pptx
SOCIAL AND HISTORICAL CONTEXT - LFTVD.pptxiammrhaywood
 
microwave assisted reaction. General introduction
microwave assisted reaction. General introductionmicrowave assisted reaction. General introduction
microwave assisted reaction. General introductionMaksud Ahmed
 
APM Welcome, APM North West Network Conference, Synergies Across Sectors
APM Welcome, APM North West Network Conference, Synergies Across SectorsAPM Welcome, APM North West Network Conference, Synergies Across Sectors
APM Welcome, APM North West Network Conference, Synergies Across SectorsAssociation for Project Management
 
Employee wellbeing at the workplace.pptx
Employee wellbeing at the workplace.pptxEmployee wellbeing at the workplace.pptx
Employee wellbeing at the workplace.pptxNirmalaLoungPoorunde1
 
BASLIQ CURRENT LOOKBOOK LOOKBOOK(1) (1).pdf
BASLIQ CURRENT LOOKBOOK  LOOKBOOK(1) (1).pdfBASLIQ CURRENT LOOKBOOK  LOOKBOOK(1) (1).pdf
BASLIQ CURRENT LOOKBOOK LOOKBOOK(1) (1).pdfSoniaTolstoy
 
Micromeritics - Fundamental and Derived Properties of Powders
Micromeritics - Fundamental and Derived Properties of PowdersMicromeritics - Fundamental and Derived Properties of Powders
Micromeritics - Fundamental and Derived Properties of PowdersChitralekhaTherkar
 
CARE OF CHILD IN INCUBATOR..........pptx
CARE OF CHILD IN INCUBATOR..........pptxCARE OF CHILD IN INCUBATOR..........pptx
CARE OF CHILD IN INCUBATOR..........pptxGaneshChakor2
 
The basics of sentences session 2pptx copy.pptx
The basics of sentences session 2pptx copy.pptxThe basics of sentences session 2pptx copy.pptx
The basics of sentences session 2pptx copy.pptxheathfieldcps1
 
How to Make a Pirate ship Primary Education.pptx
How to Make a Pirate ship Primary Education.pptxHow to Make a Pirate ship Primary Education.pptx
How to Make a Pirate ship Primary Education.pptxmanuelaromero2013
 

Recently uploaded (20)

Q4-W6-Restating Informational Text Grade 3
Q4-W6-Restating Informational Text Grade 3Q4-W6-Restating Informational Text Grade 3
Q4-W6-Restating Informational Text Grade 3
 
Alper Gobel In Media Res Media Component
Alper Gobel In Media Res Media ComponentAlper Gobel In Media Res Media Component
Alper Gobel In Media Res Media Component
 
Staff of Color (SOC) Retention Efforts DDSD
Staff of Color (SOC) Retention Efforts DDSDStaff of Color (SOC) Retention Efforts DDSD
Staff of Color (SOC) Retention Efforts DDSD
 
“Oh GOSH! Reflecting on Hackteria's Collaborative Practices in a Global Do-It...
“Oh GOSH! Reflecting on Hackteria's Collaborative Practices in a Global Do-It...“Oh GOSH! Reflecting on Hackteria's Collaborative Practices in a Global Do-It...
“Oh GOSH! Reflecting on Hackteria's Collaborative Practices in a Global Do-It...
 
Organic Name Reactions for the students and aspirants of Chemistry12th.pptx
Organic Name Reactions  for the students and aspirants of Chemistry12th.pptxOrganic Name Reactions  for the students and aspirants of Chemistry12th.pptx
Organic Name Reactions for the students and aspirants of Chemistry12th.pptx
 
Measures of Central Tendency: Mean, Median and Mode
Measures of Central Tendency: Mean, Median and ModeMeasures of Central Tendency: Mean, Median and Mode
Measures of Central Tendency: Mean, Median and Mode
 
Call Girls in Dwarka Mor Delhi Contact Us 9654467111
Call Girls in Dwarka Mor Delhi Contact Us 9654467111Call Girls in Dwarka Mor Delhi Contact Us 9654467111
Call Girls in Dwarka Mor Delhi Contact Us 9654467111
 
mini mental status format.docx
mini    mental       status     format.docxmini    mental       status     format.docx
mini mental status format.docx
 
Paris 2024 Olympic Geographies - an activity
Paris 2024 Olympic Geographies - an activityParis 2024 Olympic Geographies - an activity
Paris 2024 Olympic Geographies - an activity
 
Grant Readiness 101 TechSoup and Remy Consulting
Grant Readiness 101 TechSoup and Remy ConsultingGrant Readiness 101 TechSoup and Remy Consulting
Grant Readiness 101 TechSoup and Remy Consulting
 
SOCIAL AND HISTORICAL CONTEXT - LFTVD.pptx
SOCIAL AND HISTORICAL CONTEXT - LFTVD.pptxSOCIAL AND HISTORICAL CONTEXT - LFTVD.pptx
SOCIAL AND HISTORICAL CONTEXT - LFTVD.pptx
 
microwave assisted reaction. General introduction
microwave assisted reaction. General introductionmicrowave assisted reaction. General introduction
microwave assisted reaction. General introduction
 
APM Welcome, APM North West Network Conference, Synergies Across Sectors
APM Welcome, APM North West Network Conference, Synergies Across SectorsAPM Welcome, APM North West Network Conference, Synergies Across Sectors
APM Welcome, APM North West Network Conference, Synergies Across Sectors
 
Employee wellbeing at the workplace.pptx
Employee wellbeing at the workplace.pptxEmployee wellbeing at the workplace.pptx
Employee wellbeing at the workplace.pptx
 
BASLIQ CURRENT LOOKBOOK LOOKBOOK(1) (1).pdf
BASLIQ CURRENT LOOKBOOK  LOOKBOOK(1) (1).pdfBASLIQ CURRENT LOOKBOOK  LOOKBOOK(1) (1).pdf
BASLIQ CURRENT LOOKBOOK LOOKBOOK(1) (1).pdf
 
Model Call Girl in Tilak Nagar Delhi reach out to us at 🔝9953056974🔝
Model Call Girl in Tilak Nagar Delhi reach out to us at 🔝9953056974🔝Model Call Girl in Tilak Nagar Delhi reach out to us at 🔝9953056974🔝
Model Call Girl in Tilak Nagar Delhi reach out to us at 🔝9953056974🔝
 
Micromeritics - Fundamental and Derived Properties of Powders
Micromeritics - Fundamental and Derived Properties of PowdersMicromeritics - Fundamental and Derived Properties of Powders
Micromeritics - Fundamental and Derived Properties of Powders
 
CARE OF CHILD IN INCUBATOR..........pptx
CARE OF CHILD IN INCUBATOR..........pptxCARE OF CHILD IN INCUBATOR..........pptx
CARE OF CHILD IN INCUBATOR..........pptx
 
The basics of sentences session 2pptx copy.pptx
The basics of sentences session 2pptx copy.pptxThe basics of sentences session 2pptx copy.pptx
The basics of sentences session 2pptx copy.pptx
 
How to Make a Pirate ship Primary Education.pptx
How to Make a Pirate ship Primary Education.pptxHow to Make a Pirate ship Primary Education.pptx
How to Make a Pirate ship Primary Education.pptx
 

Financial Management Group Presentation Slides

  • 1.
  • 2. 1.Financial Management QSB3413/QSB3414/FIN60203 ABOUT THE COMPANY Sycal Venture Berhad (Group)  Established since 1980  Public Limited Liability Company  Listed on the main board of Bursa Malaysia on the 29th March 1995  Core Businesses  Construction and Infrastructure  Property Development  Hotels and Resorts
  • 3. 2.Financial Management QSB3413/QSB3414/FIN60203 PRINCIPAL ACTIVITIES Name of subsidiary companies Principal Activities Sycal Kulai Sdn Bhd Property development Cygal Construction Sdn Bhd Dormant Sycal Plant & Machinery Sdn Bhd Contractor for management and operator of plant and machinery Cygal Industries Sdn Bhd Dormant Cygal Hotel Management Services Sdn Bhd Dormant Cygal Entertainment Sdn Bhd Dormant Sycal Concrete Sdn Bhd Manufacturing and trading in ready mix concrete Sycal Geotechniecs Sdn Bhd Dormant United Golden Mile Aviation Ltd Leasing of aircraft parts and equipment and provision of related services Sycal ICC Properties Sdn Bhd Property development Sycal Properties Management Sdn Bhd Property development, investment holding and operator of theme park
  • 4. ANALYSIS OF REVENUE CONTRIBUTIONS OF DIFFERENT SEGMENTS 3.Financial Management QSB3413/QSB3414/FIN60203
  • 5. REVENUE CONTRIBUTION OF DIFFERENT SEGMENTS IN 2014 & 2015 REVENUE GROUP VARIANCE 2015 2014 RM’000 RM’000 RM’000 % Revenue comprises: Contract revenue 248,351 291,859 (43,508) (15)% Consultation and project management fee 7,311 1,200 6,111 509% Property development revenue 1,458 51,715 (50,257) (97%) Joint venture development revenue 3,182 - 3,182 100% Sales of goods and services 61,415 62,609 (1,194) (2%) TOTAL 321,717 407,383 (85,666) (21%) 4.Financial Management QSB3413/QSB3414/FIN60203
  • 6. CURRENT STATE OF MAJOR INDUSTRY OF SYCAL BERHAD  CURRENTLY FACING THE CHALLENGES OF ECONOMIC SLOWDOWN.  ECONOMIC GROWTH IS EXPECTED TO SLUGGISH FROM 4.7% TO 4.5% IN ONE YEAR PERIOD.  THE HOUSING MARKET ECONOMIST PREDICTED THE NUMBER OF SALES FOR HOUSING MARKET WILL ATTAIN BETWEEN 190,000 AND 210,000.  HOUSE PRICE INDEX- RISE IN BETWEEN 3.5% & 5.5%.  GDV- GROW BY 2% IN 2016.  OVERALL, SYCAL BERHAD IS COMPETENT TO KEEP PROFITABLE. 5.Financial Management QSB3413/QSB3414/FIN60203
  • 7. 6.Financial Management QSB3413/QSB3414/FIN60203 STRENGTHS  Awarded the Bureau Veritas Certification, ISO 9001:2008  Requirements of the management system standards  Handful of Completed Projects  Segmentations of Services  Services by different subsidiaries WEAKNESSES  Diversification  Into Hotels & Resorts  Affects by Economic Downturn
  • 8. 7.Financial Management QSB3413/QSB3414/FIN60203 STRATEGIC PLANS TO SEIZE OPPORTUNITIES  Planned Developments in developing areas  Potential GDV of RM 1.2 billion  Expand one of their core business  Hotels & Resorts segment CHALLENGES  Global financial crisis  Goods and Service Tax issue  Comply with stringent regulations  Threats of increased interest rates  Stringent lending policies by bank  Ability to fund its projects
  • 9. 8.Financial Management QSB3413/QSB3414/FIN60203 MAJOR CAPITALS Last three years Year 2013 • Purchased RM 7,245,000 of property, plant and equipment • As well as RM 63,000 in other investments Year 2014 • Purchased RM 15,371,000 of property, plant and equipment • As well as RM 63,000 in other investments Year 2015 • Purchased RM 16,882,000 of property, plant and equipment • As well as RM 63,000 in other investments SOURCE OF FUNDINGS  Bank borrowings of RM 62,578,000 and RM 60,345,000 in the year 2014 and 2015 respectively
  • 10. EVALUATING THE COMPANY’S CASH FLOW 9.Financial Management QSB3413/QSB3414/FIN60203 Company’s Cash Flow Statement Year 2011 2012 2013 2014 2015 Total of Cash and Cash Equivalents (RM) 611,000 485,000 2,270,000 8,340,000 (4,260,000) Differences (RM) - (126,000) 1,785,000 6,070,000 (12,600,000)
  • 11. THE COMPANY’S MAJOR CASH FLOW 10.Financial Management QSB3413/QSB3414/FIN60203
  • 12. THE COMPANY’S MAJOR CASH FLOW (CONT’D) 11.Financial Management QSB3413/QSB3414/FIN60203
  • 13. Net cash decrease by RM 4,260,000 in 2015 while in 2014 the net cash increase is RM 8,340,000 which is higher than net cash in 2015 THE COMPANY’S CASH AND CASH EQUIVALENT 12.Financial Management QSB3413/QSB3414/FIN60203
  • 14. THE COMPANY’S FREE CASH FLOW  WHAT IS FCF (FREE CASH FLOW)?  A MEASUREMENT OF FINANCE PERFORMANCE  HOW TO CALCULATES FCF?  USING THE COMPANY’S OCF – CAPEX = FCF Financial Management QSB3413/QSB3414/FIN60203 13.
  • 15. Year 2011 RM Net Operating Activities 1,436,000 Total Investment (908,000) Total FCF 528,000 Year 2012 RM Net Operating Activities 21,420,000 Total Investment (40,000) Total FCF 21,380,000 Year 2013 RM Net Operating Activities (14,148,000) Total Investment (407,000) Total FCF (14,555,000) Year 2014 RM Net Operating Activities (41,770,000) Total Investment (1,401,000) Total FCF (43,171,000) Year 2015 RM Net Operating Activities (426,000) Total Investment (1,473,000) Total FCF (1,473,000) THE COMPANY’S FREE CASH FLOW Financial Management QSB3413/QSB3414/FIN60203 14.
  • 16. Year of Company’s Free Cash Flow (FCF) Total in RM 31st of March 2011 528,000 31st of March 2012 21,380,000 31st of March 2013 (14,555,000) 31st of March 2014 (43,171,000) 31st of March 2015 (1,473,000) Total Free Cash Flow in 5 Years (34,291) Financial Management QSB3413/QSB3414/FIN60203 THE COMPANY’S FREE CASH FLOW 15.
  • 17. COMPANY’S FINANCIAL PERFORMANCE Financial Management QSB3413/QSB3414/FIN60203 2015 2014 2013 2012 2011 a. Current Ratio current assets current liabilities 434,729,000 225,848,000 = 1.92 443,676,000 224,002,000 = 1.98 328,261,000 211,296,000 = 1.55 192,754,000 132,343,000 = 1.46 190,409,000 113,703,000 = 1.67 b. Quick Ratio cash+accounts receivable current liabilities 5,205,000+ 173,076,000 225,848,000 = 0.79 9,720,000+ 172,333,000 224,002,000 = 0.81 3,529,000+ 160,551,000 211,296,000 = 0.78 2,425,000+ 36,812,000 132,343,000 = 0.30 1,199,000+ 51,329,000 113,703,000 = 0.46 i. Liquidity 16.
  • 18. Financial Management QSB3413/QSB3414/FIN60203 17. COMPANY’S FINANCIAL PERFORMANCE ii. Activity 2015 2014 2013 2012 2011 a. Inventory turnover Cost of goods sold Inventory 280,540,000 19,932,000 =14.07x 363,933,000 19,811,000 =18.37x 260,573,000 6,589,000 =39.55x 148,907,000 8,161,000 =18.25x 83,241,000 7,789,000 =10.69x b. Average collection period Accounts receivables Daily credit sales 189,939,000 297,652,000 x 365 =233.6 days 176,130,000 384,514,000 x 365 =167.4 days 112,942,000 272,125,000 x 365 =151.5 days 51,522,000 157,327,000 x 365 =119.5 days 48,676,000 89,006,000 x 365 =199.6 days c. Total asset turnover Sales Total assets 321,717,000 434,729,000 =0.74x 407,383,000 443,676,000 =0.92x 292,327,000 328,261,000 =0.89x 169,406,000 192,754,000 =0.88x 100,131,000 190,409,000 =0.53x
  • 19. COMPANY’S FINANCIAL PERFORMANCE iii. Debt Financial Management QSB3413/QSB3414/FIN60203 18. 2015 2014 2013 2012 2011 a. Debt Ratio Total liabilities Total assets 286,193,000 528,225,000 =0.54 286,580,000 511,862,000 =0.56 215,311,000 405,161,000 =0.53 142,879,000 315,140,000 =0.45 128,539,000 291,673,000 =0.44 b. Debt to Equity Total liabilities Common stock equity 286,193,000 242,032,000 =1.18 286,580,000 225,282,000 =1.27 215,311,000 189,850,000 =1.13 142,879,000 172,261,000 =0.83 128,539,000 163,134,000 =0.79 c. Interest cover ratio Operating profits Interest expense 24,603,000 1,593,000 =15.44 29,195,000 1,480,000 =19.73 20,427,000 228,000 =89.59 12,748,000 917,000 =13.90 6,927,000 1,876,000 =3.69
  • 20. COMPANY’S FINANCIAL PERFORMANCE iv. Profitability Financial Management QSB3413/QSB3414/FIN60203 19. 2015 2014 2013 2012 2011 a. Gross Profit Margin Gross profit Revenue 41,177,000 321,717,000 =0.13 43,450,000 407,383,000 =0.11 31,754,000 292,327,000 =0.11 20,499,000 169,406,000 =0.12 16,890,000 87,322,000 =0.19 b. Return on Assets Net income Total assets x 100% 18,452,000 528,225,000 x 100% =3.49% 35,804,000 511,862,000 x 100% =6.99% 17,977,000 405,161,000 x 100% 4.44% 8,936,000 315,140,000 x 100% =2.84% 5,200,000 291,673,000 x 100% =1.78% c. Return on Equity Net income Shareholders’ equity x 100% 18,452,000 238,203,000 x 100% =7.75% 35,804,000 222,312,000 x 100% =16.11% 17,977,000 187,685,000 x 100% 9.58% 8,936,000 170,641,000 x 100% =5.24% 5,200,000 161,543,000 x 100% =3.22%
  • 21. COMPANY’S FINANCIAL PERFORMANCE v. Market Performance Financial Management QSB3413/QSB3414/FIN60203 20. 2015 2014 2013 2012 2011 a. Earnings per Share Net income Total outstanding common shares 17,293,000 320,250,000 =0.05 34,999,000 320,250,000 =0.11 17,432,000 320,250,000 =0.06 8,907,000 288,256,000 =0.03 5,056,000 251,959,000 =0.02 b. Price / Earnings Market value per share Earnings per share 0.41 0.05 =8.20 0.33 0.11 =3.00 0.28 0.06 =4.67 0.18 0.03 =6.00 0.20 0.02 =10.00 c. Price / Book Ratio Market value per share Equity book value / share 0.41 0.74 =0.55 0.33 0.69 =0.48 0.28 0.59 =0.47 0.18 0.59 =0.31 0.20 0.64 =0.31
  • 22. Financial Management QSB3413/QSB3414/FIN60203 FORECAST REVENUE GROWTH 2015 2016 RM'000 % of Revenue RM'000 Revenue 321,717 100.0% 341,020 Cost of Sales (280,540) -87.2% (297,372) Gross Profit 41,177 12.8% 43,648 Other Operation Income 6,426 2.0% 6,812 47,603 14.8% 50,459 Administration Expenses (10,854) -3.4% (11,505) Other Operating Expenses (13,211) -4.1% (14,004) Profit/(Loss) From Operations 23,538 7.3% 24,950 Finance Costs (1,727) -0.5% (1,831) Profit/(Loss) Before Taxation 21,811 6.8% 23,120 Taxation (3,359) -1.0% (3,561) Profit/(Loss) For the Year 18,452 5.7% 19,559 Other Comprehensive Income (1,402) -0.4% (1,486) Total Comprehensive Income/(Loss) for the Year 17,050 5.3% 18,073 21.
  • 23. Financial Management QSB3413/QSB3414/FIN60203 REQUIRED NEW FUNDS )1()()( 2 11 DPSS S L S S A RNF  - This shows that the company does not require any new funds to achieve this sales growth A/S = Percentage relationship of variable assets to sales S = Change in sales L/S = Percentage relationship of variables liabilities to sales P = Profit margin S2 = New sales level D = Dividend payout ratio 22.
  • 24. CONCLUSIONS & RECOMMENDATIONS 23.Financial Management QSB3413/QSB3414/FIN60203  Worsening performance in the year ended 2015  Attributed to the downturn in economy  Diversify its revenue streams or investments  Utilisation of assets
  • 25. Financial Management QSB3413/QSB3414/FIN60203 “Enjoy little things in life, because one day you will look back, and realize they were the big things.” – Barrack Obama