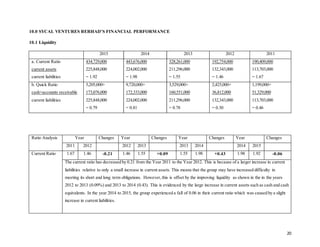
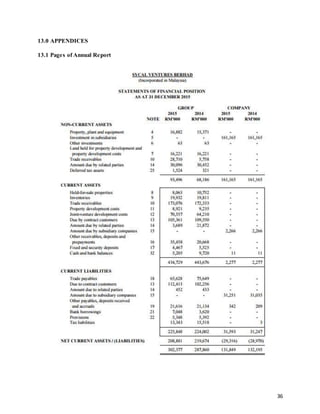
Introduction to ArtificiaI Intelligence in Higher Education
Financial Analysis Report for Sycal Ventures Berhad
1. 2
An Assignmentcover sheetneeds to be included with each assignment. Please complete alldetails clearly.
When submitting the printed copy of this assignment, please attach this sheet to the front of your assignment. When submitting the assignment online, please
ensure this cover sheet is included as the first page of your document.
Please check with your subjectlecturer for assignmentsubmission locations.
Names: Student IDs:
MELVIN LIM WEI JIEN 0315772
JAKE SIA CHYISERN 0314396
VOON SZE LUN 0315032
AMY WONG LI HUI 0312406
NOBERTVOO HSIEN YUNG 0303748
Programme: Bachelor ofQuantity Surveying (Honours),SCHOOL OFARCHITECTURE, BUILDING & DESIGN
Email (Group Leader): melvin.lim1@hotmail.com ContactNo (Group Leader): 012 6655 329
Subjectcode and title: QSB3413/QSB3414/FIN60203FINANCIAL MANAGEMENT
Module Lecturer/ Tutor: Lai Chee Kin
Assignmentnumber: Group Written Assignment Due date: 22 November 2016
Assignmenttopic as stated in the guidelines provided: Businessand financial analyses and forecasts ofa company.
Further Information: (e.g.state ifextension wasgranted and attach evidence ofapproval and Revised Submission Date)
ASSIGNMENT COVER SHEET
2. I have read and understood the Taylor’s University Regulations on cheating, plagiarism and collusion and state that this piece of work is my own and does not
contain any unacknowledged work from any other sources.
I authorise the University totest anyworksubmitted by me, using textcomparison software, for instancesof plagiarism.I understand thiswill involve the University
or its contractor copying my work and storing it on a database to be used in future to test work submitted by others.
Note: The attachment ofthisstatement on any electronically submitted assignments will be deemed to have the same authority as a signed statement.
Signed: Name: Date:
Date received from student: Receivedby:
3. A. A feedback form needs to be included with each assignment. Please complete all details clearly.
Student Names and IDs:
MELVIN LIM WEIJIEN 0315772
JAKE SIA CHYISERN 0314396
VOON SZE LUN 0315032
AMY WONG LIHUI0312406
NOBERT VOO HSIEN YUNG 0303748
Programme: Bachelor ofQuantity Surveying (Honours),SCHOOLOF ARCHITECTURE,BUILDING & DESIGN
Email : melvin.lim1@hotmail.com ContactNo : 012 6655 329
Module code and title: QSB3413/QSB3414/FIN60203FINANCIAL MANAGEMENT Module Lecturer/ Tutor: Lai Chee Kin
Assignmentnumber: Group Written Assignment Due date: 22 November 2016 Word Count: 4,708
Assignmenttopic as stated in the guidelines provided: Business and financial analysesand forecasts ofa company.
B. This section will be completed by the lecturer/tutor assessing your assignment:
CRITERIA %
DISTINCTION
(7.5-10)
CREDIT
(6-7.4)
PASS
(5-5.9)
MARGINAL
FAIL(4-4.9)
FAIL
(0-3.9) SCORE
Executive summary,
introduction,background
and principalactivities, and
strategic plans ofthe
company
5 # Excellent
Well-researched, objective and
clearly written.
# Good # Fair # Poor # Confusing
Shows little or no research, biased or
irrelevant, lacks clarity.
Industry analysis 10 # Excellent
Relevant, up-to-date and well-
researched.
# Good # Fair # Poor # Erroneous
Irrelevant, outdated, little evidence of
research.
Financialanalysis 70 # Excellent
Accurate calculations ofthe latest
financial data over two years,
comparison with industry data, well-
reasoned analyses.
# Good # Fair # Poor # Erroneous
Multiple errors in calculations
showing lackofunderstanding,fails
to evaluate company by comparing
with relevantindustry data, no
reasoned analysis offinancial data.
Financialforecasts 10 # Excellent
Accurate calculationsand
correct conclusions. Excellent
evaluation of theprojectedcash
requirements.
# Good # Fair # Poor # Erroneous
Multipleerrorsin calculations
showing lackof understanding.
Forecasts withoutany basisor
justification. Missing or invalid
conclusionsand analyses.
ASSIGNMENT FEEDBACK GRADE/ MARK
4. Structure andpresentation,
language, reference of
sources
5 # Excellent
Excellentheadings/sub-headings,
layout, pagination. Excellent
grammar, spelling.Effective/accurate
use offigures and tables. Excellent
references ofsources.
# Good # Fair # Poor # Erroneous
Inappropriate or no headings, poor
and confusing layout, innappropriate
or no numbering. Weak grammar,
many spelling mistakes,
ineffective/inaccurate use offigures
and tables. Poor or no references of
sources.
Penalty
Total (100%)
Final score (25%)
Any additionalcomments(if there is any):Comments:
Assessed by: Date:
Sample Moderated by (ifany): Date:
5. 2
Table of Content
Content P g.
1.0 Background……………………………………………………………………………….….…2-5
2.0 Principal Activities of the Company………………………………………………………..........6
3.0 Analysis of the Revenue Contributions of Different Segments…………………………….….7-8
4.0 Current State of the Major Industry of the Company…………………………………….………8
5.0 Strength and Weaknesses………………………………………………………………….……..9
6.0 Strategic Plan and Challenges…………………………………………………………….…..9-10
7.0 Major Capitals…………………………………………………………………………….….….11
8.0 Cash Flow over the last five years………………………………………………………...…12-15
9.0 Free Cash Flow in the recent five years………………………………………………….…..16-19
10.0 Financial Condition………………………………………………………………………….20-32
11.0 Forecast Revenue Growth……………………………………………………………………33-34
12.0 Conclusion and Recommendations……………………………………………………………...35
13.0 Appendices……………………………………………………………………………….…..36-49
14.0 References……………………………………………………………………………………50-51
6. 2
1.0 BACKGROUND
1.1 Establishments
Sycal Ventures Berhad is an established player in the construction industry having been around since
1980, the company’s headquarters is in Kuala Lumpur, Malaysia. The company is a public limited liability
company incorporated in Malaysia under the Companies Act, 1965 and is domiciled in Malaysia (Sycal
Ventures – Annual Report 2015). The company operates as an investment holding company and is listed
on the Main Market of Bursa Malaysia Securities Berhad. The Company operates through three segments:
Construction, Property development, and Manufacturing and trading (Reuters, 2016).
The Sycal group is currently active in property development, including new townships and also the
Hotel & Resort sector. The group has delivered more than RM1.5 billion worth of projects for the
government as well as the private sectors, which includes low-rise and high-rise housing, infrastructure,
landmark buildings, universities, hospitals and commercial developments.
1.2 Core businesses
There are 3 core businesses in Sycal Ventures Berhad. Construction and infrastructure activities
represent one of the core business of the group and has contributed approximately 71% of the Group’s
revenue, backed by a construction order book of approximately RM 319 million for the year ended in 31
December 2007 (Sycal Ventures Berhad, 2016).
Secondly, through Property Development, Sycal Berhad had newly acquired 2 development
subsidiaries, namely Sycal Properties Sdn Bhd (SPSB) and Sycal Resorts Sdn Bhd (SRSB), of which both
has entered 3 new development projects in Cheras, Bukit Gambir and Lumut.
Last but not least, Hotels and resorts represents another of their core activity. One of the missions
of Sycal Berhad is to enhance the reputation of the hotels and resorts under its roof within the hospitality
industry. The group has developed Marina Cove Resort and Marina Heights as apartment concepts which
overlook the popular holiday island, Pangkor Island.
7. 3
1.3 Listing
On the 29th
of March 1995, Sycal Ventures Berhad became a public listed company and was listed on
the Main Board of Bursa Malaysia (KLSE: SYCAL), (Sycal Ventures Berhad,2016).
1.4 Shareholders
Name OfShareholders No. ofHoldings %
1. Kenaga Nominees (Tempatan) Sdn Bhd
- Fantastic Hallmark Sdn Bhd
53,364,048 16.66
2. Kenaga Nominees (Tempatan) Sdn Bhd
- Westhill Capital Sdn Bhd
26,682,024 8.33
3. SYC Holdings Sdn Bhd 18,330,628 5.72
4. Kenaga Nominees (Tempatan) Sdn Bhd
- A Malik Bin Munadi
15,382,024 4.80
5. Sungai Kasa Sdn Bhd 14,975,475 4.68
6. Waste Environment Services Sdn Bhd 14,967,762 4.67
7. Flora Luxury Sdn Bhd 12,767,996 3.99
8. Kenaga Nominees (Tempatan) Sdn Bhd
- Rohizir Bin Abdul Rashid
11,300,000 3.53
9. Kenaga Nominees (Tempatan) Sdn Bhd
For GM Aero Support Sdn Bhd
10,704,601 3.34
10. Dato’ Seow Yong Chin 7,826,145 2.44
11. Cimsec Nominees (Tempatan) Sdn Bhd
Pengurusan Danaharta Nasional Berhad for Seow
Yong Chin
6,777,330 2.12
12. Chua Seng Boon 5,794,100 1.81
13. Public Nominees (Tempatan) Sdn Bhd
Pledge Securities Account for Chua Seng Onn (E-
TAI/ATR)
4,652,300 1.45
14. Cheong Sau Wah 4,260,019 1.33
15. UOBM Nominees (Tempatan) Sdn Bhd
United Overseas Bank (Malaysia) Bhd
4,226,480 1.32
8. 4
16. Ng Yeow Yin 3,421,449 1.07
17. Amanah International Finance Sdn Bhd 3,294,574 1.03
18. Kenaga Nominees (Tempatan) Sdn Bhd
Syed Zain Al-Kudcy Bin Syed Mahmood (001)
3,256,413 1.02
19. Cimsec Nominees (Tempatan) Sdn Bhd
Danaharta Managers Sdn Bhd for Seow Yong Chin
3,222,670 1.01
20. Kenaga Nominees (Tempatan) Sdn Bhd
Pledged securities account for Chua Seng Oun
2,910,000 0.91
21. HLB Nominees (Tempatan) Sdn Bhd
Pledged securities account for Cygal Holdings Sdn
Bhd (HLFCHSB/104)
2,599,500 0.81
22. Maybank Nominees (Tempatan) Sdn Bhd
Pledged securities account for Seow Yong Chin
(MDTS)
2,115,000 0.66
23. Ital-Pacific Development Sdn Bhd 1,785,000 0.56
24. Kenaga Nominees (Tempatan) Sdn Bhd
For SYC Holdings Sdn Bhd (001)
1,402,254 0.44
25. Cygal Holdigns Sdn Bhd 1,391,250 0.43
26. Visefare Villa Sdn Bhd 1,376,656 0.43
27. Public Nominees (Tempatan) Sdn Bhd
Pledged Securities Account for Yap Kon Hing
1,309,200 0.41
28. Lim Kang Pow 1,211,800 0.38
29. Public Nominees (Tempatan) Sdn Bhd
Pledged Securities Account for Lim Lee Foon
1,199,950 0.37
30. Malaysia Nominees (Tempatan) Sdn Bhd
Pledged Securities Account for Cygal Holdings Sdn
Bhd
1,175,250 0.37
9. 5
1.5 Key Management Personnel
i. Dato’ Sri Haji Abd Rahim Bin Haji Abdul
Chairman / Non-Independent Non-Executive Director
Appointed on 15 March 2006
ii. Dato’ Seow Yong Chin
Group Managing Director / Member of Remuneration Committee
Appointed on 30 November 2005
iii. Syed Zain Al-Kudcy Bin Dato’ Syed Mahmood
Executive Director
Appointed on 30 November 2005
iv. Chin Kok Wah
Executive Director
Appointed on 30 November 2005
v. Tan Sri Dato’ Seri Dr. Ting Chew Peh
Independent Non-Executive Director / Member of Audit Committee / Chairman of Remuneration /
Member of Nomination Committee
Appointed on 27 June 2014
vi. Dato’ Paduka Dr Abdul Wahid Bin Ahmad Shuhaime
Independent Non-Executive Director / Member of Audit Committee / Chairman of Remuneration
Committee / Member of Nomination Committee
Appointed on 27 February 2012
vii. Tee Lay Peng
Independent Non-Executive Director / Member of Audit Committee / Chairman of Remuneration
Committee / Member of Nomination Committee
Appointed on 30 September 2013
10. 6
2.0 PRINCIPAL ACTIVITIES OF THE COMPANY
Sycal Berhad is principally an investment holding company itself. However,its subsidiaries engage in
various principal activities mentioned below (Sycal Ventures – Annual Report 2015):
Name ofsubsidiary companies Principal Activities
Sycal Kulai Sdn Bhd Property development
Cygal Construction Sdn Bhd Dormant
Sycal Plant & Machinery Sdn Bhd Contractor for management and operator of plant
and machinery
Cygal Industries Sdn Bhd Dormant
Cygal Hotel Management Services Sdn Bhd Dormant
Cygal Entertainment Sdn Bhd Dormant
Sycal Concrete Sdn Bhd Manufacturing and trading in ready mix concrete
Sycal Geotechniecs Sdn Bhd Dormant
United Golden Mile Aviation Ltd Leasing of aircraft parts and equipment and
provision of related services
Sycal ICC Properties Sdn Bhd Property development
Sycal Properties Management Sdn Bhd Property development, investment holding and
operator of theme park
11. 7
[Grab your
reader’s
attention
witha great
quote from
the
documentor
use this
space to
emphasize a
keypoint.To
place this
textbox
anywhere on
the page,
justdrag it.]
3.0 ANALYSIS OF THE REVENUE CONTRIBUTIONS OF DIFFERENT SEGMENTS
Figure 1.1 showing each segments of revenue of the company in 2014 and 2015.
Table 1.1: Revenue contribution of different segments in 2014 & 2015.
*(Retrieved from Annual Report 2015)
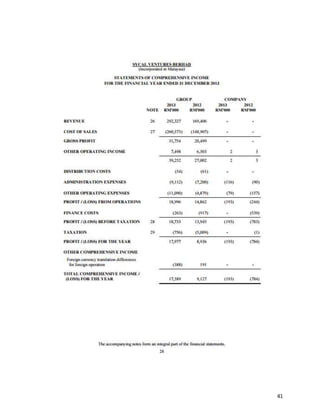
REVENUE
GROUP VARIANCE
2015 2014
RM'000 RM'000 RM'000 %
Revenue comprises:
Contract revenue 248,351 291,859 (43,508) (15%)
Consultation and project management
fee 7,311 1,200 6,111 509%
Property development revenue 1,458 51,715 (50,257) (97%)
Joint venture development revenue 3,182 - 3,182 100%
Sales of goods and services 61,415 62,609 (1,194) (2%)
TOTAL 321,717 407,383 -85,666 (21%)
RM
12. 8
Total revenue has decreased by RM 85k (21%) from 2014 to 2015. The major contributor to the
decrease is from contract and property development revenue which represent 51% and 59% of the total fall
in revenue respectively. Moreover, contract revenue represents the largest contributor to total revenue in
2014 of 72%. This could be due to challenges the group faces in obtaining new revenue in a price-sensitive
industry which is influenced by a downturn in the economy.
4.0 CURRENT STATE OF THE MAJOR INDUSTRY OF THE COMPANY
Due to the recent global financial crisis, the economy in Malaysia is moving slowly (Focus
Economics, 2016). This has resulted in the hiking of prices of houses which in turn has influenced property
transaction activities and residential construction developments to decelerate (Global Property Guide,
2016).
Sycal Berhad is currently facing the challenges of economic slowdown. In 2016, as a result of tight
fiscal status, the economic growth is expected to sluggish until 4.5% from 4.7% in one year period. As
stated in economics.rabobanks.com, the housing market economist predicted that number of sales for the
housing market in 2016 will attain between 190,000 and 210,000. Hence,it is possible for the transactions
of 206,000 to be transcended.
At the same time, the house price index is expected to rise in between 3.5% and 5.5% (Trading
Economics, 2016). The GDV is expected to grow by 2% in 2016. Therefore,Sycal Berhad is competent to
keep profitable as the purchasing power is positive for the property market.
13. 9
5.0 ANALYSIS OF COMPANY’S STRENGTHS AND WEAKNESSES
5.1 Strengths
One of Sycal Venture Berhad’s strength is their company’s quality management. Sycal Ventures
Berhad has been awarded the Bureau Veritas Certification, ISO 9001:2008, to certify that the company is
in compliance with the requirements of the management system standards (Sycal Ventures Berhad, 2016).
Besides, Sycal Ventures Berhad has a handful of completed projects around Malaysia such as the
luxurious condominium, CherasHeights located atTaman Bukit Cheras.OfficesandCommercial buildings
like Tesco and Aeon have been completed and is situated in 3 states, Perak, Selangor and Ipoh. These
projects contribute to the portfolio which in turn builds the group’s reputation.
The group further displays its strengths through the segmentation of services which are serviced by
different subsidiaries. This is to enable each individual subsidiary to focus on their core which in turn will
retain the quality of service. Moreover, the number of subsidiaries allow the group to achieve a higher
bargaining power amongst its competitors and clients.
5.2 Weaknesses
A key weakness that can be witnessed here is that the group’s diversification into the hotels and
resorts industry face the similar price-sensitivity it faces in the construction industry. This suggests that
during the current economic downturn, the group will face an uphill struggle to remain profitable as both
industries will be relatively more negatively affected than other less price-sensitive industries.
6.0 STRATEGIC PLANS & CHALLENGES
6.1 Strategic Plans to seize opportunities
According to Sycal Ventures Berhad’s annual report, they have upcoming planned developments
in developing areassuchas Greentown and Klebang, Ipoh, Taiping, Sitiawan, Segariand Sri Iskandar Perak
with the potential total gross development value of RM 1.2 billion which will propel its Property
Development activities to remain as one of the main profit contributor for the company in the next 5 to 10
years.
14. 10
Furthermore, the group plans to expand one of their core business which is the Hotels & Resort
segment, by developing new hotels in key locations including the exclusive Pullman Hotel at Greentown,
Perak (Sycal Ventures Berhad, 2016).
6.2 Challenges
6.2.1 Global financial crisis
Global financial crisis may affect local currency. Businesses that often transact in a number of
different currencies due to purchasing raw materials from different countries, may be negatively affected
by the adverse currency exchange rate. (Investopedia, 2016) According to the analysis by Bloomberg, the
the ringgit has dropped 4 percent in the past three months to 4.2035 per dollar in Kuala Lumpur at 8 Nov
2016. Therefore, this will cause operating costs to increase which will reduce profitability.
6.2.2 Goods and Service Tax issue
Goods and Services Taxrequires the group to comply with stringent regulations which will increase
cost. Furthermore, non-compliance poses major threats such as penalties and lawsuit for the group.
6.2.3 Stringent lending policies by bank
In a downhill economy, the group may find it difficult to acquire financing in regards to its
worsening financial health. Thus, with this disability, the group may face threats of increased interest rates
which increases the cost to the business. Moreover, inability to acquire financing is a pervasive issue which
will disable the group’s ability to fund its projects.
15. 11
7.0 MAJOR CAPITALS
7.1 Major Capital Investment
In 2013, the Group had purchased RM 7,245,000 of property, plant and equipment as well as RM
63,000 in other investments. Property, plant and equipment which was purchased includes freehold office
lots and buildings; plant and machinery; motor vehicles; aircraft parts and equipment; office equipment,
furniture and fittings; and theme park (Sycal Venture Berhad – Annual Report 2013; pg 26).
In 2014, the Group had purchased RM 15,371,000 of property, plant and equipment as well as
RM 63,000 in other investments. Breakdown of property, plant and equipment purchases was same as the
previous year (Sycal Venture Berhad – Annual Report 2014; pg 26).
In 2015, the Group had purchased RM 16,882,000 of property, plant and equipment as well as
RM 63,000 in other investment. Breakdown of property, plant and equipment purchases is the same as the
previous year (Sycal Ventures Berhad – Annual Report 2015; pg 28).
7.2 Source offunding
From 2014, the major source of funding consists of bank borrowings RM 62,578,000. In 2015,
bank borrowings had decreased to RM 60,345,000 (Sycal Ventures Berhad – Annual Report 2015; pg
25).
16. 12
8.0 COMPANY’S CASH FLOW OVER THE LAST FIVE YEARS
Company’s Cash Flow
Statement Year
2011 2012 2013 2014 2015
Total of Cash and Cash
Equivalents (RM)
611,000 485,000 2,270,000 8,340,000 (4,260,000)
Differences (RM) - (126,000) 1,785,000 6,070,000 (12,600,000)
The group experienced a slight fall in cash and cash equivalents in the year of 2011 to 2012
amounting to RM 126k. However, this was immediately reversed when the company generated a cash
surplus of RM 1.7 million in the subsequent year. Additionally, the group also received a huge increase in
cashand cashequivalents amounting to RM 6 million. This suggeststhat the group has managed to improve
its liquidity despite the challenges it faces in a downhill economy.
In the year 2015, the company made a deficit of RM 12 million in cash and cash equivalents from
the previous year. In hindsight, this clearly indicate that the group is not generating sufficient cash to
confidently cover their costs and could pose as a huge threat.
17. 13
8.1 Major cash flow in the latest financial year
Pertaining to the latest operating cash flow below, the group faced a net cash outflow from
operating activities amounting to RM 426 k.
From the extract above, it is clear that the main contributor to the outflow of cash is from the
increase in trade receivables. This means that the group is displaying difficulty in its recoverability of its
debtors. This would then result in insufficient working capital to fund other operating activities which is
adverse to the group.
18. 14
Another major cash outflow hails from the group making large investments in plants and
equipments. As the investment requires time to observe its results, the group can be expected to reap
economic benefits from its investments made.
The major cash outflow from financing activities consists of the repayment of loans amounting to
RM 2 million. As this would mean a healthier debt position, the group may also face liquidity issues
pertaining to its working capital.
19. 15
8.2 Cash and Cash Equivalents
In conclusion, it clearly indicates that the net changes in cash and cash equivalents is huge from an
inflow in 2014 to an outflow in 2015. This also suggests that the group is not competent enough to maintain
its current cash probably due to the worsening economy.
20. 16
9.0 COMPANY’S FREE CASH FLOW IN THE RECENT FIVE YEARS
Year 2011 RM
Net Operating Activities 1,436,000.00
Purchasing Property, Plant & Equipment (908,000.00)
Total FCF 528,000.00
Year 2012 RM
Net Operating Activities 21,420,000.000
Purchasing Property, Plant & Equipment (40,000.00)
Total FCF 21,380,000.00
21. 17
Year 2013 RM
Net Operating Activities (14,148,000.00)
Purchasing Property, Plant & Equipment (407,000.00)
Total FCF (14,555,000.00)
Year 2014 RM
Net Operating Activities (41,770,000.00)
Purchasing Property, Plant & Equipment (1,401,000.00)
Total FCF (43,171,000.00)
22. 18
Year 2015 RM
Net Operating Activities (426,000.00)
Purchasing Property, Plant & Equipment (1,047,000.00)
Total FCF (1,473,000.00)
Total amount of Free Cash Flow from Year 2011 to 2015
Year of Company’s Free Cash Flow (FCF) Total in RM
31st
of December 2011 528,000.00
31st
of December 2012 21,380,000.00
31st
of December 2013 (14,555,000.00)
31st
of December 2014 (43,171,000.00)
31st
of December 2015 (1,473,000.00)
23. 19
Total Free Cash Flow in 5 Years (34,291.00)
Free cash flow indicates how much cash is available from operating cash flow after accounting for
capital expenditures required to maintain current production capacity.
Initially, the group was experiencing an increasing cash inflows from RM 528k to RM 21 million
from 2011 to 2012. This suggests a healthy liquidity for the group although it may be argued that the
opportunity cost of holding large sums of cash is high.
The situation changed drastically from 2013 to 2015 as the group experienced huge cash outflows.
This may be due to its major capital investments in the 3 years as stated above. Although the group was
susceptible to liquidity issues, the capital investments made commencesto reap economic benefits as shown
in the year 2015 when the total cash outflow decreased drastically. Thus, it is probable that the group will
experience cash inflows in the future.
24. 20
10.0 SYCAL VENTURES BERHAD’S FINANCIAL PERFORMANCE
10.1 Liquidity
2015 2014 2013 2012 2011
a. Current Ratio
current assets
current liabilities
434,729,000
225,848,000
= 1.92
443,676,000
224,002,000
= 1.98
328,261,000
211,296,000
= 1.55
192,754,000
132,343,000
= 1.46
190,409,000
113,703,000
= 1.67
b. Quick Ratio
cash+accounts receivable
current liabilities
5,205,000+
173,076,000
225,848,000
= 0.79
9,720,000+
172,333,000
224,002,000
= 0.81
3,529,000+
160,551,000
211,296,000
= 0.78
2,425,000+
36,812,000
132,343,000
= 0.30
1,199,000+
51,329,000
113,703,000
= 0.46
Ratio Analysis Year Changes Year Changes Year Changes Year Changes
2011 2012 2012 2013 2013 2014 2014 2015
Current Ratio 1.67 1.46 -0.21 1.46 1.55 +0.09 1.55 1.98 +0.43 1.98 1.92 -0.06
The current ratio has decreased by 0.21 from the Year 2011 to the Year 2012. This is because of a larger increase in current
liabilities relative to only a small increase in current assets. This means that the group may have increased difficulty in
meeting its short and long term obligations. However,this is offset by the improving liquidity as shown in the in the years
2012 to 2013 (0.09%) and 2013 to 2014 (0.43). This is evidenced by the large increase in current assets such as cash and cash
equivalents. In the year 2014 to 2015, the group experienced a fall of 0.06 in their current ratio which was caused by a slight
increase in current liabilities.
25. 21
Quick Ratio 0.46 0.30 -0.16 0.30 0.78 +0.48 0.78 0.81 +0.03 0.81 0.79 -0.02
In 2011 to 2012, the group has suffered a fall in quick ratio of 0.16. The fall could be attributed to the relatively higher increase
in current liabilites to its current assets.
The reversed occurred in the subsequent years from 2012 to 2013 and 2013 to 2014 when the group has improved its quick
ratio by 0.48 and 0.03 respectively.
In 2015, the group then experiences a slight fall by 0.02 in its quick ratio.
Overall, the group appears to be able to maintain healthy liquidity ratios (current and quick ratio) which are above 1.5 and 0.5 in the recent
years despite the downturn of the economy. Also, taking into account their prior performances in the earlier years, this clearly indicate that the group
managed to escape issues of having poor liquidity performances.
26. 22
10.2 Activity
2015 2014 2013 2012 2011
a. Inventory turnover
Cost of goods sold
Inventory
280,540,000
19,932,000
=14.07x
363,933,000
19,811,000
=18.37x
260,573,000
6,589,000
=39.55x
148,907,000
8,161,000
=18.25x
83,241,000
7,789,000
=10.69x
b. Average collection
period
Accounts receivables
Daily credit sales
189,939,000
297,652,000 x 365
=233.6 days
176,130,000
384,514,000 x 365
=167.4 days
112,942,000
272,125,000 x 365
=151.5 days
51,522,000
157,327,000 x 365
=119.5 days
48,676,000
89,006,000 x 365
=199.6 days
c. Total asset
turnover
Sales
Total assets
321,717,000
434,729,000
=0.74x
407,383,000
443,676,000
=0.92x
292,327,000
328,261,000
=0.89x
169,406,000
192,754,000
=0.88x
100,131,000
190,409,000
=0.53x
27. 23
Ratio Analysis Year Changes Year Changes Year Changes Year Changes
2011 2012 2012 2013 2013 2014 2014 2015
Inventory
turnover
10.69 18.25 +7.56 18.25 39.55 +21.30 39.55 18.37 -21.10 18.37 14.07 -4.3
7.56 times has increased in the inventory turnover ratio from Year 2011 to Year 2012. It is because there is a higher increase
in cost of goods sold but only a slightly increase inventory.
21.30 times has increased in the inventory turnover ratio from Year 2012 to Year 2013. It is because there is a higher increase
in cost of goods sold but only a slightly increase in inventory.
21.10 times has decreased in the inventory turnover ratio from Year 2013 to Year 2014. It is because there is only a slightly
increase in cost of goods sold but a higher increase in inventory.
4.3 times has decreased in the inventory turnover ratio from Year 2014 to Year 2015. It is because there is only a slightly
increase in cost of goods sold but a higher increase in inventory.
Average
collection
period
199.6 119.5 -80.1 119.5 151.5 +32.0 151.5 167.4 +15.9 167.4 233.6 +66.2
The ratio of Average collection period is decreased in 80.1 days from 2011 to 2012. The reason is as the increased ratio in
average account receivable is lesser than the ratio that increased in daily credit sales.
The ratio of Average collection period is increased in 32 days from 2012 to 2013. The reason is as the increased ratio in
average account receivable is greater than the ratio that increased in daily credit sales.
The ratio of Average collection period is increased in 15.9 days from 2013 to 2014. The reason is as the increased ratio in
average account receivable is greater than the ratio that increased in daily credit sales.
The ratio of Average collection period has increased in 66.2 days from 2014 to 2015. The reason is as the increased ratio in
average account receivable is greater than the ratio that increased in daily credit sales.
28. 24
Total asset
turnover
0.53 0.88 +0.35 0.88 0.89 +0.01 0.89 0.92 -0.03 0.92 0.74 -0.18
0.35 times has increased in the total asset turnover ratio from Year 2011 to Year 2012. It is because there is a higher increase
in sales but only a slightly increase in total assets.
0.01 times has increased in the total asset turnover ratio from Year 2012 to Year 2013. It is because there is a higher increase
in sales but only a slightly increase in total assets.
0.03 times has decreased in the total asset turnover ratio from Year 2013 to Year 2014. It is because there is only a slightly
increase in sales but a higher increase in total assets.
0.18 times has decreased in the total asset turnover ratio from Year 2013 to Year 2014. It is because there is only a slightly
increase in sales but a higher increase in total assets.
The group has displayed its ability to attain good inventory turnover rates at its earlier years,but has drastically worsened in the recent
years. This has been reflected in its falling revenue in the recent years as well. Average collection period has improved yearly which shows the
group’s effort in collecting debts despite the worsening economy. Finally, the total asset turnover has decelerated its performance in its recent
years. This indicates the company is not managing its assets efficiently to generate revenue.
29. 25
10.3 Debt
2015 2014 2013 2012 2011
a. Debt Ratio
Total liabilities
Total assets
286,193,000
528,225,000
=0.54
286,580,000
511,862,000
=0.56
215,311,000
405,161,000
=0.53
142,879,000
315,140,000
=0.45
128,539,000
291,673,000
=0.44
b. Debt to Equity
Total liabilities
Common stock equity
286,193,000
242,032,000
=1.18
286,580,000
225,282,000
=1.27
215,311,000
189,850,000
=1.13
142,879,000
172,261,000
=0.83
128,539,000
163,134,000
=0.79
c. Interest cover ratio
Operating profits
Interest expense
24,603,000
1,593,000
=15.44
29,195,000
1,480,000
=19.73
20,427,000
228,000
=89.59
12,748,000
917,000
=13.90
6,927,000
1,876,000
=3.69
30. 26
Ratio Analysis Year Changes Year Changes Year Changes Year Changes
2011 2012 2012 2013 2013 2014 2014 2015
Debt Ratio 0.44 0.45 +0.01 0.45 0.53 +0.08 0.53 0.56 +0.03 0.56 0.54 -0.02
The debt ratio is increased by 0.01 from the Year 2011 to the Year 2012. This is because there is an increment in total
liabilities to total assets.
The debt ratio is increased by 0.08 from the Year 2012 to the Year 2013. This is because there is an increment in total
liabilities to total assets.
The debt ratio is increased by 0.03 from the Year 2013 to the Year 2014. This is because there is an increment in total
liabilities to total assets.
The debt ratio is decreased by 0.02 from the Year 2014 to the Year 2015. This is because there is only a small increment in
total liabilities to total assets.
Debt to Equity 0.79 0.83 +0.04 0.83 1.13 +0.30 1.13 1.27 +0.14 1.27 1.18 -0.09
The ratio of debt to equity is increased in 0.04 from 2011 to 2012. The reason is as the increased ratio in the total liabilities is
lesser than the ratio that increased in the total equity.
The ratio of debt to equity is increased in 0.30 from 2012 to 2013. The reason is as the increased ratio in the total liabilities is
lesser than the ratio that increased in the total equity.
The ratio of debt to equity is increased in 0.14 from 2013 to 2014. The reason is as the increased ratio in the total liabilities is
greater than the ratio that increased in the total equity.
The ratio of debt to equity has reduced in 0.09 for the Year of 2014 to the Year of 2015. The reason is as the increased ratio
in the total liabilities is lesser than the ratio that increased in the total equity.
31. 27
Interest cover
ratio
3.69 13.90 +10.21 13.90 89.59 +75.69 89.59 19.73 -69.86 19.73 15.44 -4.29
10.21 times has increased in the interest coverage ratio from Year 2011 to Year 2012. It is because there is a higher increase
in the interest expense but only a slightly increase in profit before taxes and interest.
75.69 times has increased in the interest coverage ratio from Year 2012 to Year 2013. It is because there is a higher increase
in the interest expense but only a slightly increase in profit before taxes and interest.
69.86 times has decreased in the interest coverage ratio from Year 2013 to Year 2014. It is because there is a greater increase
in the interest expense but only a slightly increase in profit before taxes and interest.
4.29 times has decreased in the interest coverage ratio from Year 2013 to Year 2014. It is because there is a greater increase
in the interest expense but only a slightly increase in profit before taxes and interest.
Overall, the group faces increasing debt in the recent years as it is reflected in its major funding which are from bank borrowings. This has
not only caused the group to appear highly geared but also may have difficulty in repaying its interest incurred This can be seen from its worsening
interest cover ratio.
32. 28
10.4 Profitability
2015 2014 2013 2012 2011
a. Gross Profit Margin
Gross profit
Revenue
41,177,000
321,717,000
=0.13
43,450,000
407,383,000
=0.11
31,754,000
292,327,000
=0.11
20,499,000
169,406,000
=0.12
16,890,000
87,322,000
=0.19
b. Return on Assets
Net income
Total assets x 100%
18,452,000
528,225,000 x 100%
=3.49%
35,804,000
511,862,000 x 100%
=6.99%
17,977,000
405,161,000 x 100%
4.44%
8,936,000
315,140,000 x 100%
=2.84%
5,200,000
291,673,000 x
100%
=1.78%
c. Return on Equity
Net income
Shareholders’ equity x 100%
18,452,000
238,203,000 x 100%
=7.75%
35,804,000
222,312,000 x 100%
=16.11%
17,977,000
187,685,000 x 100%
9.58%
8,936,000
170,641,000 x 100%
=5.24%
5,200,000
161,543,000 x
100%
=3.22%
33. 29
Ratio
Analysis
Year Changes Year Changes Year Changes Year Changes
2011 2012 2012 2013 2013 2014 2014 2015
Gross Profit
Margin
0.19 0.12 -0.07 0.12 0.11 -0.01 0.11 0.11 +0.00 0.11 0.13 +0.02
The gross profit margin is decreased by 0.07 from the Year 2011 to the Year 2012. This is because there is a lower increment
in gross profit to revenue.
The gross profit margin is decreased by 0.01 from the Year 2012 to the Year 2013. This is because there is a lower increment
in gross profit to revenue.
The gross profit margin remains the same from the Year 2013 to the Year 2014. This is because the increment in gross profit to
revenue is equal.
The gross profit margin is increased by 0.02 from the Year 2014 to the Year 2015. This is because there is a higher increment
in gross profit to revenue.
Return on
Assets
1.78% 2.84% +1.06% 2.84% 4.44% +1.60% 4.44% 6.99% +2.55% 6.99% 3.49% -3.50%
The return on assets is increased in 1.06% from 2011 to 2012. The reason is as the increased ratio in the net income is greater
than the ratio that increased in total assets.
The return on assets is increased in 1.60% from 2012 to 2013. The reason is as the increased ratio in the net income is greater
than the ratio that increased in total assets.
The return on assets is increased in 0.14 from 2013 to 2014. The reason is as the increased ratio in the net income is greater
than the ratio that increased in total assets.
The return on assets has reduced in 0.09 for the Year of 2014 to the Year of 2015. The reason is as the increased ratio in the net
income is lesser than the ratio that increased in total assets.
34. 30
Return on
Equity
3.22% 5.24% +2.02% 5.24% 9.58% +4.34% 9.58% 16.11% +6.53% 16.11% 7.75% -8.36%
The return on equity is increased in 2.02% from 2011 to 2012. The reason is as the increased ratio in the net income is greater
than the ratio that increased in shareholder’s equity.
The return on equity is increased in 4.34% from 2012 to 2013. The reason is as the increased ratio in the net income is greater
than the ratio that increased in shareholder’s equity.
The return on equity is increased in 6.53% from 2013 to 2014. The reason is as the increased ratio in the net income is greater
than the ratio that increased in shareholder’s equity.
The return on equity is decreased in 8.36% from 2014 to 2015. The reason is as the increased ratio in the net income is lesser
than the ratio that increased in shareholder’s equity.
All in all, the gross profit margin has improved in piecemeal, this can be explained by the difficulty of the group in generating revenue.
The group’s return on assets and equity have, however, improved in all the years except for 2015. This could be due to the group incurring heavy
expenses such as bad debts in the current situation of the economy which reduces profits.
35. 31
10.5 Market Performance
2015 2014 2013 2012 2011
a. Earnings per Share
Net income
Total outstanding
common shares
17,293,000
320,250,000
=0.05
34,999,000
320,250,000
=0.11
17,432,000
320,250,000
=0.06
8,907,000
288,256,000
=0.03
5,056,000
251,959,000
=0.02
b. Price / Earnings
Market value per share
Earnings per share
0.41
0.05
=8.20
0.33
0.11
=3.00
0.28
0.06
=4.67
0.18
0.03
=6.00
0.20
0.02
=10.00
c. Price / Book Ratio
Market value per share
Equity book value /
share
0.41
0.74
=0.55
0.33
0.69
=0.48
0.28
0.59
=0.47
0.18
0.59
=0.31
0.20
0.64
=0.31
Ratio Analysis Year Changes Year Changes Year Changes Year Changes
2011 2012 2012 2013 2013 2014 2014 2015
Earnings per
share
0.02 0.03 +0.01 0.03 0.06 +0.03 0.06 0.11 +0.05 0.11 0.05 -0.06
The earnings per share is increased with RM0.01 from 2011 to 2012. The reason is as the increased ratio in net income is
greater than the ratio that increased in total common outstanding shares.
The earnings per share is increased with RM0.03 from 2012 to 2013. The reason is as the increased ratio in net income is
greater than the ratio that increased in total common outstanding shares.
The earnings per share is increased with RM0.05 from 2013 to 2014. The reason is as the increased ratio in net income is
greater than the ratio that increased in total common outstanding shares.
36. 32
The earnings per share is decreased with RM0.06 from 2014 to 2015. The reason is as the increased ratio in net income is
lesser than the ratio that increased in total common outstanding shares.
Price/ earnings
ratio
10.00 6.00 -4.00 6.00 4.67 -1.33 4.67 3.0 -1.67 3.00 8.20 +5.20
The price/ earnings ratio is decreased with 4.0 times from 2011 to 2012. The reason is as the increased ratio in market value
per share is lesser than the ratio that increased in earnings per share.
The price/ earnings ratio is decreased with 1.33 times from 2012 to 2013. The reason is as the increased ratio in market value
per share is lesser than the ratio that increased in earnings per share.
The price/ earnings ratio is decreased with 1.67 times from 2013 to 2014. The reason is as the increased ratio in market value
per share is lesser than the ratio that increased in earnings per share.
The price/ earnings ratio is increased with 5.20 times from 2014 to 2015. The reason is as the increased ratio in market value
per share is greater than the ratio that increased in earnings per share.
Price/ book ratio 0.31 0.31 +0.0 0.31 0.47 +0.16 0.47 0.48 +0.01 0.48 0.55 +0.07
The price/ book ratio is remained unchanged from 2011 to 2012. The reason is as the increased ratio in market value per
share is lesser than the ratio that increased in equity book value/ shares.
The price/ book ratio is increased with 0.16 times from 2012 to 2013. The reason is as the increased ratio in market value per
share is greater than the ratio that increased in equity book value/ shares.
The price/ book ratio is increased with 0.01 times from 2013 to 2014. The reason is as the increased ratio in market value per
share is greater than the ratio that increased in equity book value/ shares.
The price/ book ratio is increased with 0.07 times from 2014 to 2015. The reason is as the increased ratio in market value per
share is greater than the ratio that increased in equity book value/ shares.
Apart from earnings per share,the group has improved its price/earnings and price/book ratio. This has increased the attractiveness of the
shares in the stock exchange.
37. 33
11.0 FORECAST REVENUE GROWTH
2015 2016
RM'000
% of
Revenue RM'000
Revenue 321,717 100.0% 341,020
Cost ofSales (280,540) -87.2% (297,372)
Gross Profit 41,177 12.8% 43,648
Other Operation Income 6,426 2.0% 6,812
47,603 14.8% 50,459
Administration Expenses (10,854) -3.4% (11,505)
Other Operating Expenses (13,211) -4.1% (14,004)
Profit/(Loss) From Operations 23,538 7.3% 24,950
Finance Costs (1,727) -0.5% (1,831)
Profit/(Loss) Before Taxation 21,811 6.8% 23,120
Taxation (3,359) -1.0% (3,561)
Profit/(Loss) For the Year 18,452 5.7% 19,559
Other Comprehensive Income (1,402) -0.4% (1,486)
Total Comprehensive Income/(Loss)
for the Year
17,050 5.3% 18,073
Table 1.2: Shows the assumed revenue growth of 6% for FY2016
38. 34
)1()()( 2
11
DPSS
S
L
S
S
A
RNF
Required New Funds (RNF)
A/S = Percentage relationship of variable assets to sales
S = Change in sales
L/S = Percentage relationship of variables liabilities to sales
P = Profit margin
S2 = New sales level
D = Dividen payout ratio
Calculations in RM’000
434,729
(19,303) -
225,848
(19,303) - (
17,293
) (341,020) (1-0)
321,717 321,717 321,717
= 135%(19,303) - 70%(19,303) - (5.4%)(341,020)(1)
= 26,084 - 13,551 - 18,331
= (5,793)
Hence, from the calculations and information above, the company does not required to find any required
new funds to fund this sales growth.
39. 35
12.0 CONCLUSION & RECOMMENDATIONS
In conclusion, the group appears to have worsening performance in the year ended 2015 as
compared to prior years. Most of these can be attributed to the downturn in the economy especially since
the group operates in a price sensitive/elastic industry. Despite that, the group still managed to maintain its
financial health mainly by diversifying its revenue streams from those badly affected. The market
performance is another indicator that despite the fall in net profits, the group managed to retain an attractive
figure in the market.
Improvements should be made at generating new revenue as it has been displayed that revenue is
affected the worst amongst all. The utilization of assets should also be taken into consideration as it is the
main driver for generating economic benefits.
52. 48
13.2 Ratio Formulas
Current Ratio =
current assets
current liabilities
Quick Ratio =
cash+accounts receivable
current liabilities
Inventory
turnover
=
Cost of goods sold
Inventory
Average
collection
period
=
Accounts receivables
Daily credit sales
Total asset
turnover
=
Sales
Total assets
Debt Ratio =
Total liabilities
Total assets
Debt to Equity =
Total liabilities
Common stock equity
Time Interest
Earned
=
Operating profits
Interest expense
Fixed
payment
coverage ratio
=
EBIT+EBT
Interest+EBT
Gross Profit
Margin
=
Gross profit
Revenue
Return on
Assets
=
Net income
Total assets x 100%
Return on
Equity
=
Net income
Shareholders’ equity x 100%
53. 49
Earnings per
Share
=
Net income
Total outstanding common
shares
Price/Earnings =
Market value per share
Earnings per share
Price/Book
Ratio
=
Market value per share
Equity book value / share
54. 50
14.0 REFERENCES
1. Find Company Stocks - Lookup Stock symbol,Share Prices, Charts,Company Information |
In.reuters.com. (2016). Reuters India. Retrieved 21 November 2016, from
http://in.reuters.com/finance/stocks/overview?symbol=SYCA.K
2. Audit Committees: The Roles and Responsibilities. (2016). Grfcpa.com. Retrieved 21 November
2016, from http://www.grfcpa.com/resources/publications/audit-committee-responsibilities/
3. About Risk Management Committees: An Invaluable Resource. (2016). Nonprofitrisk.org.
Retrieved 21 November 2016, from
http://www.nonprofitrisk.org/tools/hallmarks/tools/1aboutRMcommittees.doc
4. Diversification. (2016). Investopedia.Retrieved 21 November 2016, from
http://www.investopedia.com/terms/d/diversification.asp
5. Dutch housing market prospects: strong salesand rising prices.(2016). Rabobank.Retrieved 21
November 2016, from https://economics.rabobank.com/publications/2016/may/dutch-housing-
market-prospects-strong-sales-and-rising-prices/
6. Free Cash Flow - FCF. (2016). Investopedia. Retrieved 21 November 2016, from
http://www.investopedia.com/terms/f/freecashflow.asp
7. Guide, G. (2016). Malaysia’s property market slowing sharply. Global Property Guide. Retrieved
21 November 2016, from http://www.globalpropertyguide.com/Asia/malaysia
8. Guide, G. (2016). Malaysia’s property market slowing sharply. Global Property Guide. Retrieved
21 November 2016, from http://www.globalpropertyguide.com/Asia/malaysia/Price-History
9. Malaysia Economic Outlook. (2016). Focus Economics.Retrieved 21 November 2016, from
http://www.focus-economics.com/countries/malaysia
10. Malaysia House Price Index | 1997-2016 | Data | Chart | Calendar | Forecast. (2016).
Tradingeconomics.com. Retrieved 21 November 2016, from
http://www.tradingeconomics.com/malaysia/housing-index
11. Property market in Malaysia may peak in 2020.(2016). ASEAN Today.Retrieved 21 November
2016, from https://www.aseantoday.com/2016/02/property-market-in-malaysia-may-peak-in-
2020/
12. Ratio Analysis: Using Financial Ratios | Investopedia. (2016). Investopedia.Retrieved 21
November 2016, from http://www.investopedia.com/university/ratio-analysis/using-ratios.asp
13. Sycal Ventures Annual Report. (2011). Sycal Berhad.Retrieved 21 November 2016, from
http://www.sycalberhad.com/assets/sycal-ar-2011.pdf
55. 51
14. Sycal Ventures Annual Report. (2012). Sycal Berhad.Retrieved 21 November 2016, from
http://www.sycalberhad.com/assets/sycal-ar-2012.pdf
15. Sycal Ventures Annual Report. (2013). Sycal Berhad.Retrieved 21 November 2016, from
http://www.sycalberhad.com/assets/sycal-ar-2013.pdf
16. Sycal Ventures Annual Report. (2014). Sycal Berhad.Retrieved 21 November 2016, from
http://www.sycalberhad.com/assets/sycal-ar-2014.pdf
17. Sycal Ventures Annual Report. (2015). Sycal Berhad.Retrieved 21 November 2016, from
http://www.sycalberhad.com/assets/sycal-ar-2015.pdf
18. Sycal Ventures Berhad Company Profile.(2016). EMIS. Retrieved 21 November 2016, from
https://www.emis.com/php/companyprofile/MY/Sycal_Ventures_Berhad_en_2357138.html