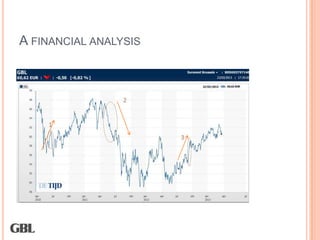
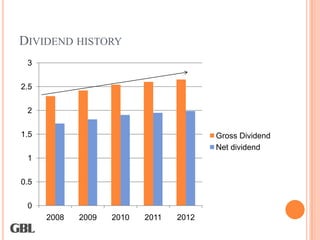
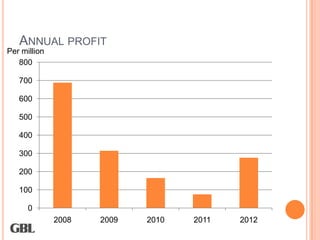
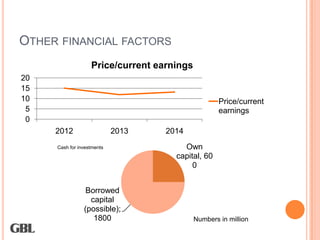
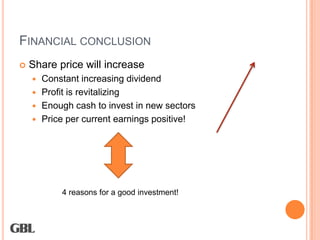
A FINANCIAL REPORT ABOUT GBL
SUMMARY
 Intro
 Financial analysis
     Evolution of the share Price
     Dividend history
     Annual profit


   Conclusion
WHO AND WHAT IS GBL
 GBL stands for ‘Groupe Bruxelles Lambert’
 A Belgian industrial holding company

 BEL 20

 Stock market capitalization : 9,6 billion

 Listed on stock exchange since 1956
A FINANCIAL ANALYSIS


   1
DIVIDEND HISTORY
 3

2.5

 2

1.5                                      Gross Dividend
                                         Net dividend
 1

0.5

 0
      2008   2009   2010   2011   2012
ANNUAL PROFIT
Per million
   800

   700

   600

   500

   400

   300

   200

   100

      0
              2008   2009   2010   2011   2012
OTHER FINANCIAL FACTORS
                   Price/current earnings
20
15
10                                                  Price/current
 5                                                  earnings
 0
     2012                   2013   2014
     Cash for investments              Own
                                     capital, 60
                                          0


                 Borrowed
                  capital
                (possible);
                   1800                     Numbers in million
FINANCIAL CONCLUSION
   Share price will increase
     Constant increasing dividend
     Profit is revitalizing
     Enough cash to invest in new sectors
     Price per current earnings positive!


           4 reasons for a good investment!
   Thank you for your attention!

A financial report about GBL

  • 1.
  • 2.
    SUMMARY  Intro  Financialanalysis  Evolution of the share Price  Dividend history  Annual profit  Conclusion
  • 3.
    WHO AND WHATIS GBL  GBL stands for ‘Groupe Bruxelles Lambert’  A Belgian industrial holding company  BEL 20  Stock market capitalization : 9,6 billion  Listed on stock exchange since 1956
  • 4.
  • 5.
    DIVIDEND HISTORY 3 2.5 2 1.5 Gross Dividend Net dividend 1 0.5 0 2008 2009 2010 2011 2012
  • 6.
    ANNUAL PROFIT Per million 800 700 600 500 400 300 200 100 0 2008 2009 2010 2011 2012
  • 7.
    OTHER FINANCIAL FACTORS Price/current earnings 20 15 10 Price/current 5 earnings 0 2012 2013 2014 Cash for investments Own capital, 60 0 Borrowed capital (possible); 1800 Numbers in million
  • 8.
    FINANCIAL CONCLUSION  Share price will increase  Constant increasing dividend  Profit is revitalizing  Enough cash to invest in new sectors  Price per current earnings positive! 4 reasons for a good investment!
  • 9.
    Thank you for your attention!