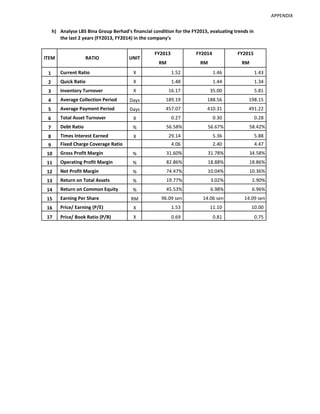
LBS Bina Group Berhad's financial condition from FY2013 to FY2015 is analyzed. Key financial ratios like current ratio, quick ratio, inventory turnover, average collection period, debt ratio, times interest earned, gross profit margin, net profit margin, and return on assets declined from FY2013 to FY2014 but recovered slightly or remained stable from FY2014 to FY2015. Total assets increased over the period while debt levels also rose. Profits fell sharply from FY2013 to FY2014 and recovered modestly from FY2014 to FY2015.